Connected scatter plot with geom_path
Path
Given two variables in a data frame you can draw the path between them with geom_path.
# install.packages("ggplot2")
library(ggplot2)

# Data
x <- c(1, 2, 3, 4, 5, 4, 7, 8, 9)
y <- c(12, 16, 14, 18, 16, 13, 15, 20, 22)
df <- data.frame(x, y)

# Connected scatter plot
ggplot(df, aes(x = x, y = y)) +
  geom_path()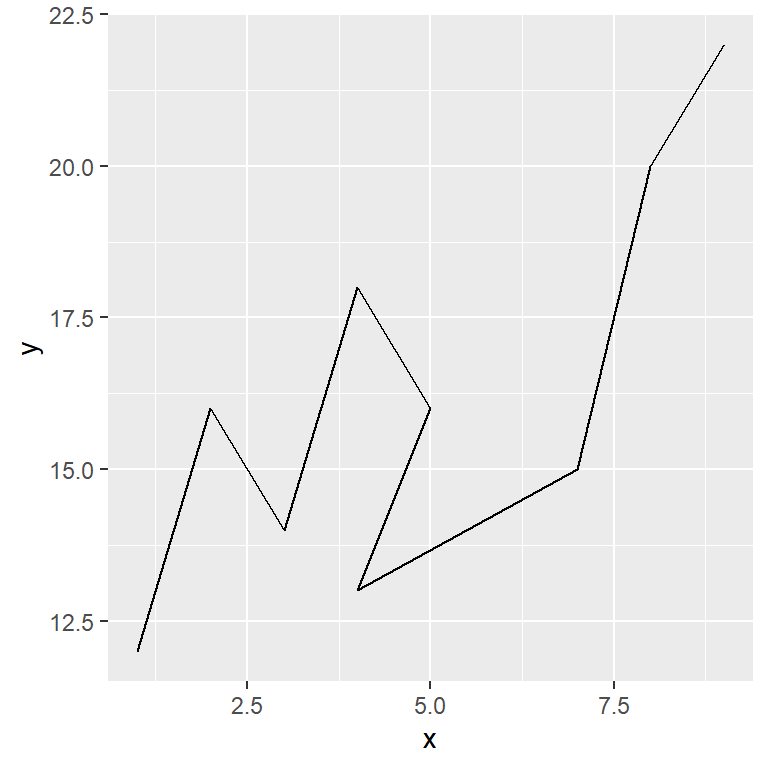
Observations
You can highlight the values with geom_point.
# install.packages("ggplot2")
library(ggplot2)

# Data
x <- c(1, 2, 3, 4, 5, 4, 7, 8, 9)
y <- c(12, 16, 14, 18, 16, 13, 15, 20, 22)
df <- data.frame(x, y)

# Connected scatter plot
ggplot(df, aes(x = x, y = y)) +
  geom_path() +
  geom_point(size = 2)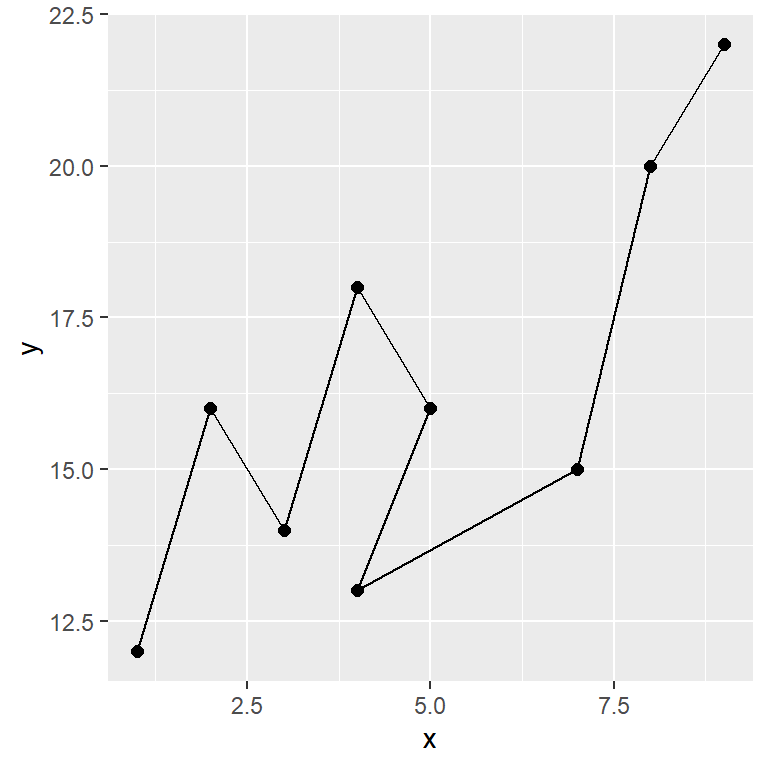
Labelling points
You can label each observation making use of geom_text. In this example we are going to add some dates.
# install.packages("ggplot2")
library(ggplot2)

# Data
x <- c(1, 2, 3, 4, 5, 4, 7, 8, 9)
y <- c(12, 16, 14, 18, 16, 13, 15, 20, 22)
labels <- 2013:2021
df <- data.frame(x, y, labels = labels)

# Connected scatter plot
ggplot(df, aes(x = x, y = y)) +
  geom_path(color = 4) +
  geom_point(size = 2, color = 4) +
  geom_text(aes(label = labels, x = x + 0.7, y = y))
Adding arrows
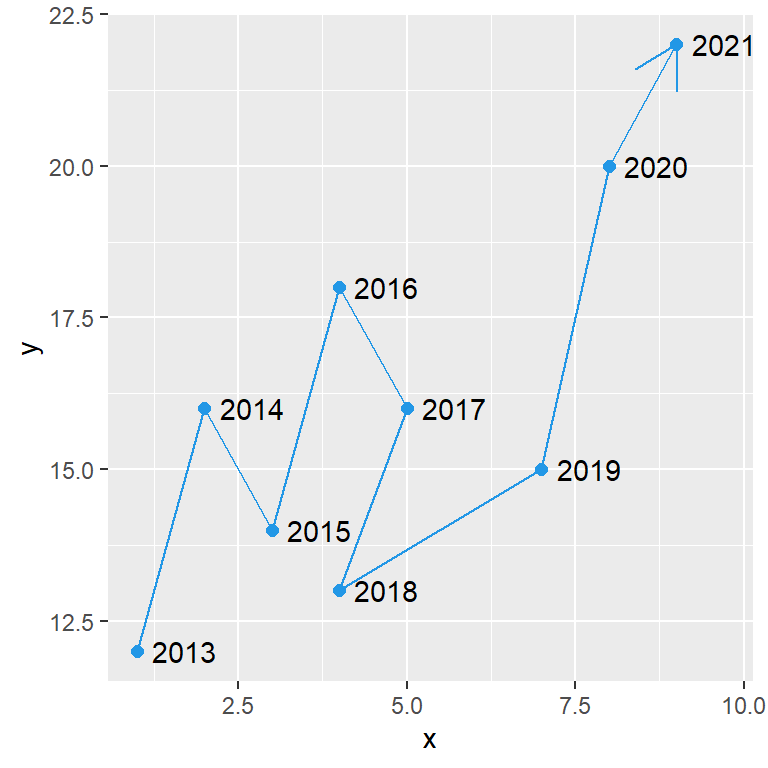
You can pass the arrow function to the arrow argument of the geom_path function to add an arrow to the end of the path.
# install.packages("ggplot2")
library(ggplot2)

# Data
x <- c(1, 2, 3, 4, 5, 4, 7, 8, 9)
y <- c(12, 16, 14, 18, 16, 13, 15, 20, 22)
labels <- 2013:2021
df <- data.frame(x, y, labels = labels)

# Connected scatter plot
ggplot(df, aes(x = x, y = y)) +
  geom_path(color = 4, arrow = arrow()) +
  geom_point(size = 2, color = 4) +
  geom_text(aes(label = labels, x = x + 0.7, y = y))
However, if you use geom_segment as follows you can add an arrow between each pair of observations.
# install.packages("ggplot2")
library(ggplot2)

# Data
x <- c(1, 2, 3, 4, 5, 4, 7, 8, 9)
y <- c(12, 16, 14, 18, 16, 13, 15, 20, 22)
labels <- 2013:2021
df <- data.frame(x, y, labels = labels)

# Connected scatter plot
ggplot(df, aes(x = x, y = y)) +
  geom_segment(aes(xend = c(tail(x, n = -1), NA),
                   yend = c(tail(y, n = -1), NA)),
               arrow = arrow(length = unit(0.4, "cm")),
               color = 4) +
  geom_point(size = 2, color = 4) +
  geom_text(aes(label = labels, x = x + 0.7, y = y))
Master Statistics
Learn statistics from the basics to advanced techniques, clearly explained
Go to site