Basic color image
The image function can be used to display spatial data (images), creating a grid of colored rectangles based on the values of the matrix z. The arguments x and y can be used to specify the grid where the values of z are measured.
# Data
x <- -10:10
y <- -10:10
z <- sqrt(outer(x ^ 2, y ^ 2, "+"))

image(x, y, z)

# You can also type, the following
# but the axes will be between 0 and 1
image(z)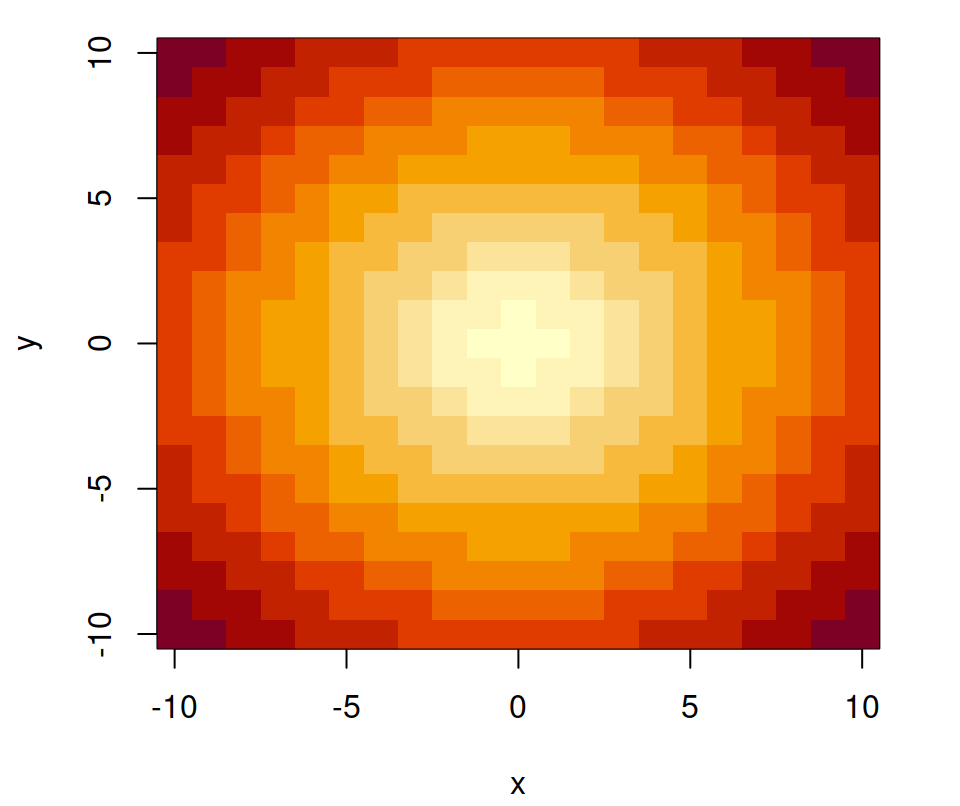
Color customization
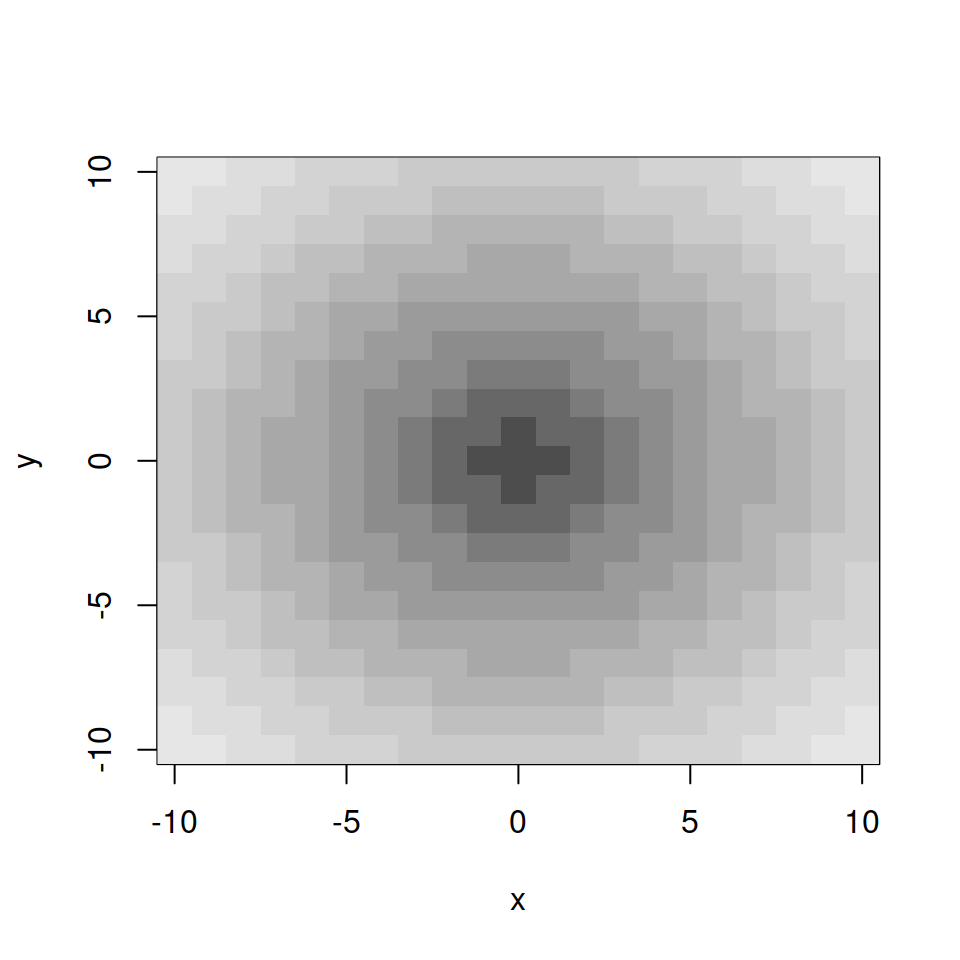
The col argument allows customizing the color palette of the image. You can pass as variable a function such as gray.colors, topo.colors, hcl.colors or a similar function. The default value is hcl.colors(12, "YlOrRd", rev = TRUE).
# Data
x <- -10:10
y <- -10:10
z <- sqrt(outer(x ^ 2, y ^ 2, "+"))

image(x, y, z, col = gray.colors(12))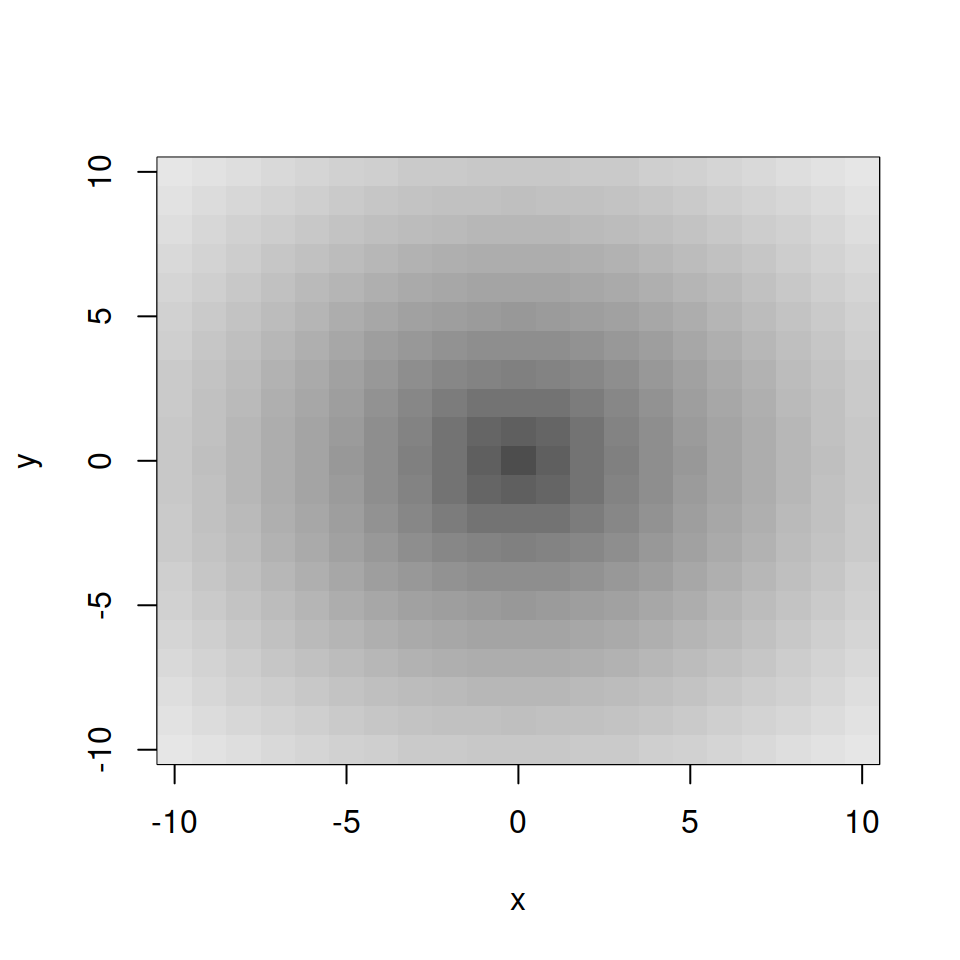
Note that if you increase the number of values the color image will be smoothed.
# Data
x <- -10:10
y <- -10:10
z <- sqrt(outer(x ^ 2, y ^ 2, "+"))

image(x, y, z, col = gray.colors(50))
Overlaying a contour
It is possible to overlay the contour lines over the color image, passing the same data to the function and specifying add = TRUE.
# Data
x <- -10:10
y <- -10:10
z <- sqrt(outer(x ^ 2, y ^ 2, "+"))

image(x, y, z)
contour(x, y, z, add = TRUE)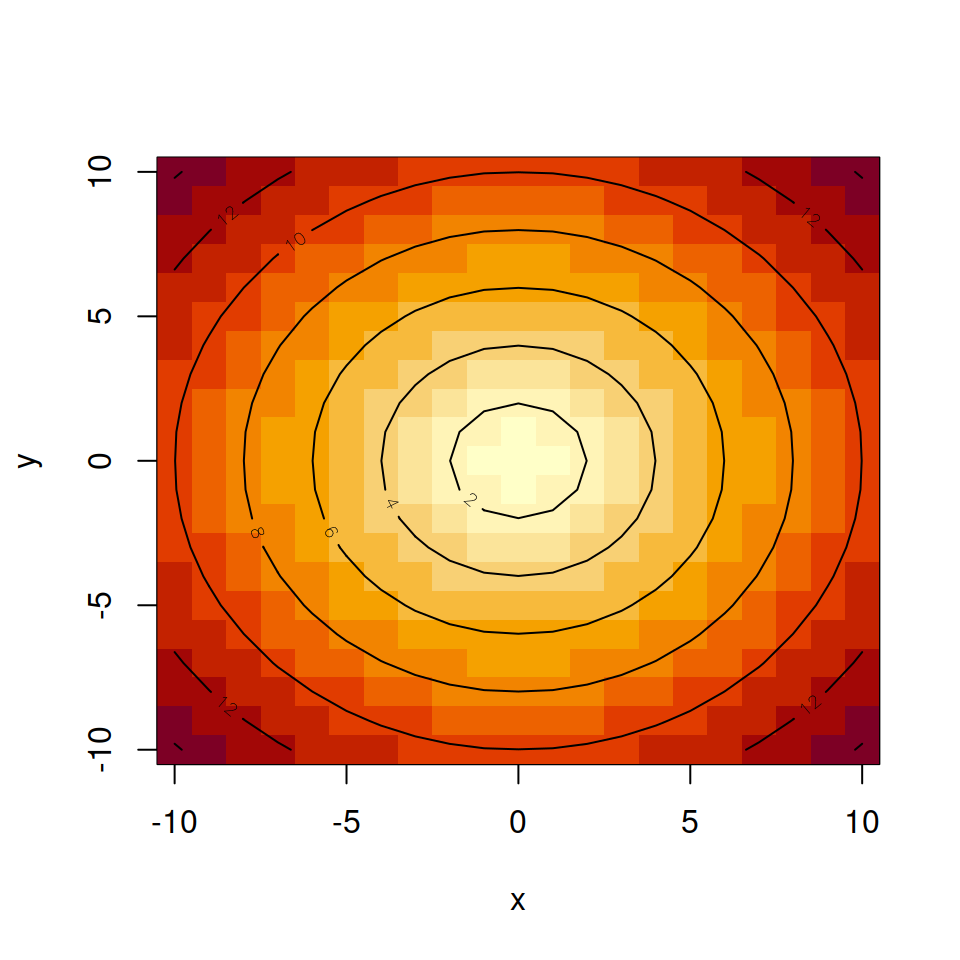

Master Statistics
Learn statistics from the basics to advanced techniques, clearly explained
Go to site