The pairs function
In base R you can create a pairwise correlation plot with the pairs function. Note that this is the same as plotting a numeric data frame with plot.
# Numeric variables
df <- iris[1:4]

pairs(df)

# Equivalent to:
pairs(~ Sepal.Length + Sepal.Width +
        Petal.Length + Petal.Width, data = df)

# Equivalent to:
with(df, pairs(~ Sepal.Length + Sepal.Width +
                 Petal.Length + Petal.Width))

# Equivalent to:
plot(df)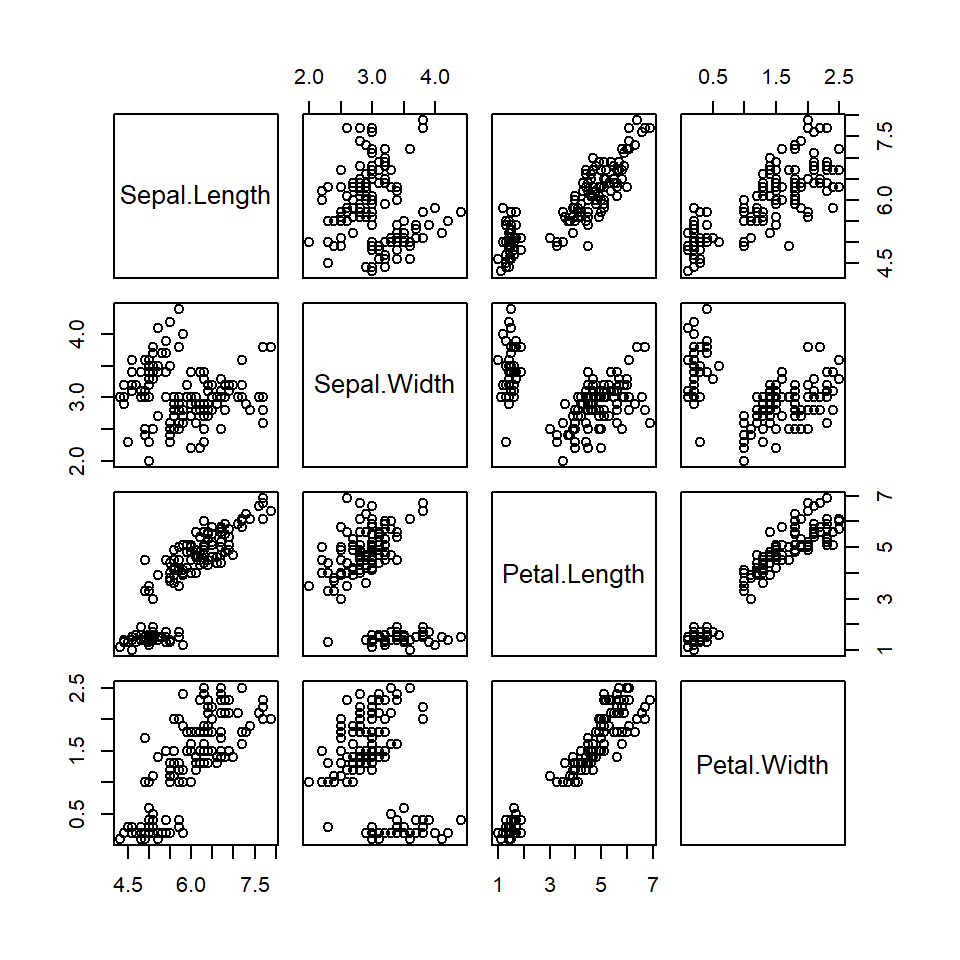
There are several arguments that can be used to customize the resulting output. The following block of code highlights and describes some of the most relevant arguments. Type ?pairs for the full list.
# Numeric variables
df <- iris[1:4]

pairs(df,       # Data
      pch = 19, # Pch symbol
      col = 4,  # Color
      main = "Title",    # Title
      gap = 0,           # Subplots distance
      row1attop = FALSE, # Diagonal direction
      labels = colnames(df), # Labels
      cex.labels = 0.8,  # Size of diagonal texts
      font.labels = 1)   # Font style of diagonal texts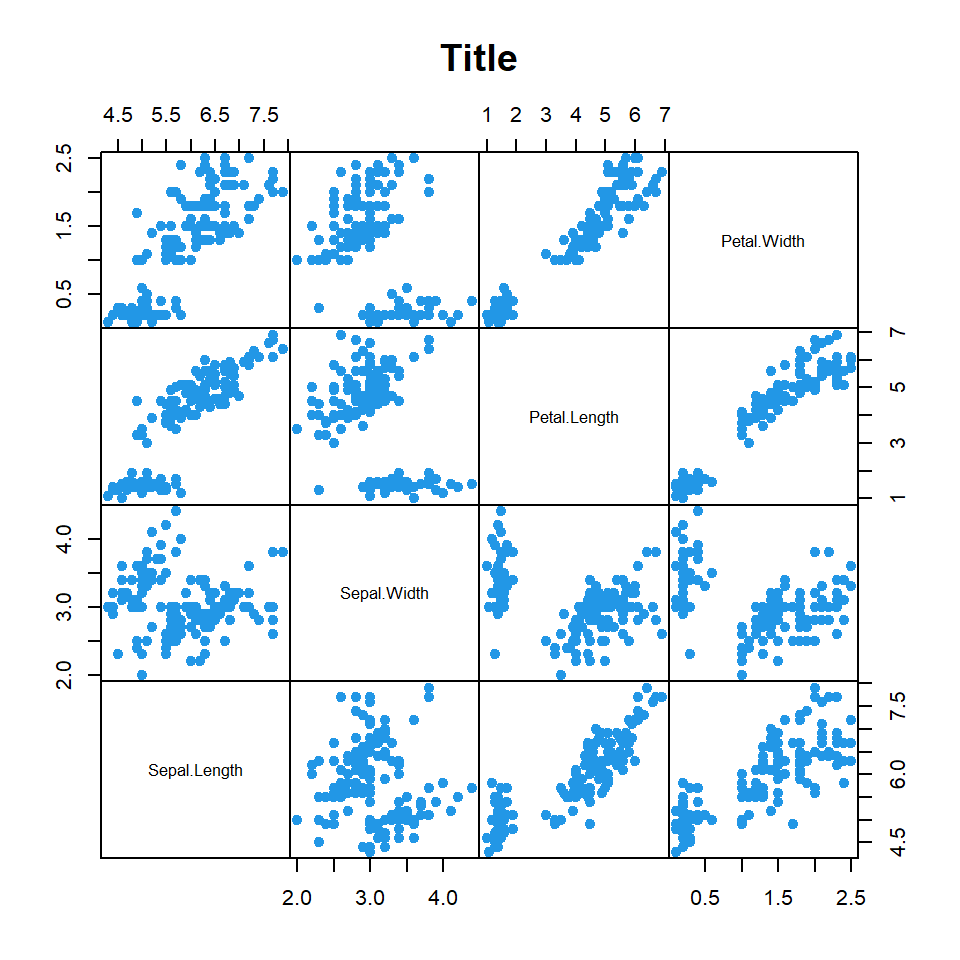
Color by group
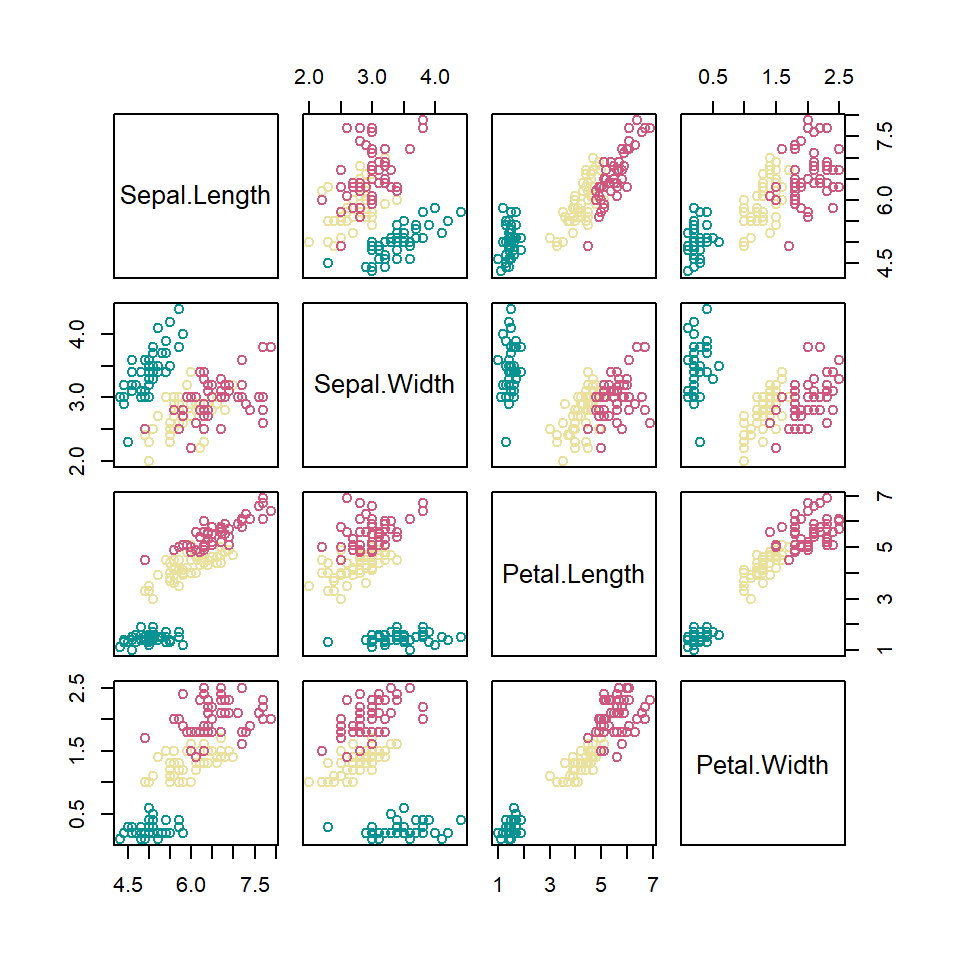
The color scheme can be customized so each group of your data set can be colorized on a different color. For that purpose you can index your grouping variable to a color palette. Check the list of color palettes or create your own.
# Numeric variables
df <- iris[1:4]

# Groups
species <- iris[, 5]

# Number of groups
l <- length(unique(species))

pairs(df, col = hcl.colors(l, "Temps")[species])
Note that some pch symbols allow you to set a background and a border color as in the following example.
# Numeric variables
df <- iris[1:4]

# Groups
species <- iris[, 5]

# Number of groups
l <- length(unique(species))

pairs(df,
      pch = 22,
      bg = hcl.colors(l, "Temps")[species],
      col = hcl.colors(l, "Temps")[species])
Master Statistics
Learn statistics from the basics to advanced techniques, clearly explained
Go to site