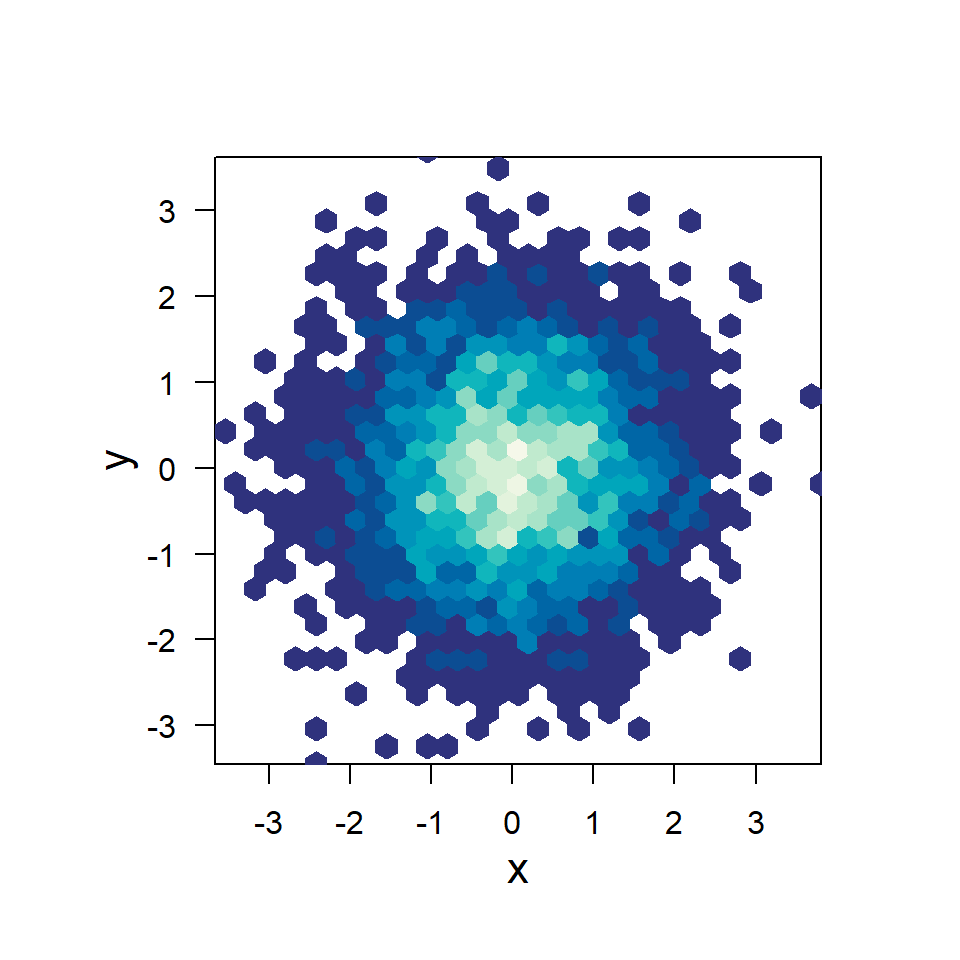
The geom_hex function
Given a numerical data frame you can create a hexbin chart in ggplot2 making use of geom_hex.
# install.packages("ggplot2")
library(ggplot2)

# Data
set.seed(1)
df <- data.frame(x = rnorm(2000), y = rnorm(2000))

ggplot(df, aes(x = x, y = y)) +
  geom_hex()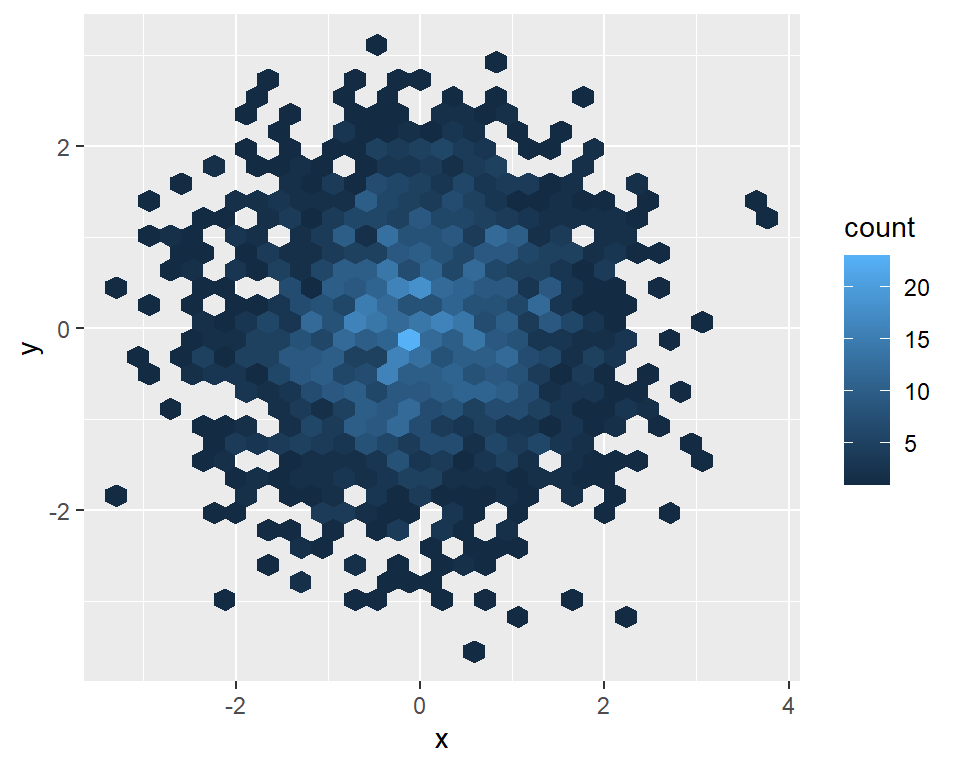
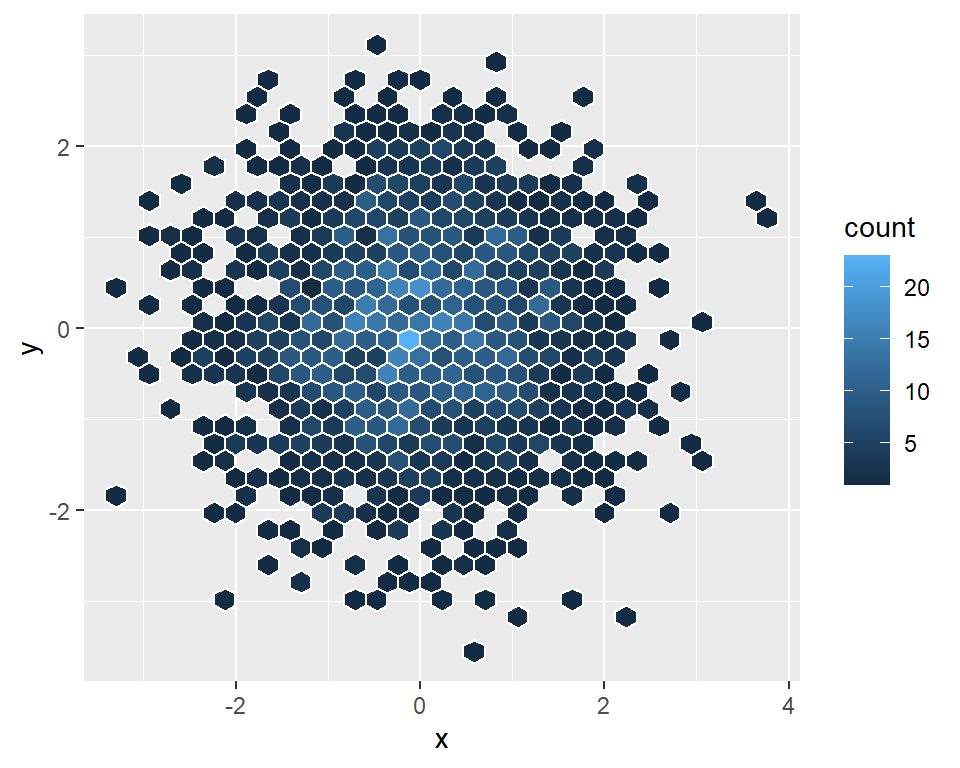
Few bins
You can control de number of bins in both vertical and horizontal directions. Default value is 30.
# install.packages("ggplot2")
library(ggplot2)

# Data
set.seed(1)
df <- data.frame(x = rnorm(2000), y = rnorm(2000))

ggplot(df, aes(x = x, y = y)) +
  geom_hex(bins = 15)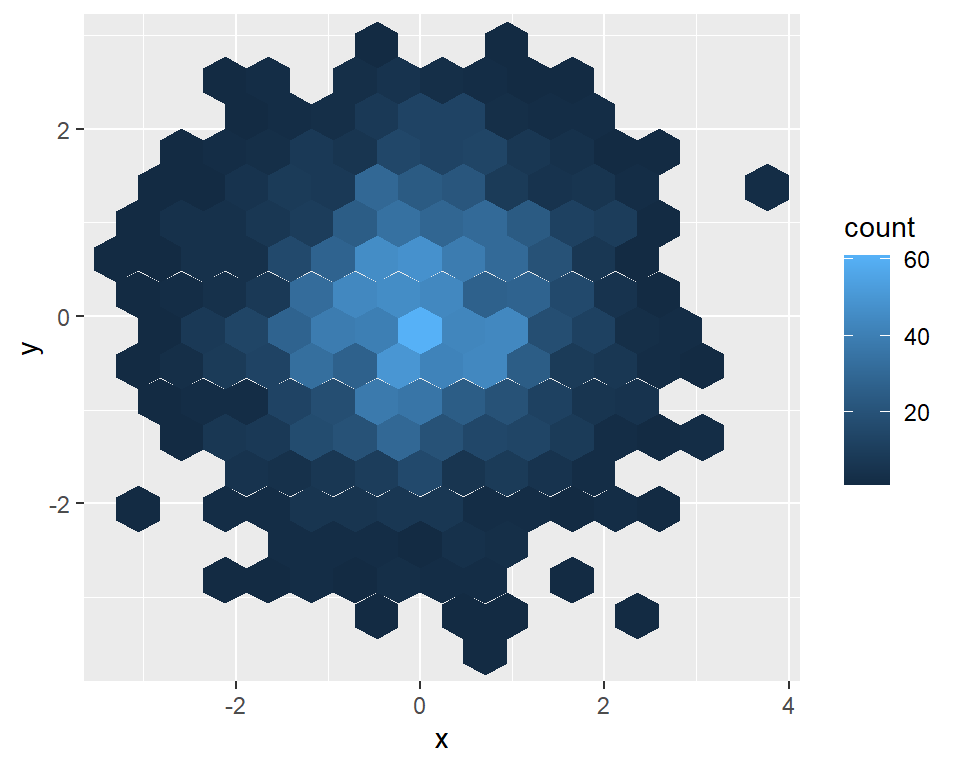
Too many bins
Note that if you set too many bins the hexbin chart will look like a classical scatter plot.
# install.packages("ggplot2")
library(ggplot2)

# Data
set.seed(1)
df <- data.frame(x = rnorm(2000), y = rnorm(2000))

ggplot(df, aes(x = x, y = y)) +
  geom_hex(bins = 60)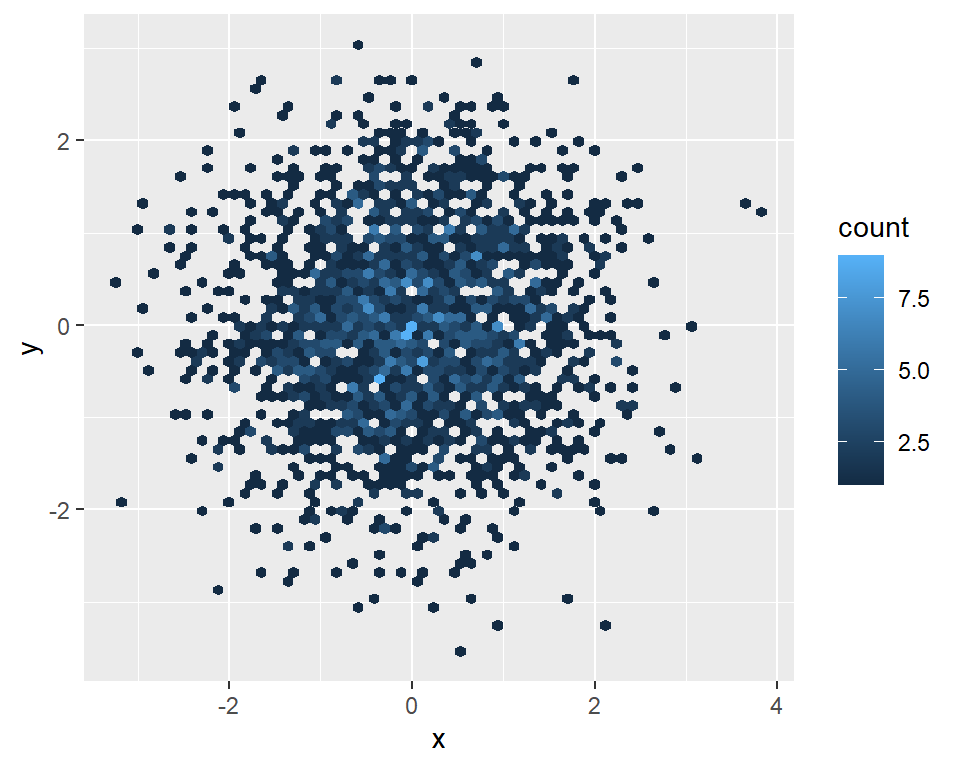
Color customization
Border color
The border for all hexagons can be customized with the color argument of the geom_hex function.
# install.packages("ggplot2")
library(ggplot2)

# Data
set.seed(1)
df <- data.frame(x = rnorm(2000), y = rnorm(2000))

ggplot(df, aes(x = x, y = y)) +
  geom_hex(color = "white")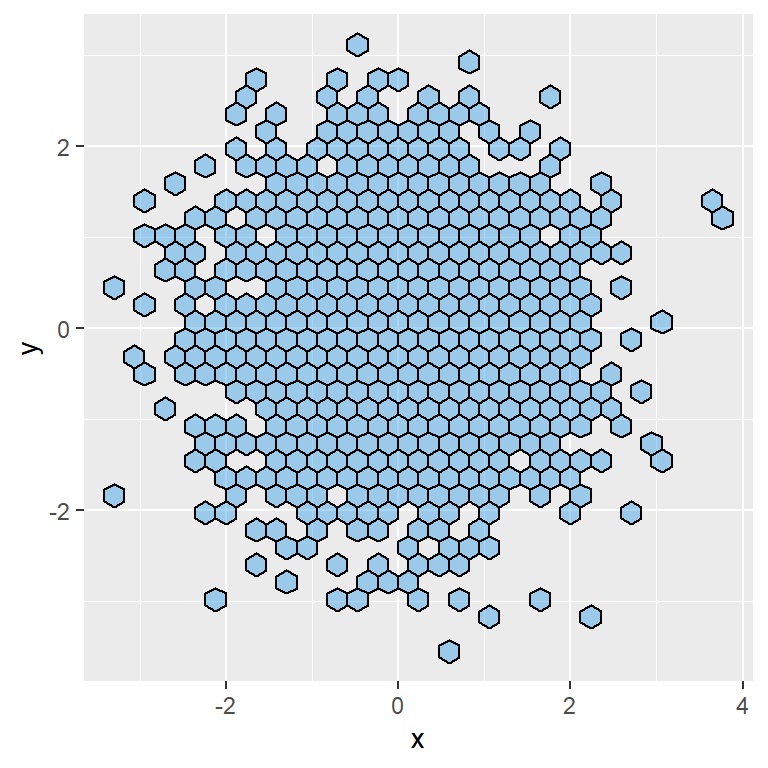
Fill and transparency
You can also set a fill color for all the hexagons with fill and control the transparency of the colors with alpha.
# install.packages("ggplot2")
library(ggplot2)

# Data
set.seed(1)
df <- data.frame(x = rnorm(2000), y = rnorm(2000))

ggplot(df, aes(x = x, y = y)) +
geom_hex(color = 1, fill = 4, alpha = 0.4) 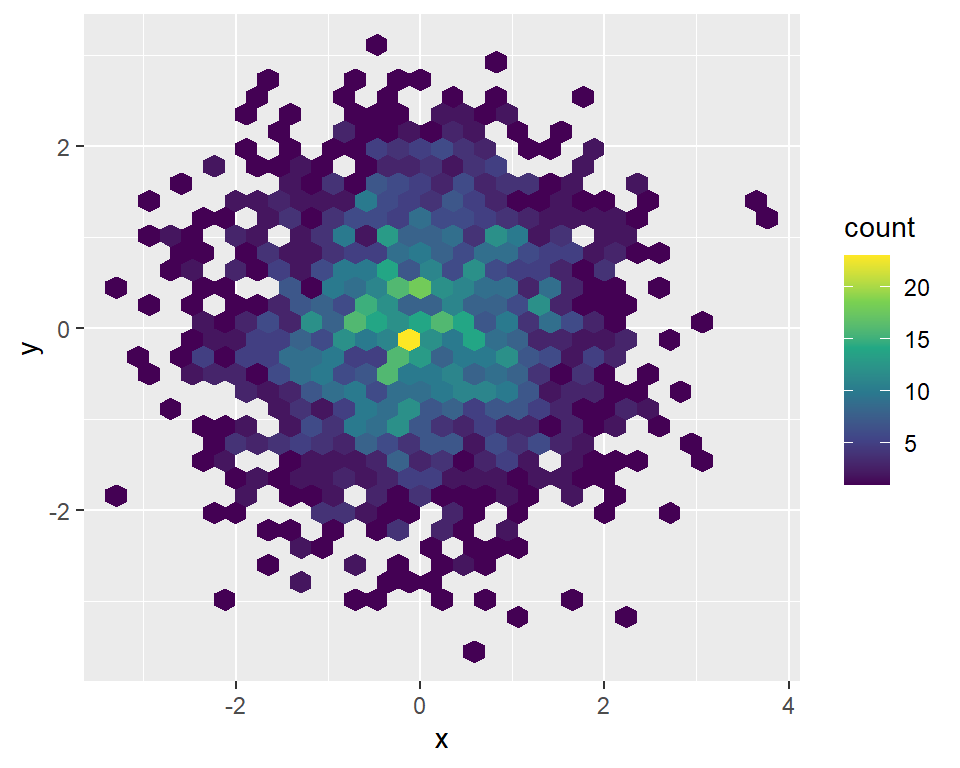
Color palette
If you want to keep the gradient color palette representing values you can change the default colors with scale_fill_viridis_c, scale_fill_gradient or a similar function.
# install.packages("ggplot2")
library(ggplot2)

# Data
set.seed(1)
df <- data.frame(x = rnorm(2000), y = rnorm(2000))

ggplot(df, aes(x = x, y = y)) +
  geom_hex() +
  scale_fill_viridis_c()
Legend customization
Width and height
When creating a hexbin chart a colour bar will be added to the chart by default. You can control the width and height of this bar with barwidth and barheight, as shown below.
# install.packages("ggplot2")
library(ggplot2)

# Data
set.seed(1)
df <- data.frame(x = rnorm(2000), y = rnorm(2000))

ggplot(df, aes(x = x, y = y)) +
  geom_hex() +
  guides(fill = guide_colourbar(barwidth = 0.7,
                                barheight = 15))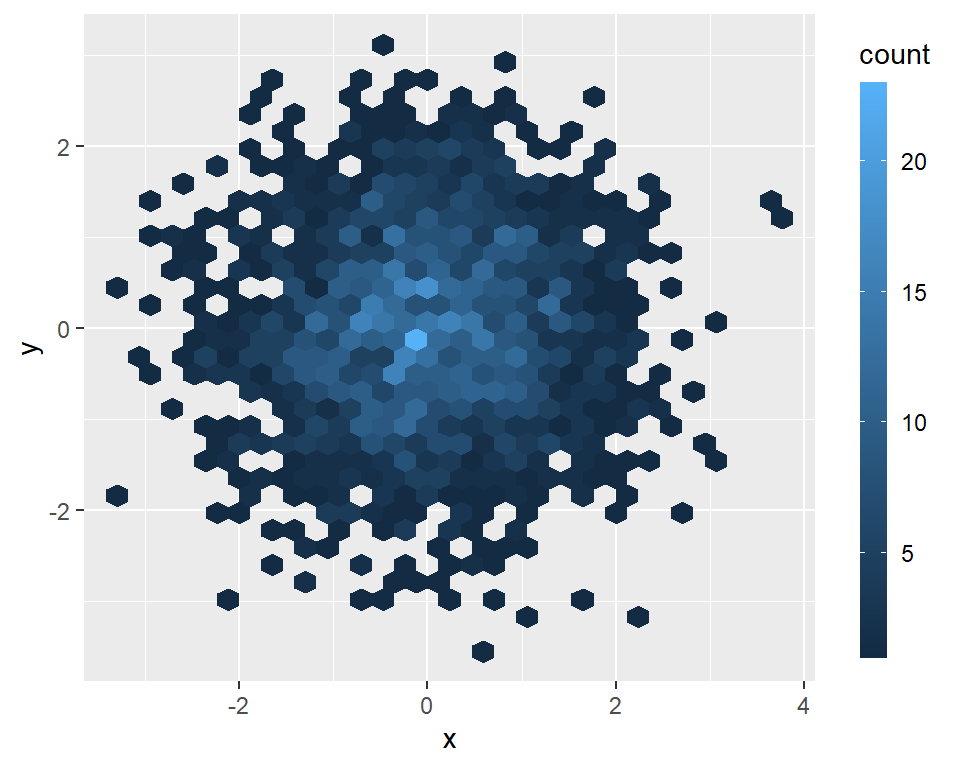
Change the title
The default title of the legend is “count”. You can change it with the title argument of the guide_colourbar function as follows.
# install.packages("ggplot2")
library(ggplot2)

# Data
set.seed(1)
df <- data.frame(x = rnorm(2000), y = rnorm(2000))

ggplot(df, aes(x = x, y = y)) +
  geom_hex() +
  guides(fill = guide_colourbar(title = "Count"))
Remove the labels and the ticks
Note that you can remove the ticks and/or the labels of the bar setting the label and ticks arguments to FALSE.
# install.packages("ggplot2")
library(ggplot2)

# Data
set.seed(1)
df <- data.frame(x = rnorm(2000), y = rnorm(2000))

ggplot(df, aes(x = x, y = y)) +
  geom_hex() +
  guides(fill = guide_colourbar(label = FALSE,
                                ticks = FALSE))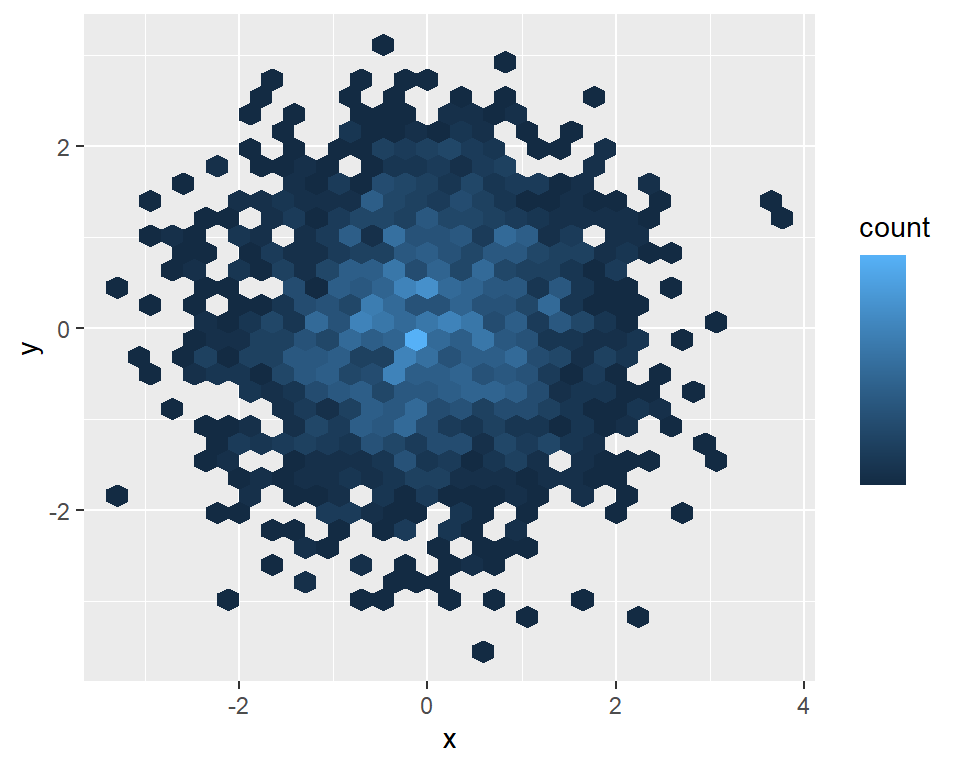
Remove the legend
Finally, if you want to remove the legend you can set its position to "none".
# install.packages("ggplot2")
library(ggplot2)

# Data
set.seed(1)
df <- data.frame(x = rnorm(2000), y = rnorm(2000))

ggplot(df, aes(x = x, y = y)) +
  geom_hex() +
  theme(legend.position = "none")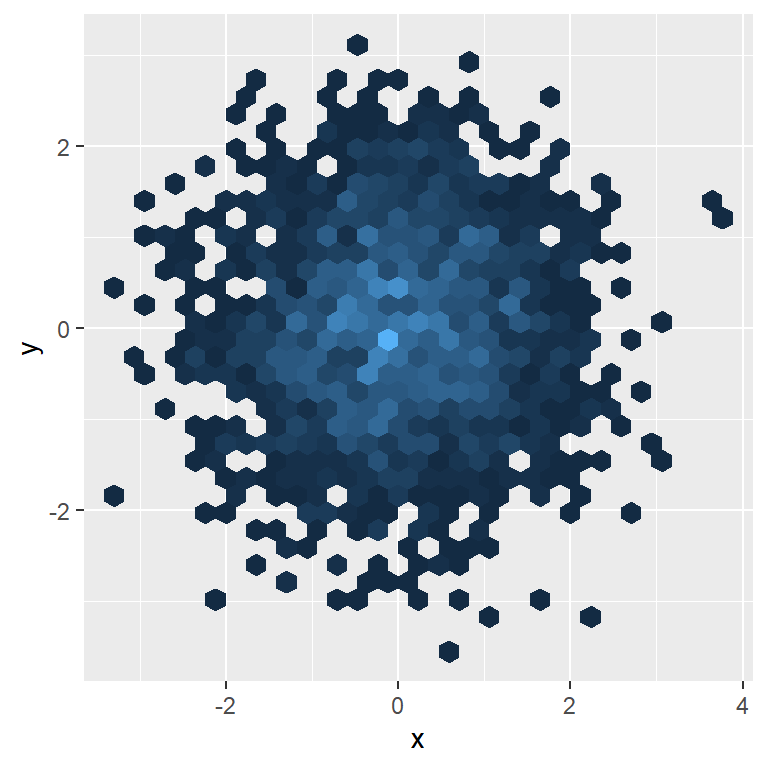

Master Statistics
Learn statistics from the basics to advanced techniques, clearly explained
Go to site