Scatter plot in ggplot2 with geom_point
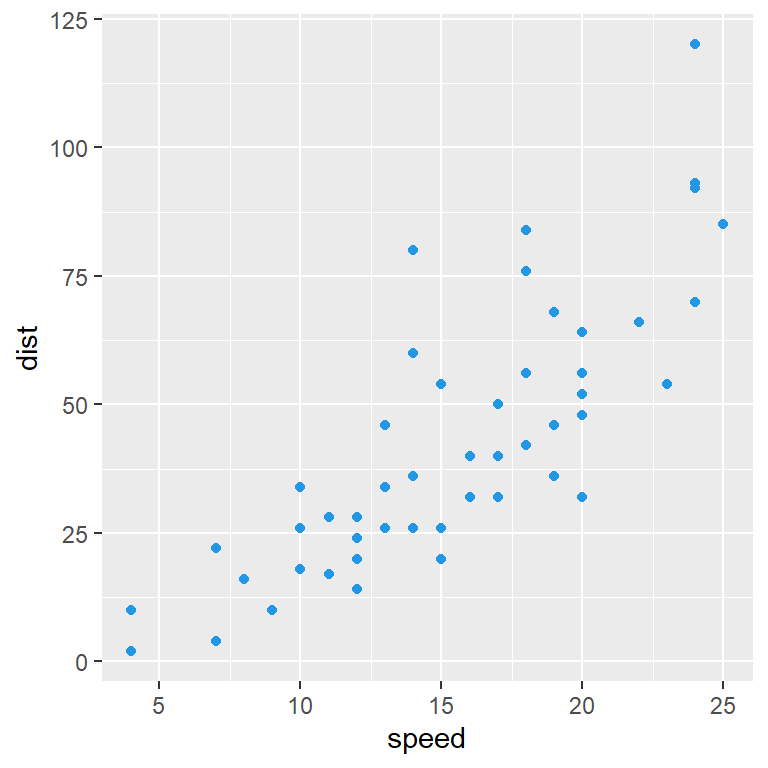
The geom_point function can be used to create a basic scatter plot in ggplot2. Considering the cars data set you can create the following visualization.
# install.packages("ggplot2")
library(ggplot2)

# Basic scatter plot
ggplot(cars, aes(x = speed, y = dist)) +
  geom_point()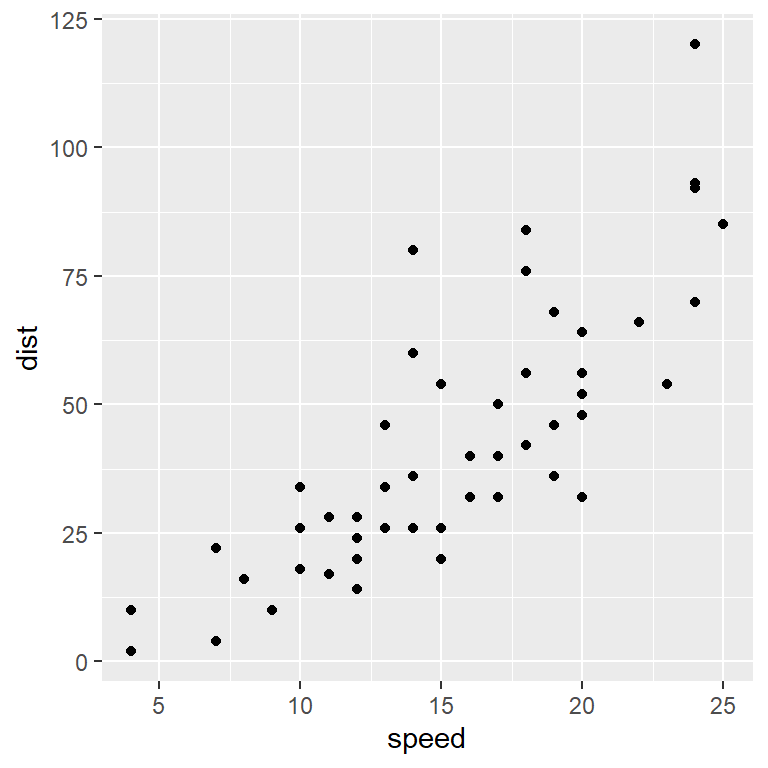
Color customization
Color
The colour argument of the geom_point function allows customizing the color or the points.
# install.packages("ggplot2")
library(ggplot2)

ggplot(cars, aes(x = speed, y = dist)) +
  geom_point(colour = 4)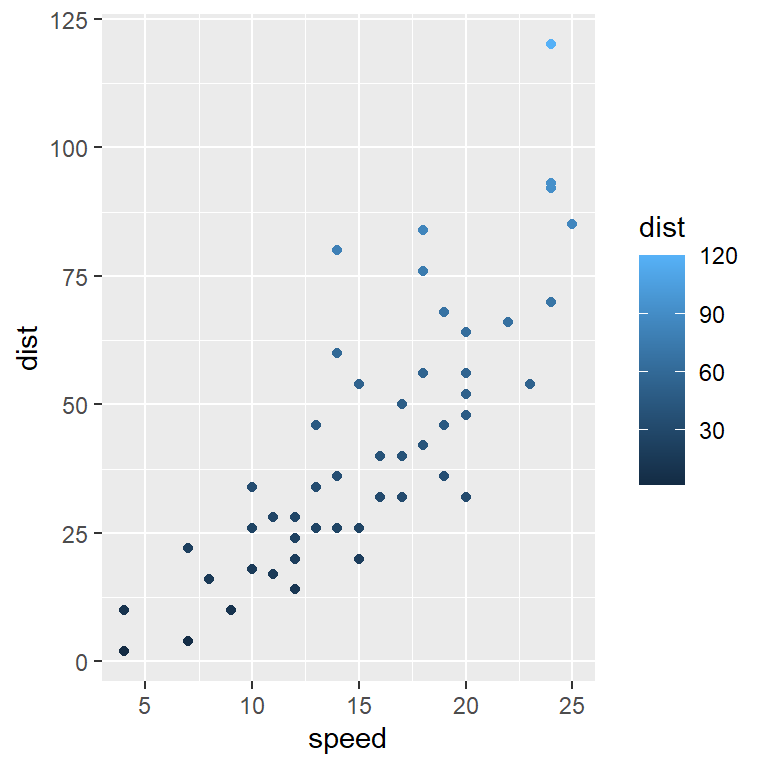
Gradient color
If you want to colorize the points based on a value you can pass the variable to the color (colour) argument of aes.
# install.packages("ggplot2")
library(ggplot2)

ggplot(cars, aes(x = speed, y = dist, color = dist)) +
  geom_point()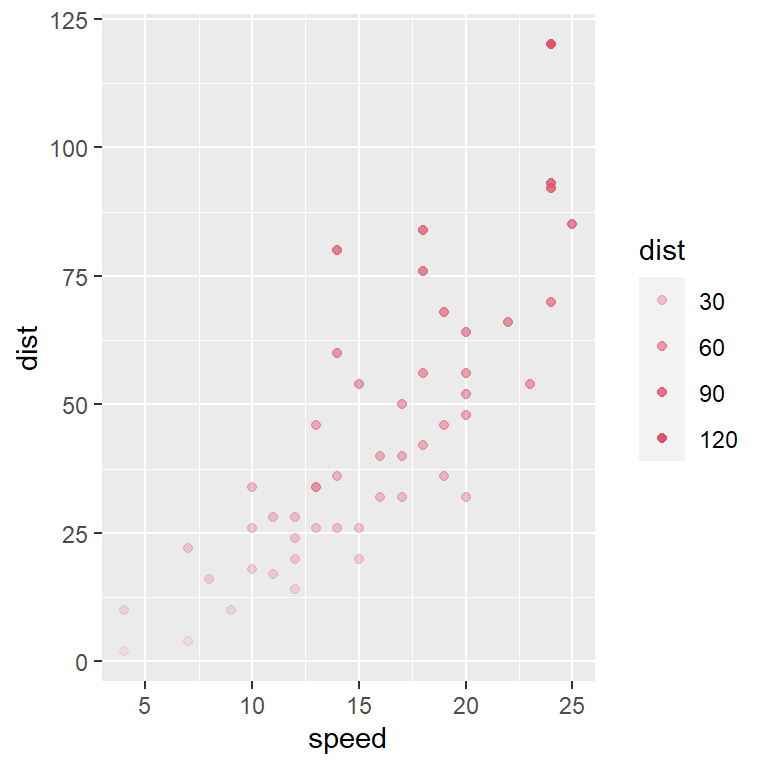
Transparency
The transparency of the points can also be customized with alpha argument. You can pass a value or a variable, so the transparency will be based on that variable, as in the example below.
# install.packages("ggplot2")
library(ggplot2)

ggplot(cars, aes(x = speed, y = dist, alpha = dist)) +
  geom_point(colour = 2)
Setting show.legend = FALSE inside geom_point will remove the legends created automatically when you specify the colour or alpha aesthetics or both.
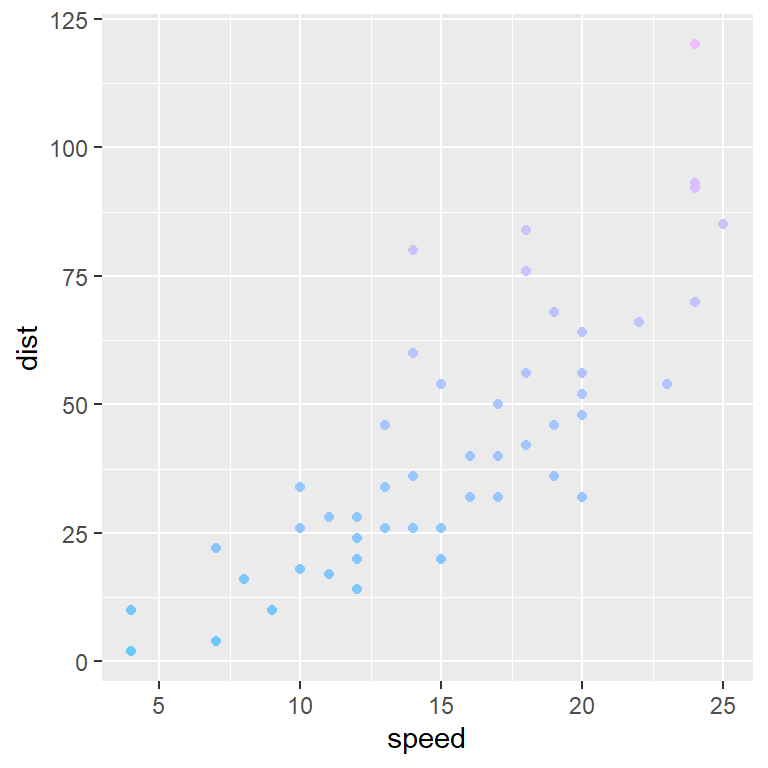
Color scale
If you pass a variable to the colour argument of the aes you can customize the color scale with scale_color_gradient (or a similar function), setting the lower and the higher color value.
# install.packages("ggplot2")
library(ggplot2)

ggplot(cars, aes(x = speed, y = dist,
                 colour = dist)) +
  geom_point(show.legend = FALSE) +
  scale_color_gradient(low = "#67c9ff", high = "#f2bbfc")
Color based on values
The geom_point function allows coloring the points based on some conditions. Note that you can customize the color of the points with scale_color_manual.
# install.packages("ggplot2")
library(ggplot2)

ggplot(cars, aes(x = speed, y = dist)) +
  geom_point(aes(colour = dist > 25 & dist < 50),
             show.legend = FALSE) +
  geom_hline(yintercept = 25, linetype = "dashed") +
  geom_hline(yintercept = 50, linetype = "dashed")
Shape and size
Shape and size of the points
The shape and the size of the points can be changed with size and shape arguments, respectively.
# install.packages("ggplot2")
library(ggplot2)

ggplot(cars, aes(x = speed, y = dist)) +
  geom_point(size = 3, shape = 17)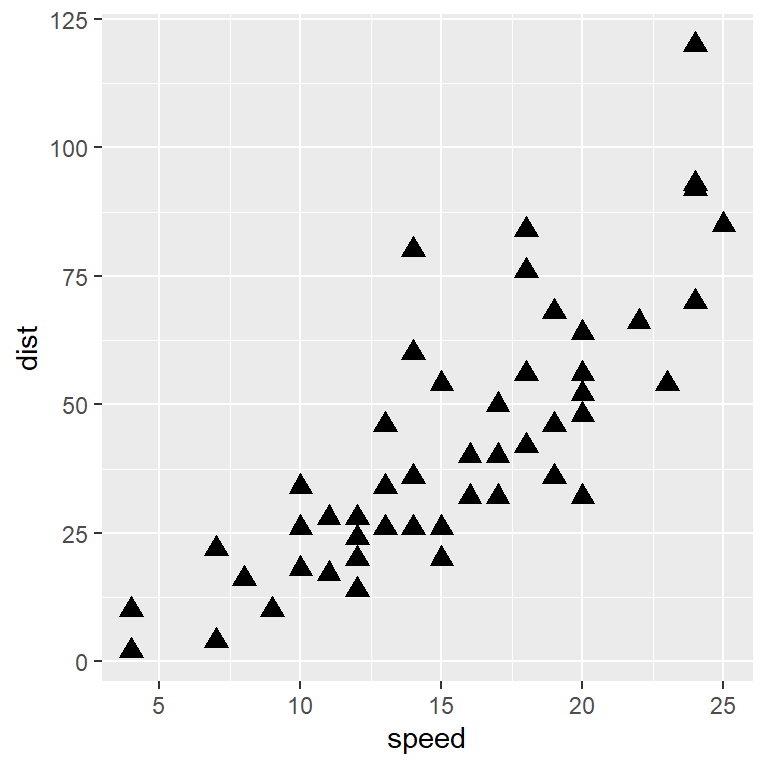

Master Statistics
Learn statistics from the basics to advanced techniques, clearly explained
Go to site