Sample data
The data below contains two numerical variables and a categorical variable representing groups. This data frame be used in the following examples.
set.seed(1)

# Data simulation
x <- runif(500)
y <- 5 * x ^ 2 + rnorm(length(x), sd = 2)
group <- ifelse(x < 0.4, "A",
                ifelse(x > 0.8, "C", "B"))
x <- x + runif(length(x), -0.2, 0.2)

# Data frame
df <- data.frame(x = x, y = y, group = group)
Scatter plot by group with geom_point
Creating a scatter plot by group in ggplot2 is straightforward, as you only need to pass the categorical variable to the color argument of aes.
# install.packages("ggplot2")
library(ggplot2)

# Scatter plot by group
ggplot(df, aes(x = x, y = y, color = group)) +
  geom_point()
Changing the colors
The default color palette can be customized in several ways. You can use scale_color_manual and pass a vector of colors to the values argument or choose a predefined discrete palette, such as scale_color_viridis_d.
# install.packages("ggplot2")
library(ggplot2)

# Vector of colors
cols <- c("#1170AA", "#55AD89", "#EF6F6A")

ggplot(df, aes(x = x, y = y, color = group)) +
  geom_point() +
  scale_color_manual(values = cols)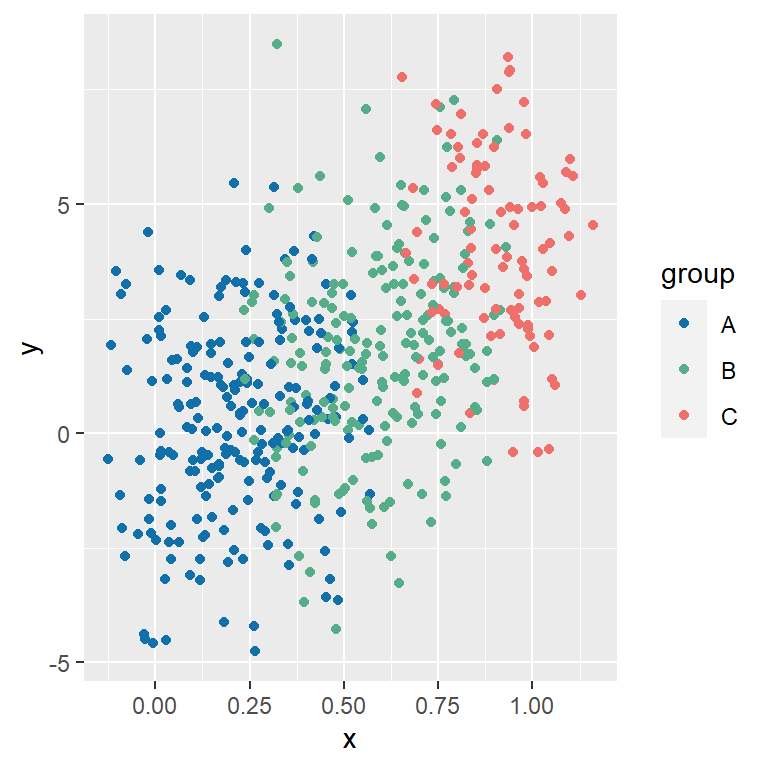
Changing the shape and the size
The default shape of the observations are filled circles, but you can choose any symbol with shape. The size of the symbols can also be customized, making use of size.
# install.packages("ggplot2")
library(ggplot2)

ggplot(df, aes(x = x, y = y, color = group)) +
  geom_point(shape = 17, size = 2)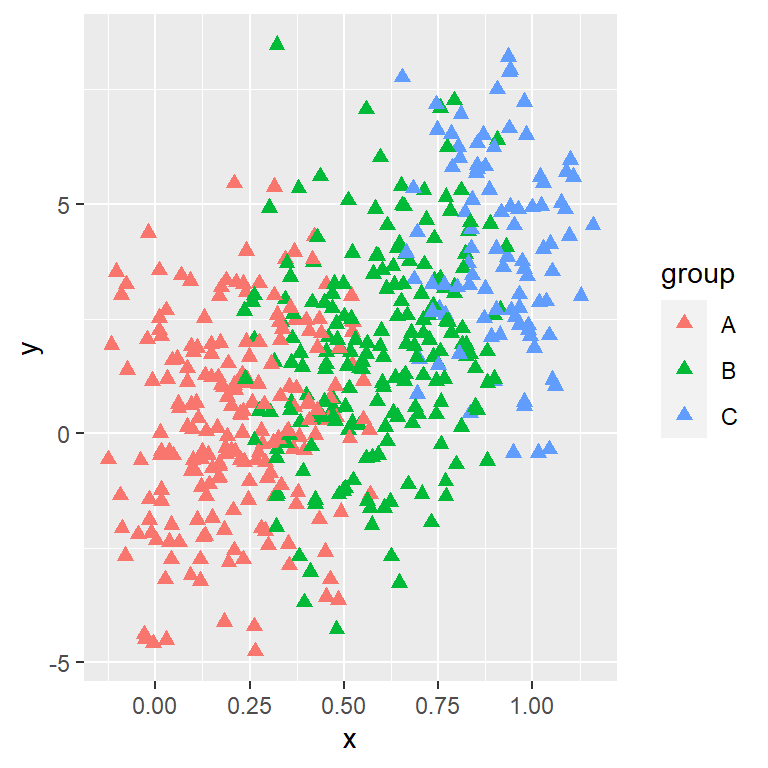
Shape by group
If you want you can add a different shape by group, pass the grouping variable to the shape argument of the aes function. Note that you can specify this argument without setting color.
# install.packages("ggplot2")
library(ggplot2)

ggplot(df, aes(x = x, y = y, color = group,
               shape = group)) +
  geom_point(size = 2)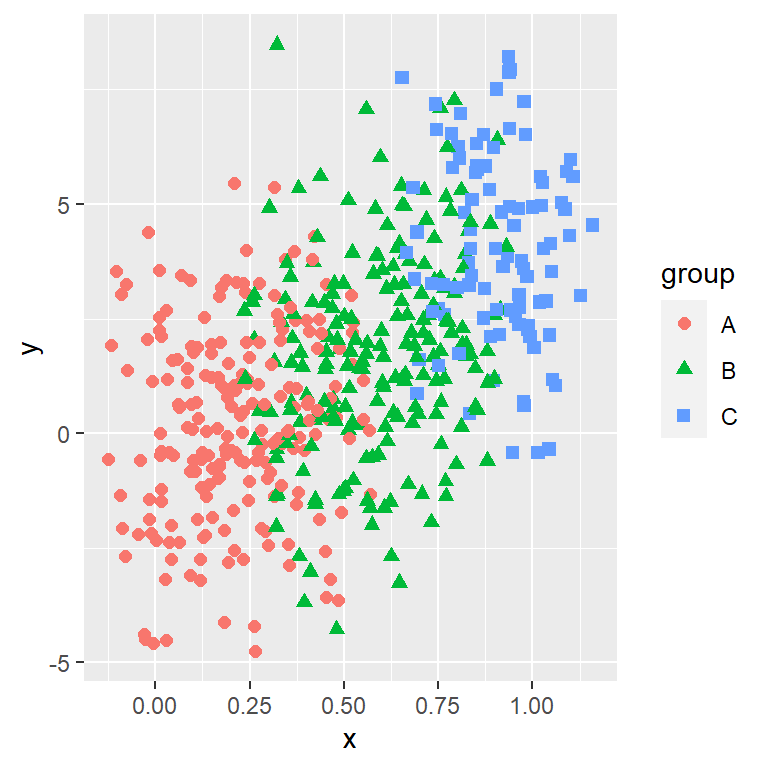
Legend customization

Legend title
When you create a scatter plot by group in ggplot2 an automatic legend is created based con the categorical variable. The default title of the legend is the name of the variable, but you can override this with the following code.
# install.packages("ggplot2")
library(ggplot2)

ggplot(df, aes(x = x, y = y, color = group)) +
  geom_point(size = 2) +
  guides(colour = guide_legend(title = "Title"))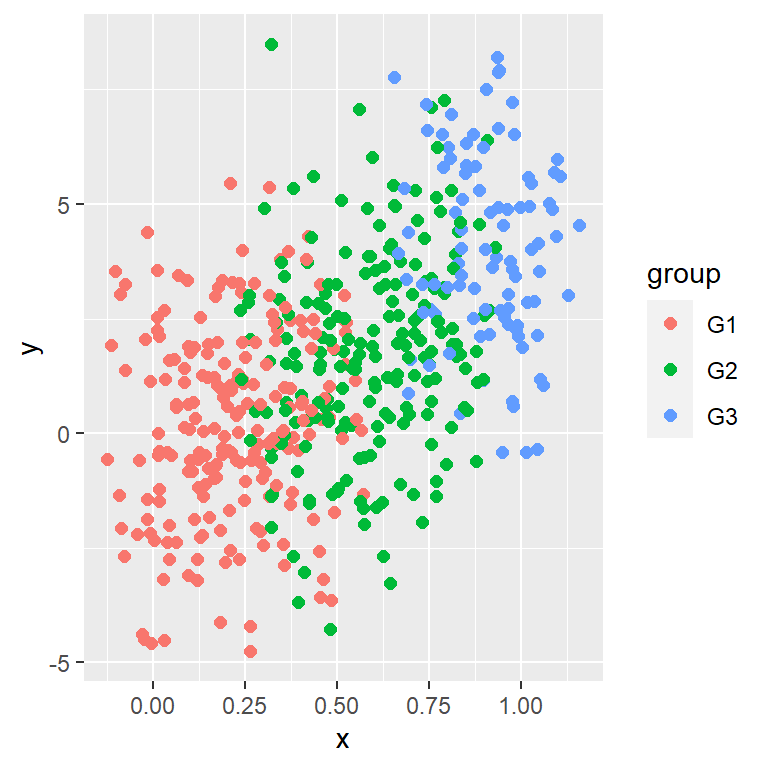
Custom key labels
The labels can also be customized. You can make use of the labels argument of the scale_color_discrete function to change them.
# install.packages("ggplot2")
library(ggplot2)

ggplot(df, aes(x = x, y = y, color = group)) +
  geom_point(size = 2) +
  scale_color_discrete(labels = c("G1", "G2", "G3"))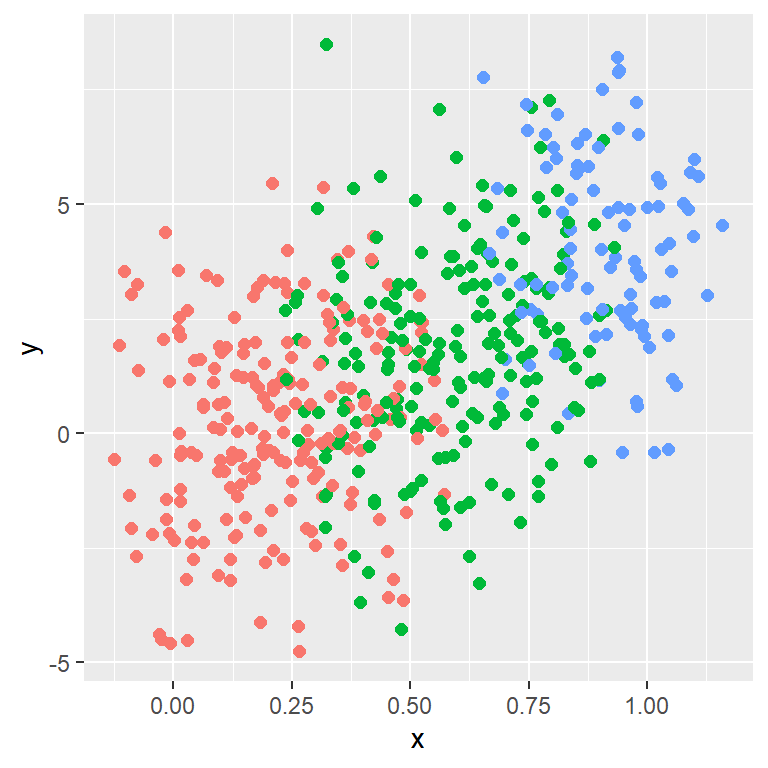
Remove the legend
In case you want to get rid of the legend set legend.position = "none" inside the theme function.
# install.packages("ggplot2")
library(ggplot2)

ggplot(df, aes(x = x, y = y, color = group)) +
  geom_point(size = 2) +
  theme(legend.position = "none")
Master Statistics
Learn statistics from the basics to advanced techniques, clearly explained
Go to site