scatterplot function
The car package contains a function named scatterplot which creates scatter plots in base R with marginal box plots. Note that by default the function also adds smoothed and linear regression lines, which we omitted.
Scatter plot with marginal box plots
# install.packages("car")
library(car)

# Data
set.seed(14022021)
x <- rnorm(300)
y <- 3 * x + rnorm(300)

scatterplot(x, y,            # Data
            pch = 19,        # Symbol of the points
            col = 1,         # Color of the points
            smooth = FALSE,  # Remove smooth estimate
            regLine = FALSE) # Remove linear estimate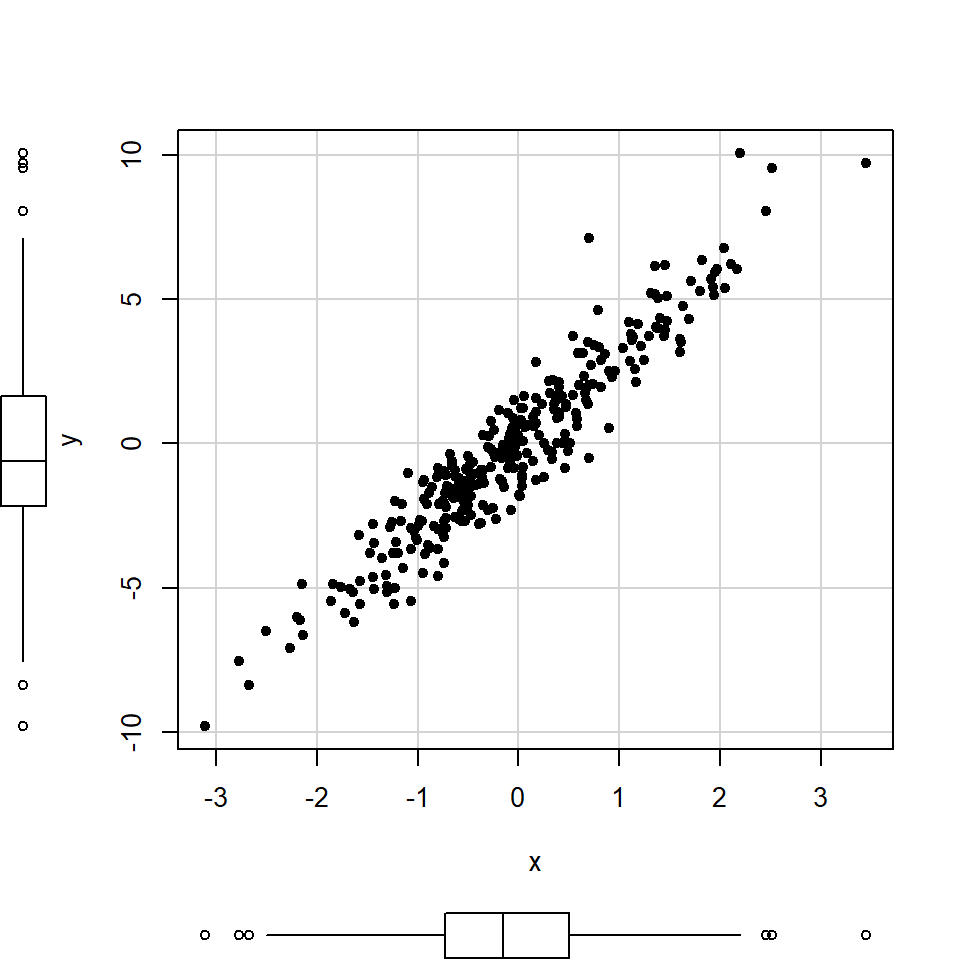
The boxplots argument of the function defaults to "xy". However, if you set boxplots = "x" only the box plot for the X-axis will be displayed.
# install.packages("car")
library(car)

# Data
set.seed(14022021)
x <- rnorm(300)
y <- 3 * x + rnorm(300)

scatterplot(x, y,            # Data
            boxplots = "x",  # Box plot on the X-axis
            pch = 19,        # Symbol of the points
            col = 1,         # Color of the points
            smooth = FALSE,  # Remove smooth estimate
            regLine = FALSE) # Remove linear estimate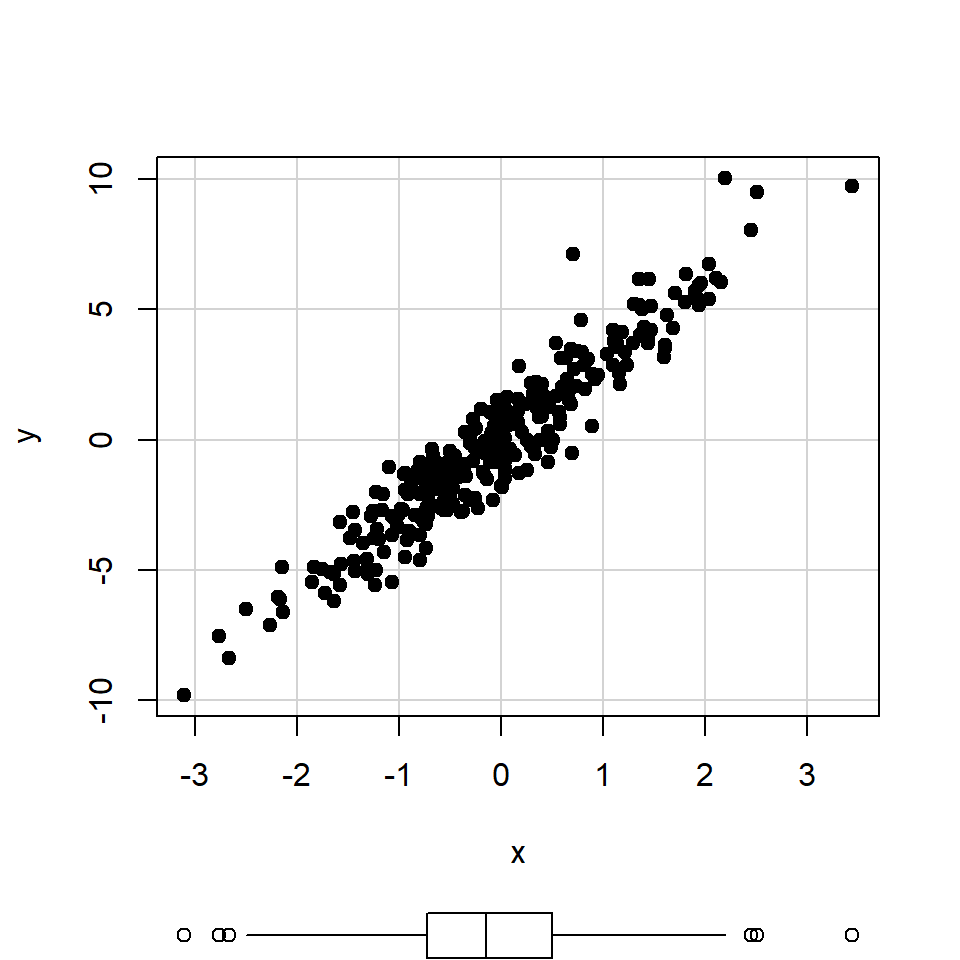
Equivalently, if you set boxplots = "y" only the Y-axis box plot will be drawn.
# install.packages("car")
library(car)

# Data
set.seed(14022021)
x <- rnorm(300)
y <- 3 * x + rnorm(300)

scatterplot(x, y,            # Data
            boxplots = "y",  # Box plot on the Y-axis
            pch = 19,        # Symbol of the points
            col = 1,         # Color of the points
            smooth = FALSE,  # Remove smooth estimate
            regLine = FALSE) # Remove linear estimate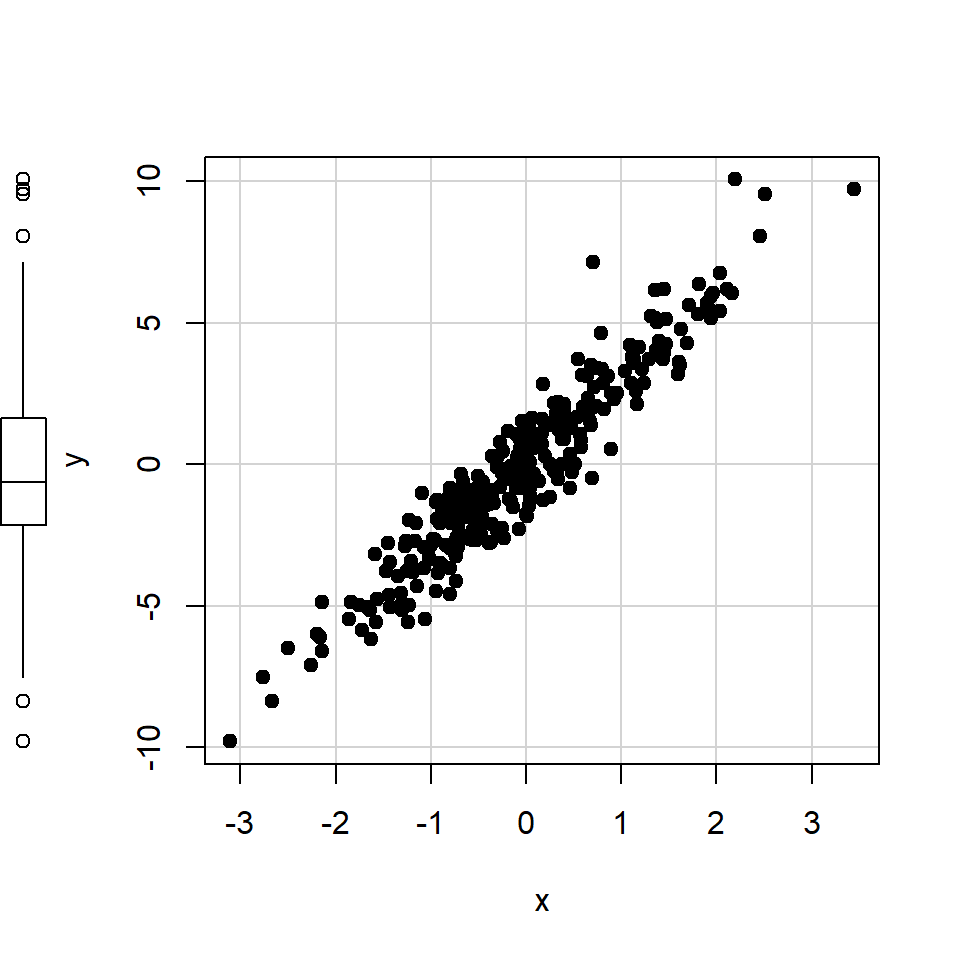
Using the layout function
The function of the last section is very useful for adding marginal box plots quickly. However, it doesn’t allow further customization of the box plots or change the position of the box plots.
The layout function can be used to add marginal charts, allowing you to customize each plot and placing it where you want. If you are not familiar with this function check the tutorial about combining plots.

# Data
set.seed(14022021)
x <- rnorm(300)
y <- 3 * x + rnorm(300)

# Layout
layout(matrix(c(2, 0, 1, 3),
              nrow = 2, ncol = 2,
              byrow = TRUE),
       widths = c(3, 1),
       heights  = c(1, 3), respect = TRUE)

# Top and right margin of the main plot
par(mar = c(5.1, 4.1, 0, 0))
plot(x, y, pch = 19, col = 1, cex = 0.8)

# Left margin of the top box plot
par(mar = c(0, 4.1, 0, 0), bty = "n")
boxplot(y, axes = FALSE, horizontal = TRUE,
        col = "white")

# Bottom margin of the right box plot
par(mar = c(5.1, 0, 0, 0), bty = "n")
boxplot(x, axes = FALSE, col = "white")
Master Statistics
Learn statistics from the basics to advanced techniques, clearly explained
Go to site