A bubble chart is a type of scatter plot where the points are scaled based on a variable.
Sample data
In order to create a bubble plot in ggplot2 you will need a data frame containing the coordinates of the points (x and y) and a variable to map the sizes of the bubbles (size). In addition, you can have a variable representing groups or labels.
# Sample data
x <- c(2, 5, 7, 3, 6, 1, 9, 2)
y <- c(2.2, 2, 1, 2, 1, 4, 1, 6)
size <- c(100, 30, 50, 250, 120, 140, 80, 36)
group <- c("A", "A", "A", "B", "C", "B", "D", "B")

# Data frame
df <- data.frame(x = x, y = y, size = size, group = group)
Bubble plots in ggplot2 with geom_point and scale_size or scale_size_area
In order to create a basic bubble chart in ggplot2 you will need to pass the coordinates and the variable that represents sizes to the aes function and then use the geom_point function.
# install.packages("ggplot2")
library(ggplot2)

ggplot(df, aes(x = x, y = y, size = size)) +
  geom_point()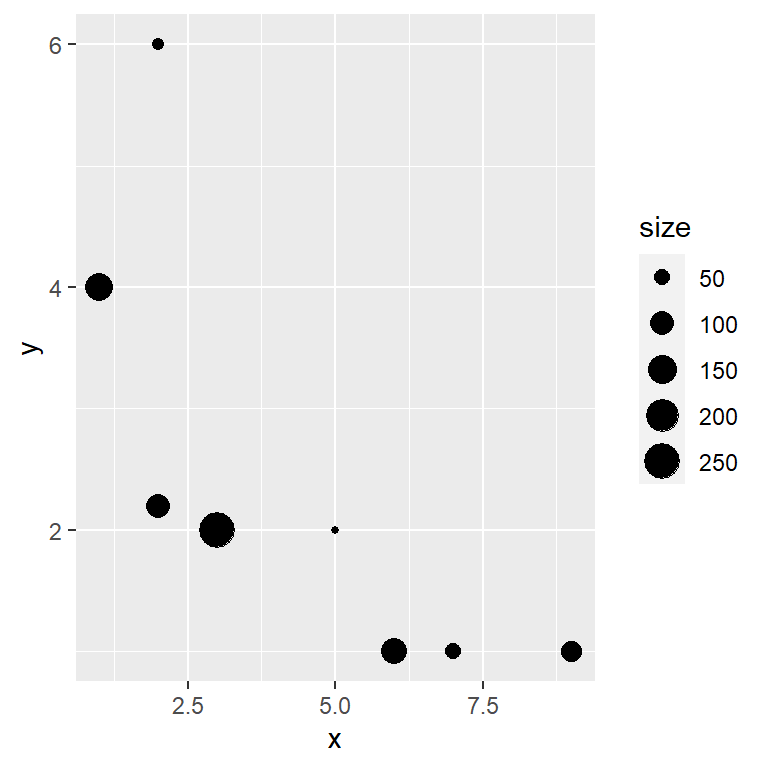
Resizing the bubbles
However, the previous plot can be improved making use of the scale_size function, as the default bubbles are small. This function scales the size of the bubbles to a specific range of sizes. Note that you can provide a name that will be shown in the legend of the chart.
# install.packages("ggplot2")
library(ggplot2)

ggplot(df, aes(x = x, y = y, size = size)) +
  geom_point() +
  scale_size(name = "Size", range = c(3, 15))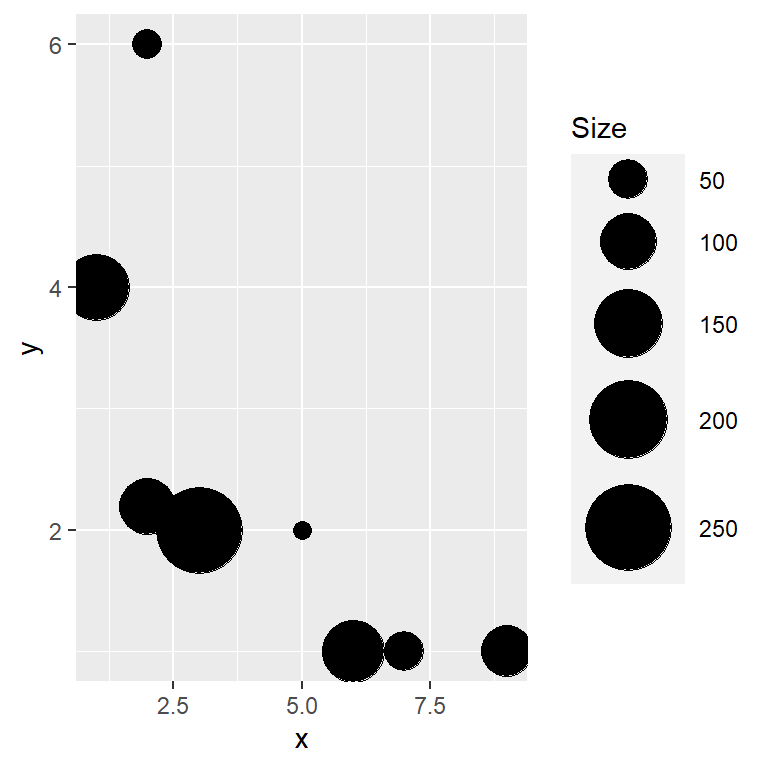
scale_size_area
An alternative function to create bubble graphs is scale_size_area that ensures that a value of zero is mapped to a size of 0 and instead of a range a maximum size must be specified with max_size. This is more useful when the size represents a count of observations.
# install.packages("ggplot2")
library(ggplot2)

ggplot(df, aes(x = x, y = y, size = size)) +
  geom_point() +
  scale_size_area(max_size = 10)
Labelling each bubble
With the geom_text or geom_label functions you can add texts to the bubbles. Recall that the functions provide the nudge_x and nudge_y arguments to customize the position of the texts or labels.
# install.packages("ggplot2")
library(ggplot2)

ggplot(df, aes(x = x, y = y, size = size)) +
  geom_point() +
  geom_text(label = group, nudge_x = 0.5, color = "red") +
  scale_size(name = "Size", range = c(3, 15))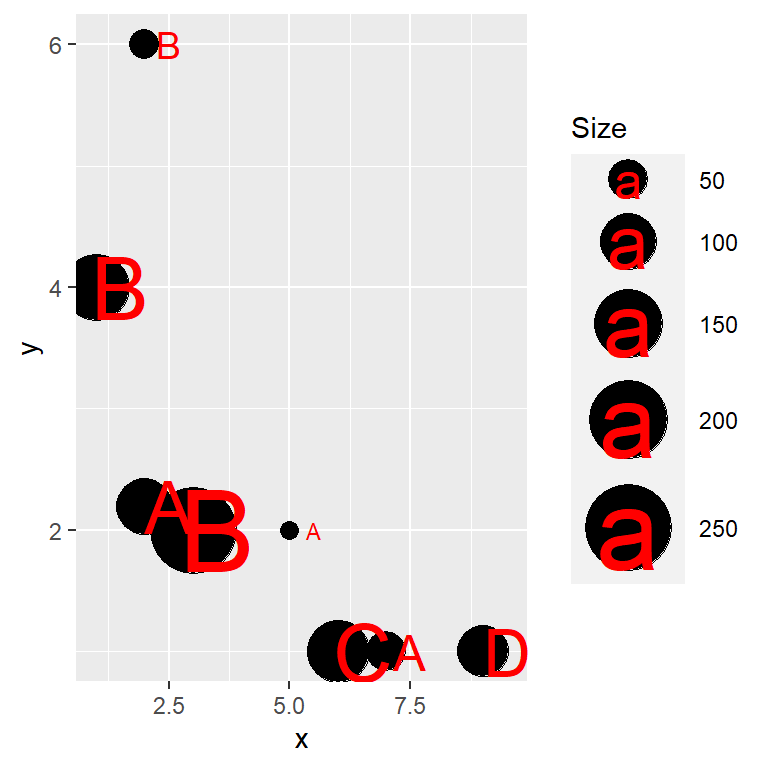
Turn off the legend or change its position
It is possible to remove the legend or change its position with the legend.position argument of the theme function.
# install.packages("ggplot2")
library(ggplot2)

ggplot(df, aes(x = x, y = y, size = size)) +
  geom_point() +
  scale_size(name = "Size", range = c(3, 15)) +
  theme(legend.position = "none")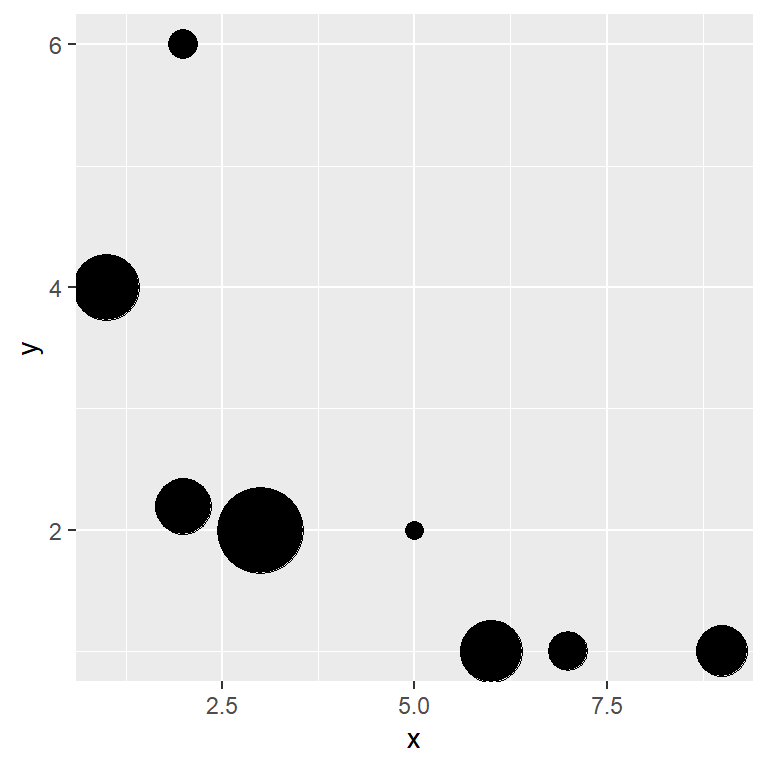
Bubble colors
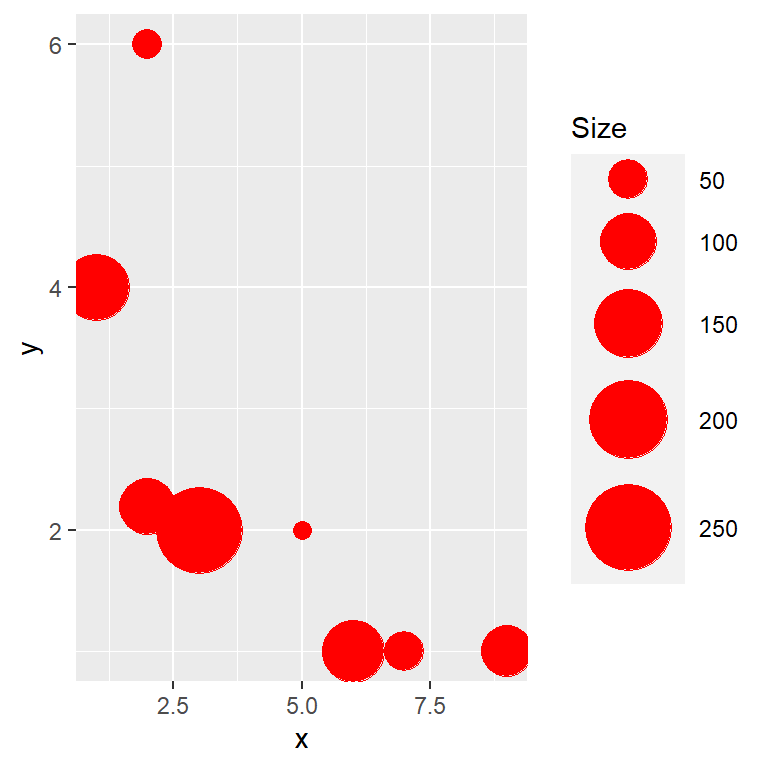
The default black color of the bubbles can be customized through the color argument of the geom_point function, specifying a new color.
# install.packages("ggplot2")
library(ggplot2)

ggplot(df, aes(x = x, y = y, size = size)) +
  geom_point(color = "red") +
  scale_size(name = "Size", range = c(3, 15))
Fill and border color of the bubbles
Note that there are some symbols that can handle both a fill color and a border color, such as the symbol 21.
# install.packages("ggplot2")
library(ggplot2)

ggplot(df, aes(x = x, y = y, size = size)) +
  geom_point(fill = "cornflowerblue", color = "black", shape = 21) +
  scale_size(name = "Size", range = c(3, 15))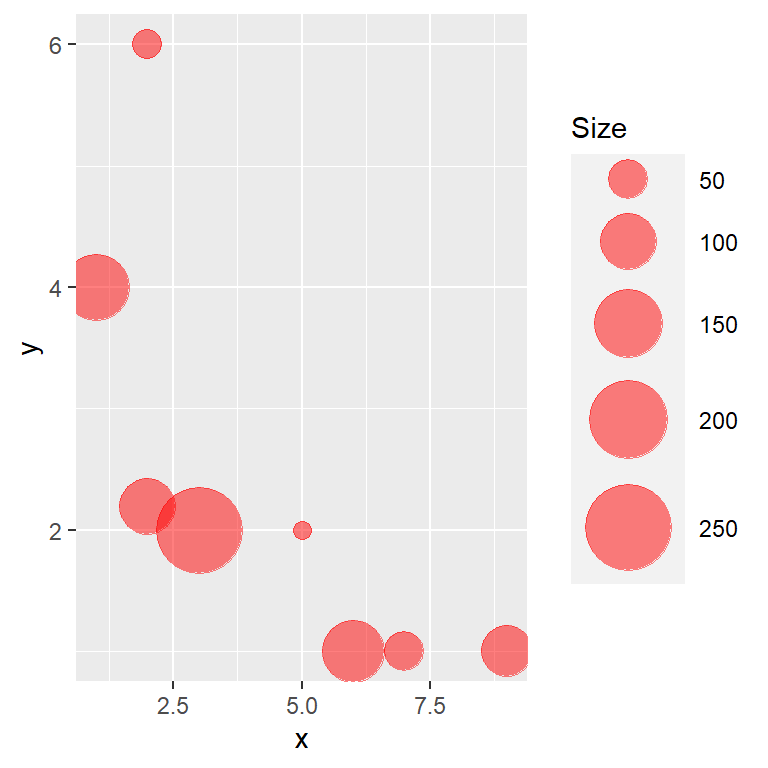
Color transparency
You can also control the level of transparency of the colors with alpha, which ranges from 0 (transparent) to 1 (opaque).
# install.packages("ggplot2")
library(ggplot2)

ggplot(df, aes(x = x, y = y, size = size)) +
  geom_point(color = "red", alpha = 0.5) +
  scale_size(name = "Size", range = c(3, 15))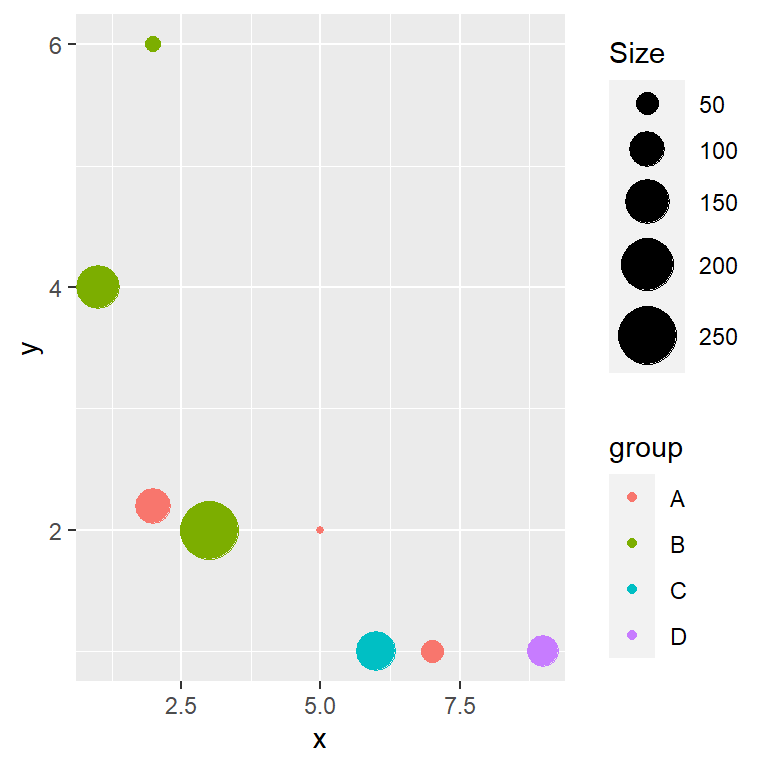
Color based on a categorical variable
If you have a categorical variable that represents groups you can pass the name of that variable to color inside aes, so each group of bubbles will be filled with a different color. Use scale_color_manual or an equivalent function if you want to customize the default colors.
# install.packages("ggplot2")
library(ggplot2)

ggplot(df, aes(x = x, y = y, size = size, color = group)) +
  geom_point() +
  scale_size(name = "Size", range = c(1, 10))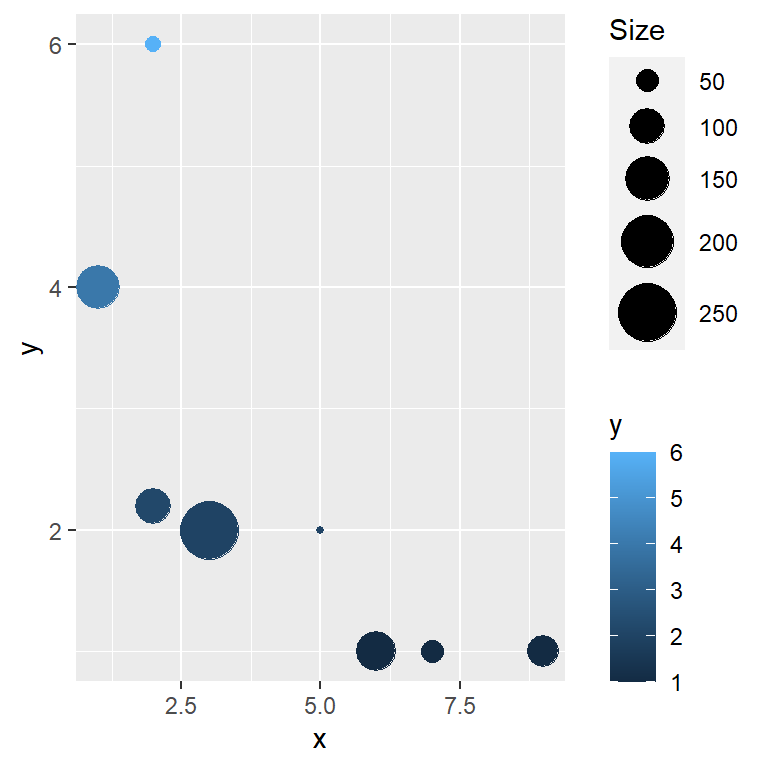
Color based on a continuous variable
The color of the bubbles can also be mapped to a continuous variable. In the following example we are using the y variable and hence a gradient color will be applied based on that variable. Use scale_color_gradient, scale_color_gradient2 or scale_color_gradientn to customize the color palette.
# install.packages("ggplot2")
library(ggplot2)

ggplot(df, aes(x = x, y = y, size = size, color = y)) +
  geom_point() +
  scale_size(name = "Size", range = c(1, 10))
Master Statistics
Learn statistics from the basics to advanced techniques, clearly explained
Go to site