The pheatmap function
The pheatmap function is similar to the default base R heatmap, but provides more control over the resulting plot. You can pass a numeric matrix containing the values to be plotted.
# install.packages("pheatmap")
library(pheatmap)

# Data
set.seed(8)
m <- matrix(rnorm(200), 10, 10)
colnames(m) <- paste("Col", 1:10)
rownames(m) <- paste("Row", 1:10)

# Heat map
pheatmap(m)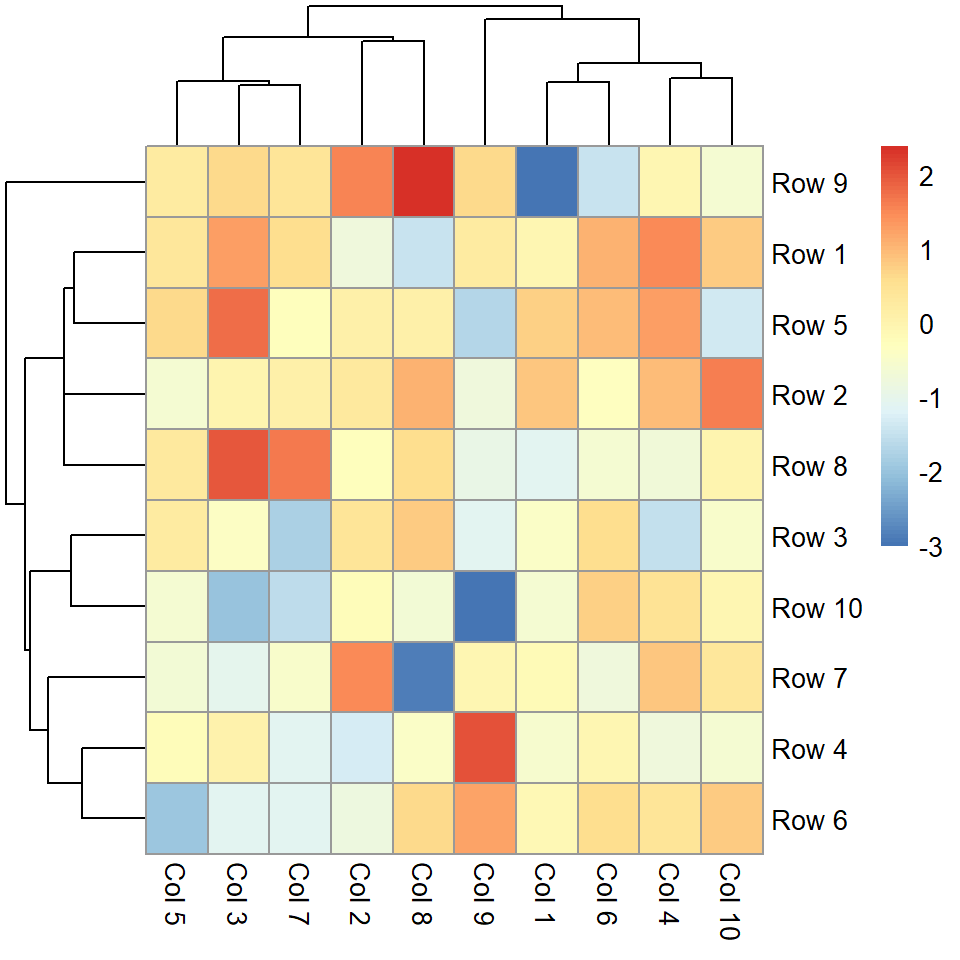
Normalization
If the values of the matrix are not normalized you can normalize them by rows ("row") or by columns ("column") making use of the scale argument.
# install.packages("pheatmap")
library(pheatmap)

# Data
set.seed(8)
m <- matrix(rnorm(200), 10, 10)
colnames(m) <- paste("Col", 1:10)
rownames(m) <- paste("Row", 1:10)

# Heat map
pheatmap(m, scale = "column")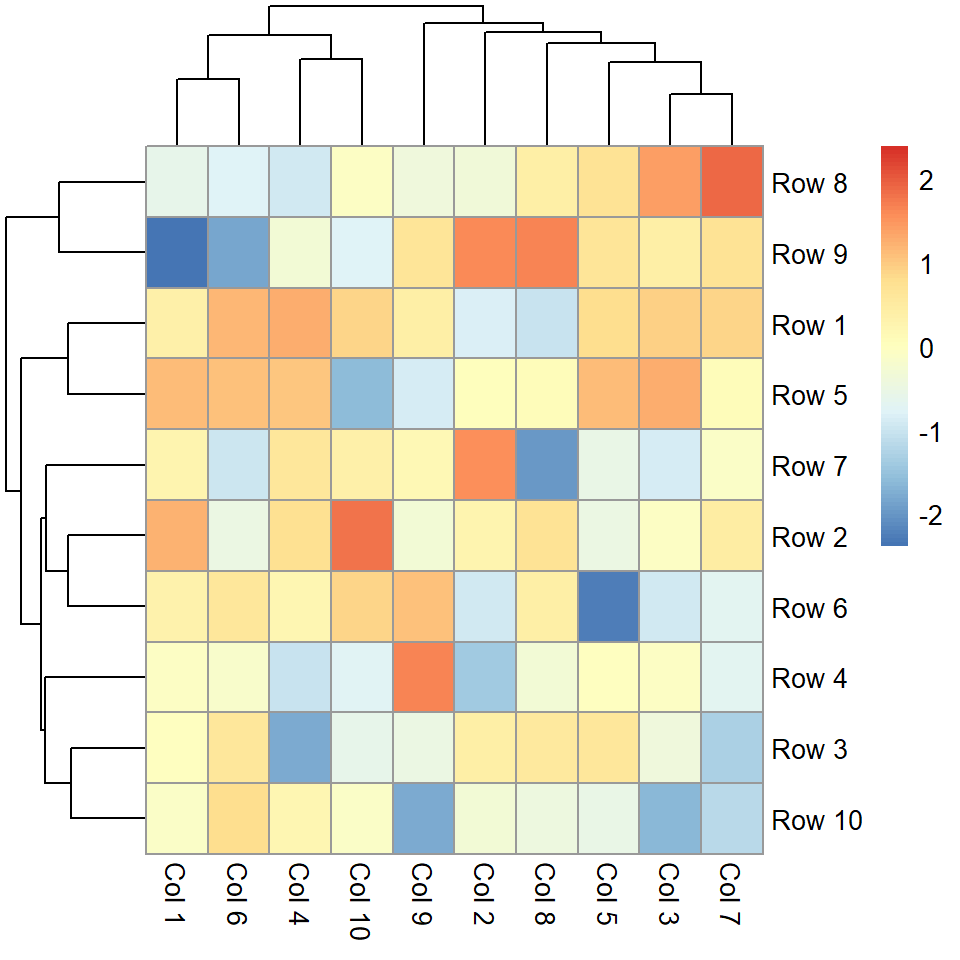
Values
If you set display_numbers = TRUE the values for each cell will be shown. You can also modify the color and the size of the text.
# install.packages("pheatmap")
library(pheatmap)

# Data
set.seed(8)
m <- matrix(rnorm(200), 10, 10)
colnames(m) <- paste("Col", 1:10)
rownames(m) <- paste("Row", 1:10)

# Heat map
pheatmap(m,
         display_numbers = TRUE,
         number_color = "black",
         fontsize_number = 8)
Number of clusters
The number of clusters can be changed with kmeans_k. If the number of clusters is small you can increase the size of the cells with cellheight or cellwidth.
# install.packages("pheatmap")
library(pheatmap)

# Data
set.seed(8)
m <- matrix(rnorm(200), 10, 10)
colnames(m) <- paste("Col", 1:10)
rownames(m) <- paste("Row", 1:10)

# Heat map
pheatmap(m, kmeans_k = 3, cellheight = 50)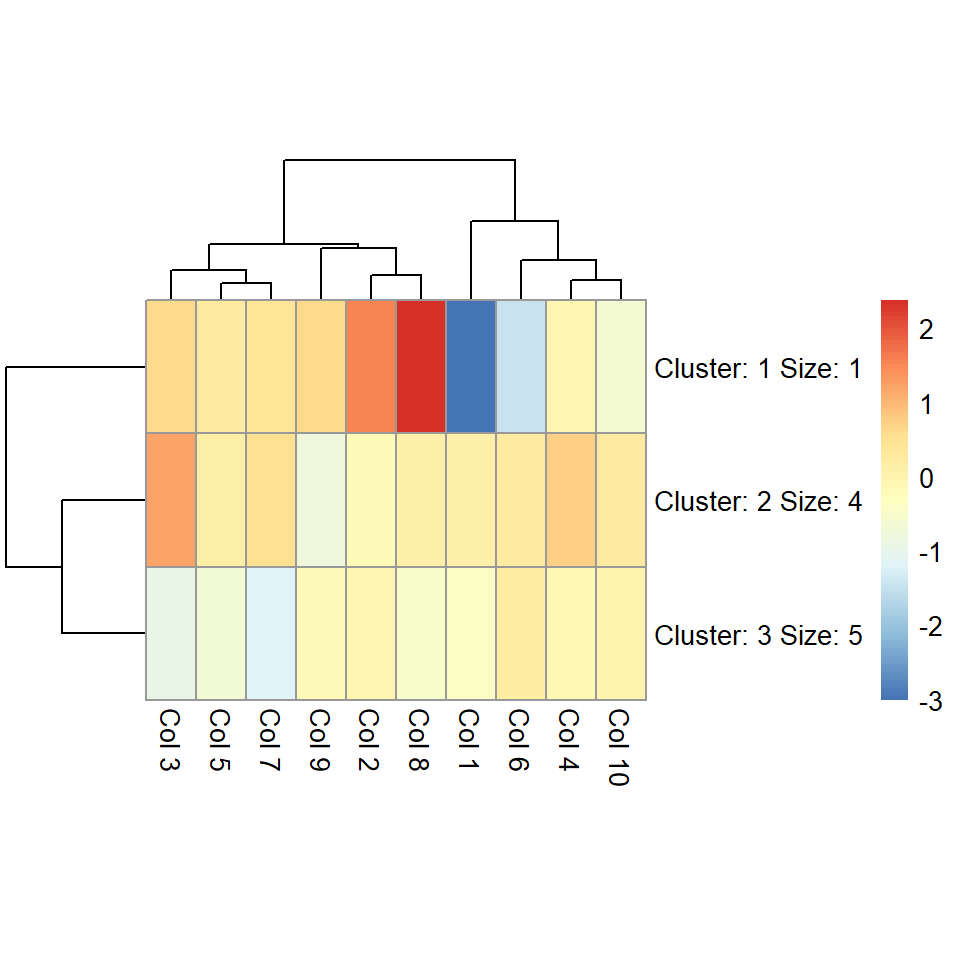
Clustering
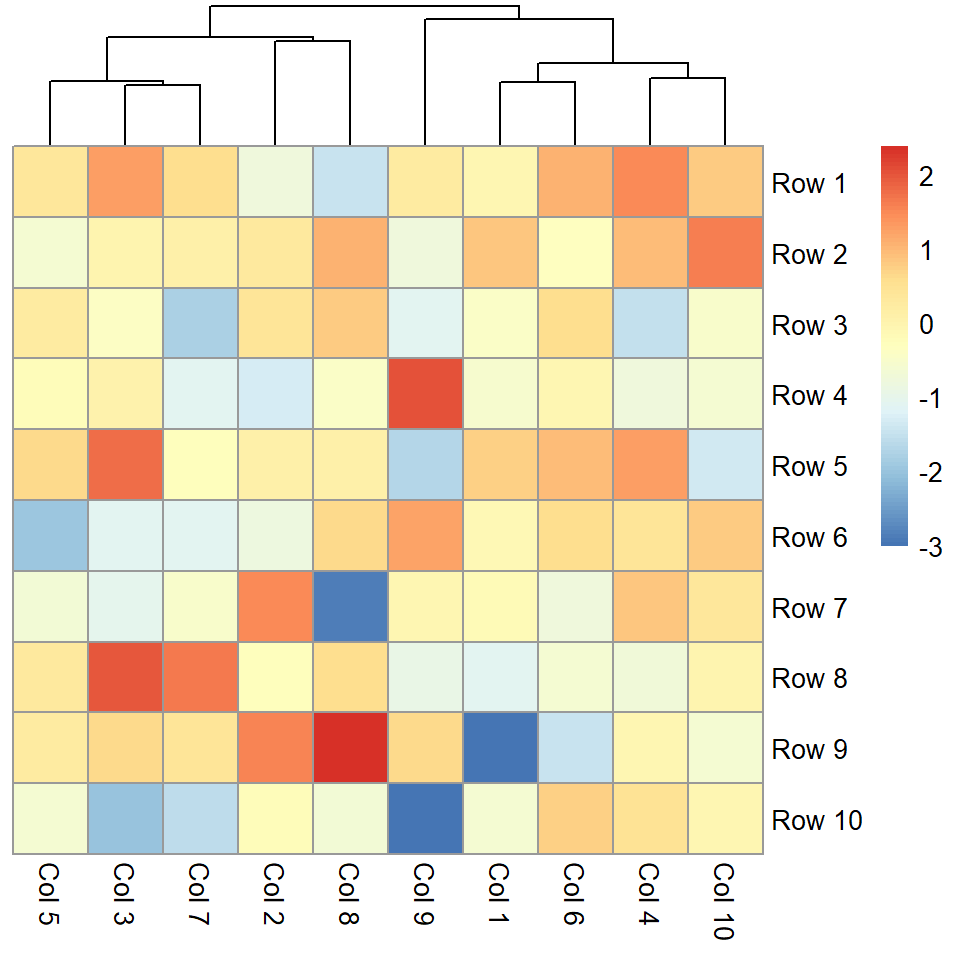
Remove rows dendrogram
You can pass a hclust object to the cluster_rows argument or set it to FALSE to remove the rows dendrogram.
# install.packages("pheatmap")
library(pheatmap)

# Data
set.seed(8)
m <- matrix(rnorm(200), 10, 10)
colnames(m) <- paste("Col", 1:10)
rownames(m) <- paste("Row", 1:10)

# Heat map
pheatmap(m, cluster_rows = FALSE)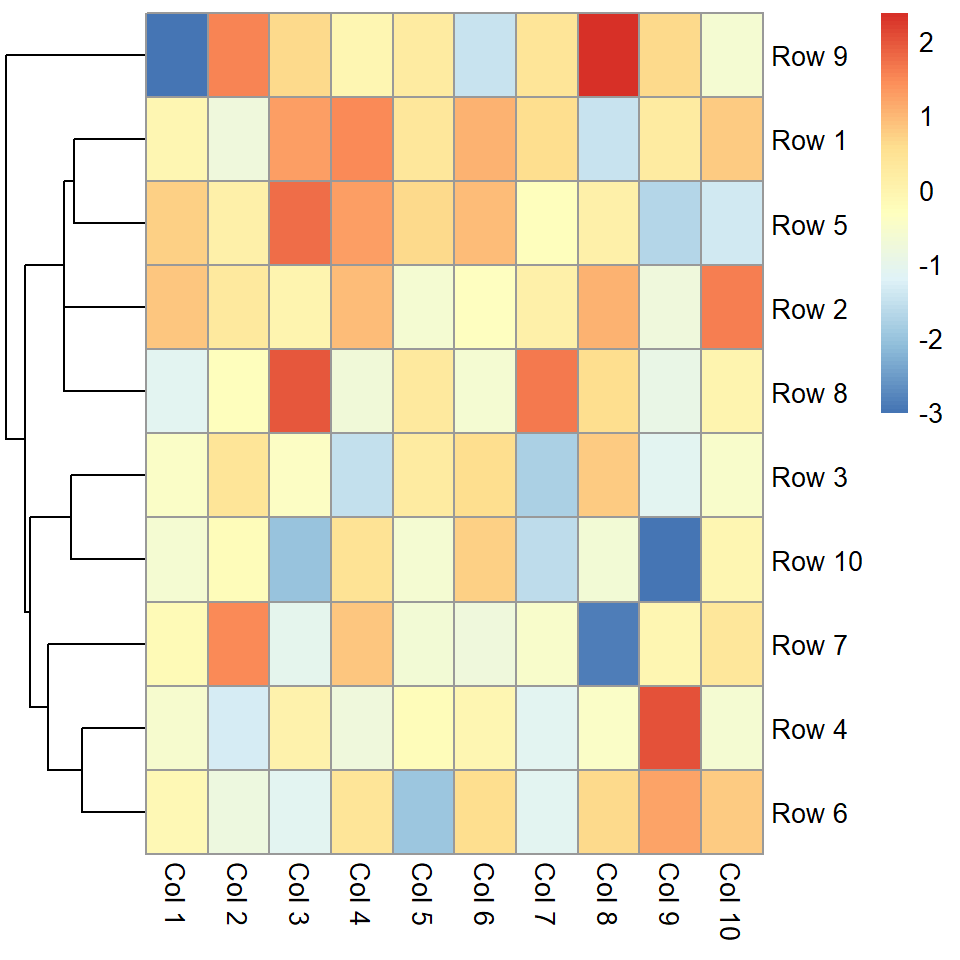
Remove columns dendrogram
Equivalently to the previous argument, cluster_cols controls how the columns dendrogram should be plotted or if not plot them at all.
# install.packages("pheatmap")
library(pheatmap)

# Data
set.seed(8)
m <- matrix(rnorm(200), 10, 10)
colnames(m) <- paste("Col", 1:10)
rownames(m) <- paste("Row", 1:10)

# Heat map
pheatmap(m, cluster_cols = FALSE)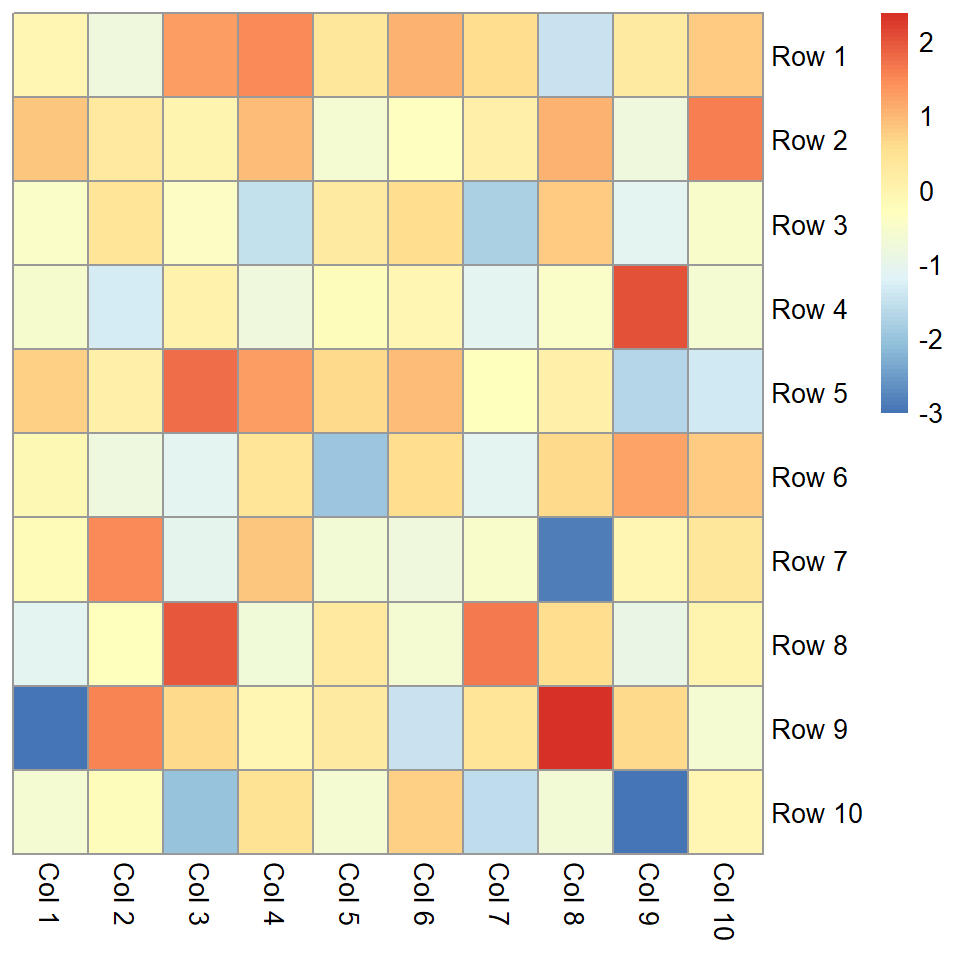
Remove dendrograms
It is possible to remove both dendrograms setting cluster_cols and cluster_rows to FALSE.
# install.packages("pheatmap")
library(pheatmap)

# Data
set.seed(8)
m <- matrix(rnorm(200), 10, 10)
colnames(m) <- paste("Col", 1:10)
rownames(m) <- paste("Row", 1:10)

# Heat map
pheatmap(m,
         cluster_cols = FALSE,
         cluster_rows = FALSE)
Color customization
Border color
The border_color controls the border of the cells. The default value is "grey60".
# install.packages("pheatmap")
library(pheatmap)

# Data
set.seed(8)
m <- matrix(rnorm(200), 10, 10)
colnames(m) <- paste("Col", 1:10)
rownames(m) <- paste("Row", 1:10)

# Heat map
pheatmap(m, border_color = "black")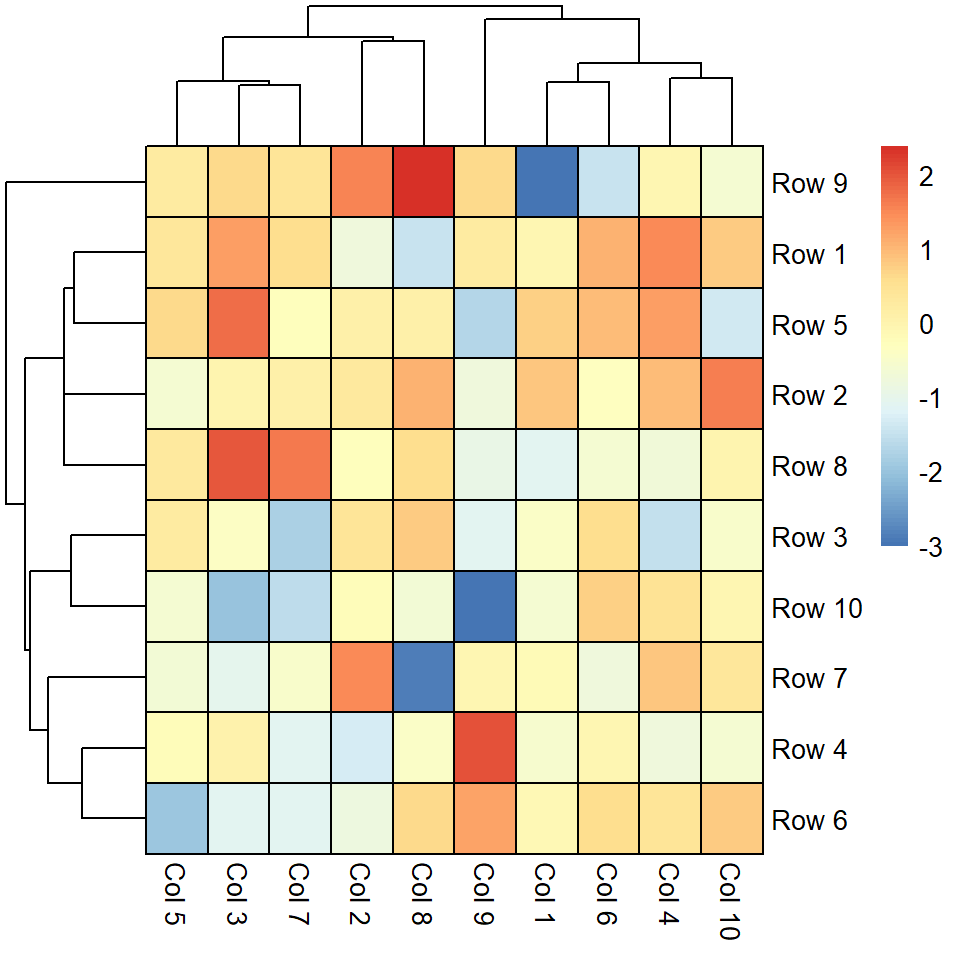
Color palette
The default color palette can be changed passing a vector of colors to the color argument, as in the example below.
# install.packages("pheatmap")
library(pheatmap)

# Data
set.seed(8)
m <- matrix(rnorm(200), 10, 10)
colnames(m) <- paste("Col", 1:10)
rownames(m) <- paste("Row", 1:10)

# Heat map
pheatmap(m, color = hcl.colors(50, "BluYl"))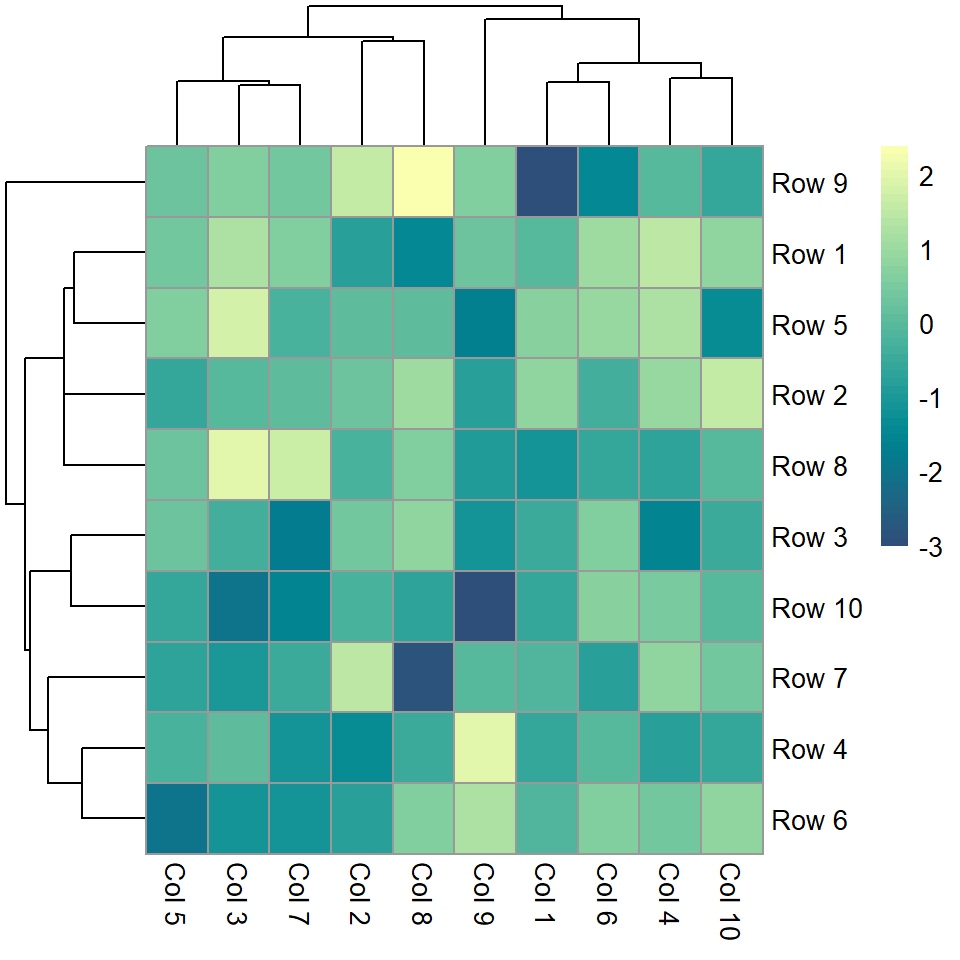
Legend customization

Legend breaks
The breaks of the legend can be customized with legend_breaks, passing the desired values as a vector.
# install.packages("pheatmap")
library(pheatmap)

# Data
set.seed(8)
m <- matrix(rnorm(200), 10, 10)
colnames(m) <- paste("Col", 1:10)
rownames(m) <- paste("Row", 1:10)

# Heat map
pheatmap(m, legend_breaks = c(-2, 0, 2))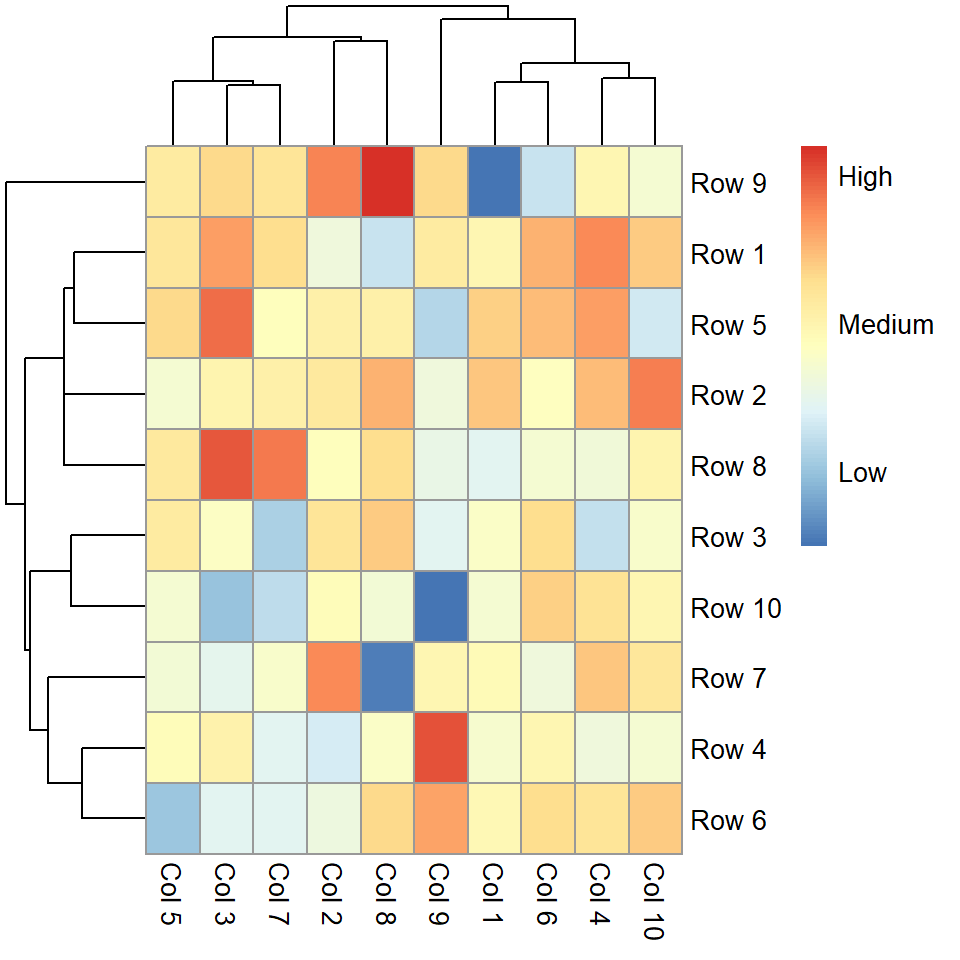
Legend labels
If you set the breaks you can also pass a vector of the same length to modify the labels to the legend_labels argument.
# install.packages("pheatmap")
library(pheatmap)

# Data
set.seed(8)
m <- matrix(rnorm(200), 10, 10)
colnames(m) <- paste("Col", 1:10)
rownames(m) <- paste("Row", 1:10)

# Heat map
pheatmap(m,
         legend_breaks = c(-2, 0, 2),
         legend_labels = c("Low", "Medium", "High"))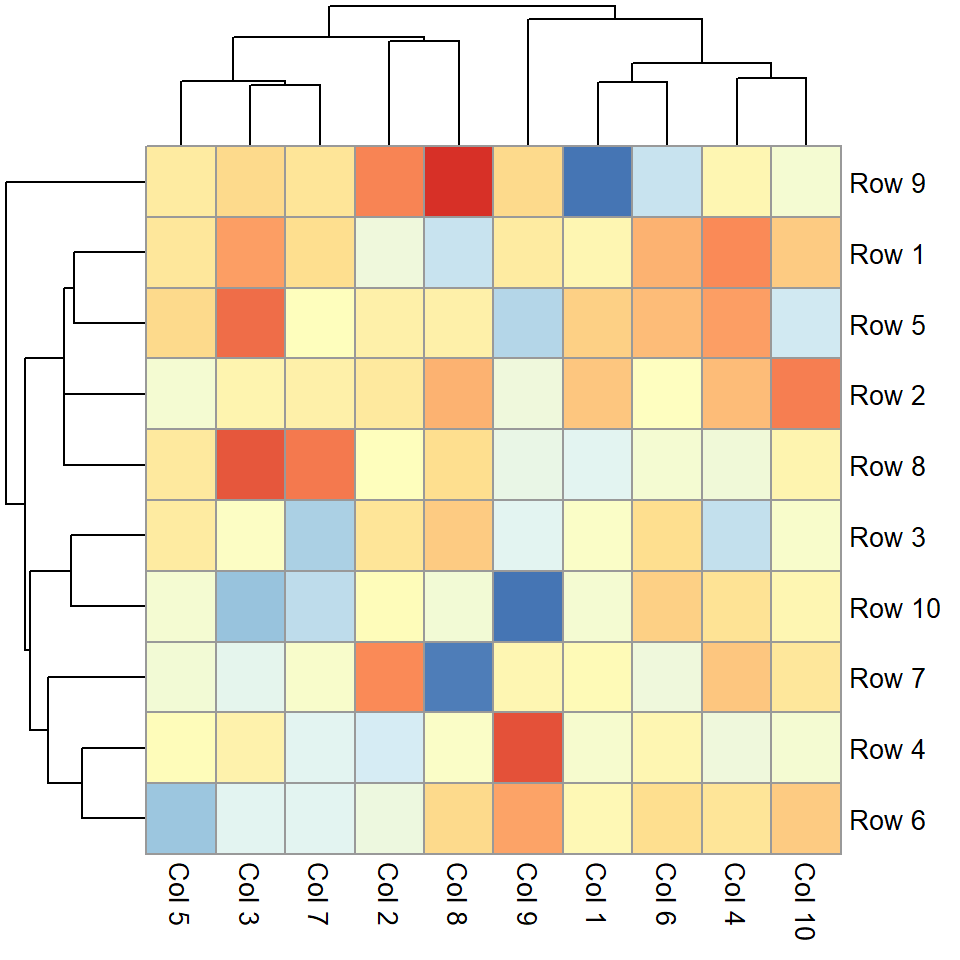
Remove the legend
Finally, if you want to get rid of the legend set legend = FALSE.
# install.packages("pheatmap")
library(pheatmap)

# Data
set.seed(8)
m <- matrix(rnorm(200), 10, 10)
colnames(m) <- paste("Col", 1:10)
rownames(m) <- paste("Row", 1:10)

# Heat map
pheatmap(m, legend = FALSE)
Master Statistics
Learn statistics from the basics to advanced techniques, clearly explained
Go to site