Connected scatter plot
A connected scatter plot represents the relationship between two variables, generally through the time. You can create this type of chart in base R with the plot function, setting type = "b".
# Data
x <- c(1, 2, 3, 4, 5, 4, 7, 8, 9)
y <- c(12, 16, 14, 18, 16, 13, 15, 20, 22)

# Connected scatter plot
plot(x, y, type = "b",
     xlab = "Var 1", ylab = "Var 2")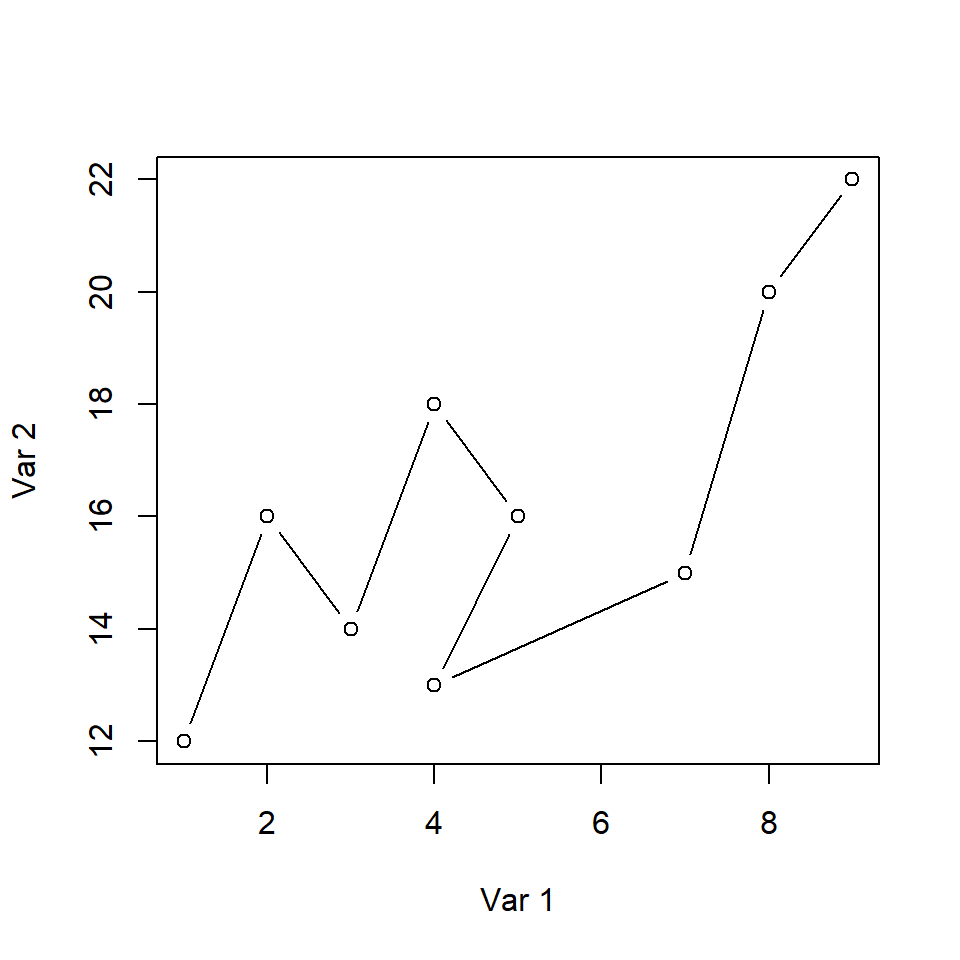
Symbol
The symbol used by default when type = "b" can be modified making use of the pch argument.
# Data
x <- c(1, 2, 3, 4, 5, 4, 7, 8, 9)
y <- c(12, 16, 14, 18, 16, 13, 15, 20, 22)

plot(x, y,
     type = "b", pch = 18,
     xlab = "Var 1", ylab = "Var 2")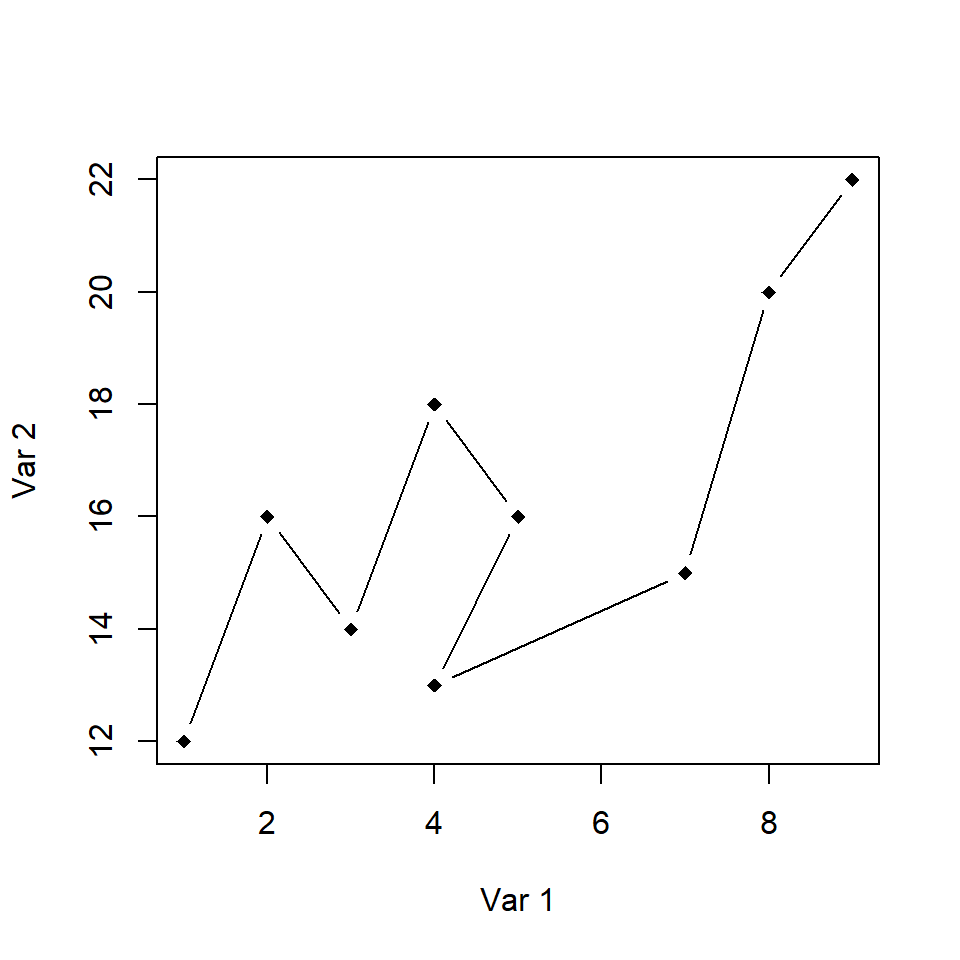
Color and points
You can change the color of the lines and points. However, the color of the points and the lines will be the same. You can override the points using the points function.
# Data
x <- c(1, 2, 3, 4, 5, 4, 7, 8, 9)
y <- c(12, 16, 14, 18, 16, 13, 15, 20, 22)

# Custom points and color
plot(x, y, type = "b",
     pch = 19, col = 4,
     xlab = "Var 1", ylab = "Var 2")
points(x, y, pch = 19)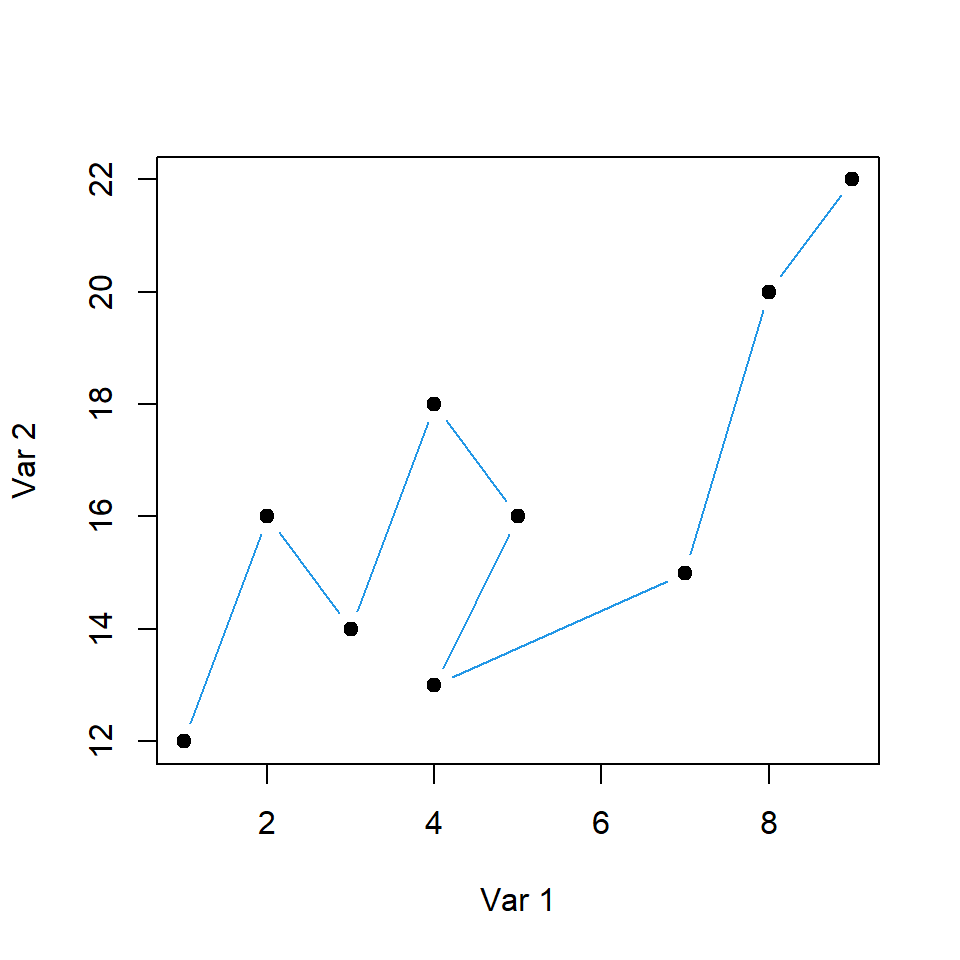
Adding text
You can label the points with the text function. This can be useful, for instance, to label the date for each pair of observations. Note that we fine tuned the position of the labels for better readability.
# Data
x <- c(1, 2, 3, 4, 5, 4, 7, 8, 9)
y <- c(12, 16, 14, 18, 16, 13, 15, 20, 22)
labels <- 2013:2021

# Connected scatter plot with text
plot(x, y, type = "b",
     xlim = c(1, 10), ylim = c(12, 23),
     pch = 19, col = 4,
     xlab = "Var 1", ylab = "Var 2")
text(x + 0.7, y + 0.4, labels)
Connected scatter plot with arrows
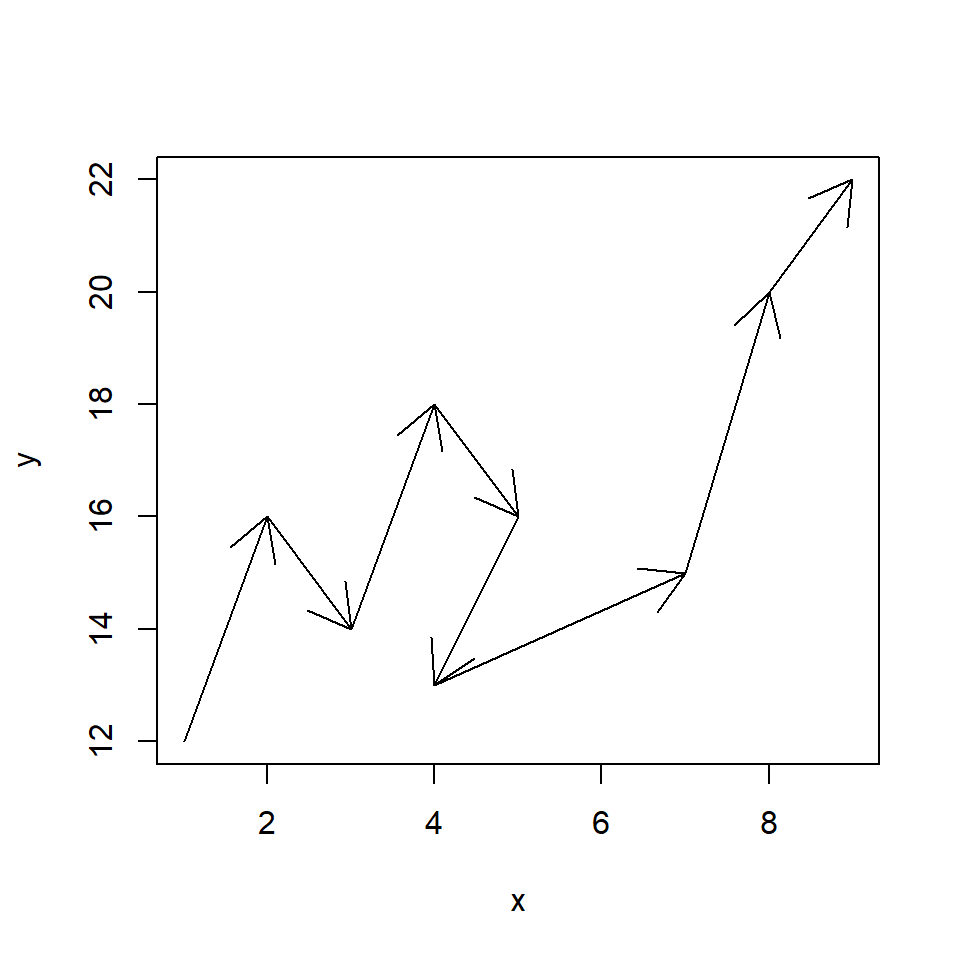
Connected scatter plot with arrows
Other possibility is to use arrows to draw a path between the observations of the variables. For that purpose you can use the following function.
conArrows <- function(x, y, ...) {
  plot(x, y, pch = "", ...)
  invisible(sapply(1:length(x),
    function(i) arrows(x[i], y[i],
                       x[i + 1], y[i + 1], ...)))
}

# Data
x <- c(1, 2, 3, 4, 5, 4, 7, 8, 9)
y <- c(12, 16, 14, 18, 16, 13, 15, 20, 22)

# Connected scatter plot with arrows
conArrows(x, y)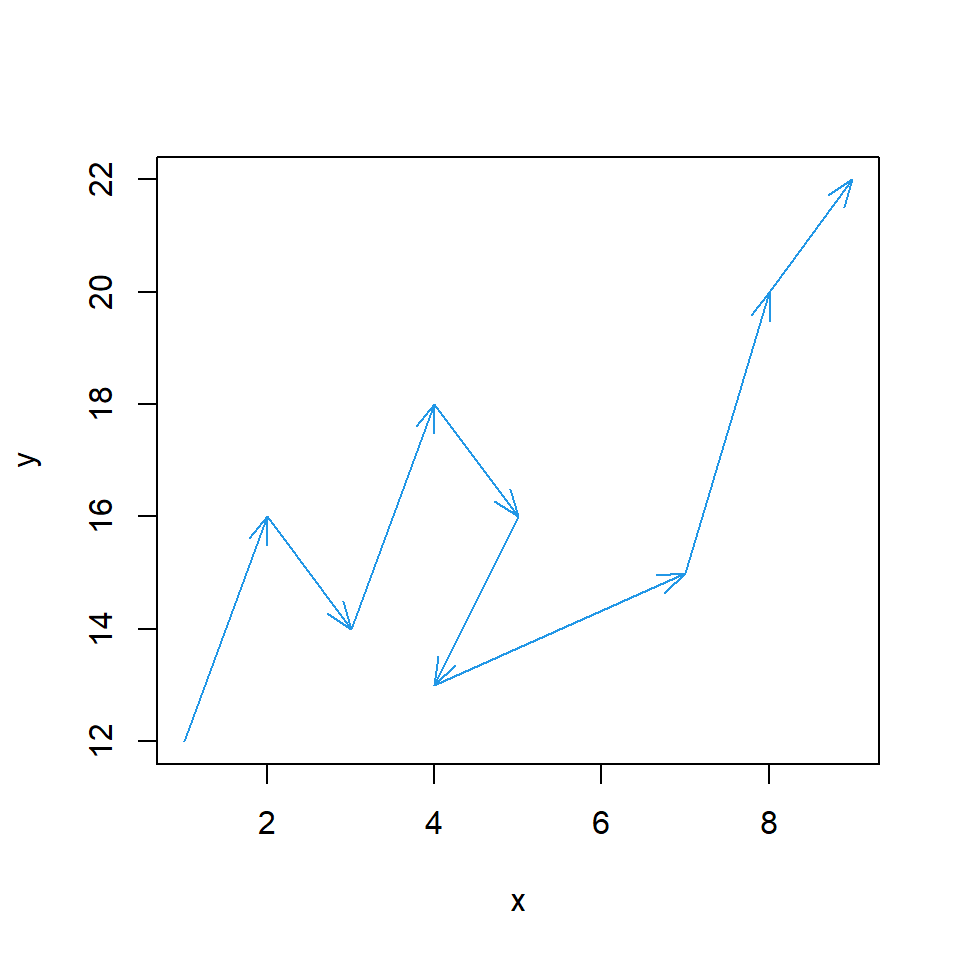
Customization
You can pass arguments to the function to customize the output, as shown in the example below.
conArrows <- function(x, y, ...) {
  plot(x, y, pch = "", ...)
  invisible(sapply(1:length(x),
    function(i) arrows(x[i], y[i],
                       x[i + 1], y[i + 1], ...)))
}

# Data
x <- c(1, 2, 3, 4, 5, 4, 7, 8, 9)
y <- c(12, 16, 14, 18, 16, 13, 15, 20, 22)

# Connected scatter plot with arrows
conArrows(x, y, angle = 20, length = 0.15, col = 4)
Master Statistics
Learn statistics from the basics to advanced techniques, clearly explained
Go to site