Sample data
Consider the following data frame which consists on two numerical variables and a grouping variable with three different groups for this tutorial.
set.seed(2)

# Data simulation
x <- runif(500)
y <- 4 * x ^ 2 + rnorm(length(x), sd = 4)
group <- ifelse(x < 0.4, "A",
                 ifelse(x > 0.8, "C", "B"))
x <- x + runif(length(x), -0.15, 0.15)

# Data frame
df <- data.frame(x = x, y = y, group = group)
Adding ellipses with stat_ellipse
Default ellipse
You can add an ellipse to your scatter plot adding the stat_ellipse layer, as shown in the example below.
# install.packages("ggplot2")
library(ggplot2)

ggplot(df, aes(x = x, y = y)) +
  geom_point() +
  stat_ellipse()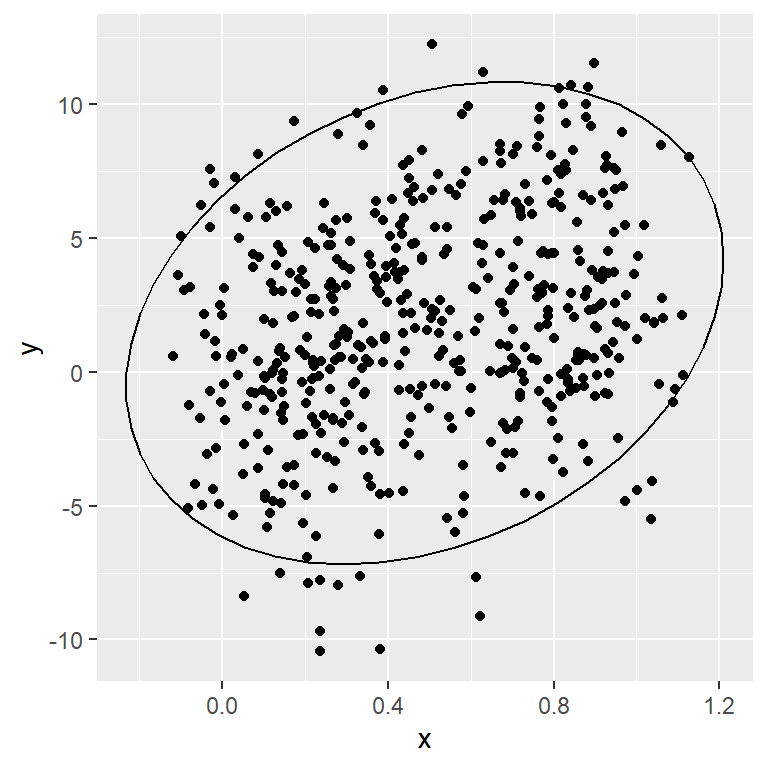
Customization
The color, line type and line width of the ellipse can be customized with color, linetype and lwd arguments, respectively.
# install.packages("ggplot2")
library(ggplot2)

ggplot(df, aes(x = x, y = y)) +
  geom_point() +
  stat_ellipse(color = 2,
               linetype = 2,
               lwd = 1.2)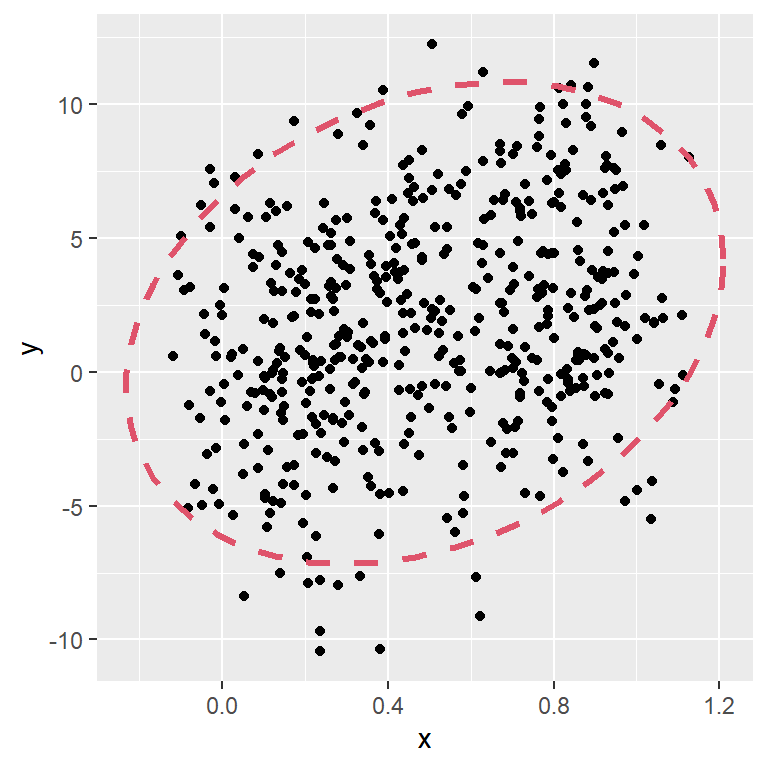
Confidence levels
By default, the stat_ellipse function draws a 95% confidence level for a multivariate t-distribution. You can modify this level with level argument.
# install.packages("ggplot2")
library(ggplot2)

ggplot(df, aes(x = x, y = y)) +
  geom_point() +
  stat_ellipse(level = 0.9) +
  stat_ellipse(level = 0.95, color = 2) +
  stat_ellipse(level = 0.99, color = 3)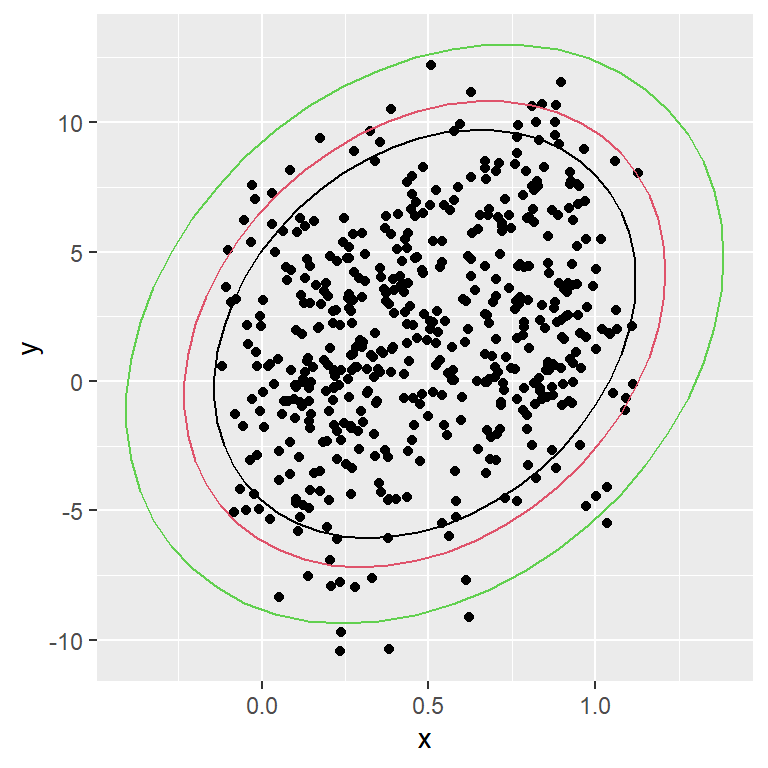
Segments
The default number of segments to create the ellipse is 51, but you can modify this number with segments argument.
# install.packages("ggplot2")
library(ggplot2)

ggplot(df, aes(x = x, y = y)) +
  geom_point() +
  stat_ellipse(segments = 10)
Ellipses by group
When you create a scatter plot by group, the ellipses are created for each group.
# install.packages("ggplot2")
library(ggplot2)

ggplot(df, aes(x = x, y = y, color = group)) +
  geom_point() +
  stat_ellipse()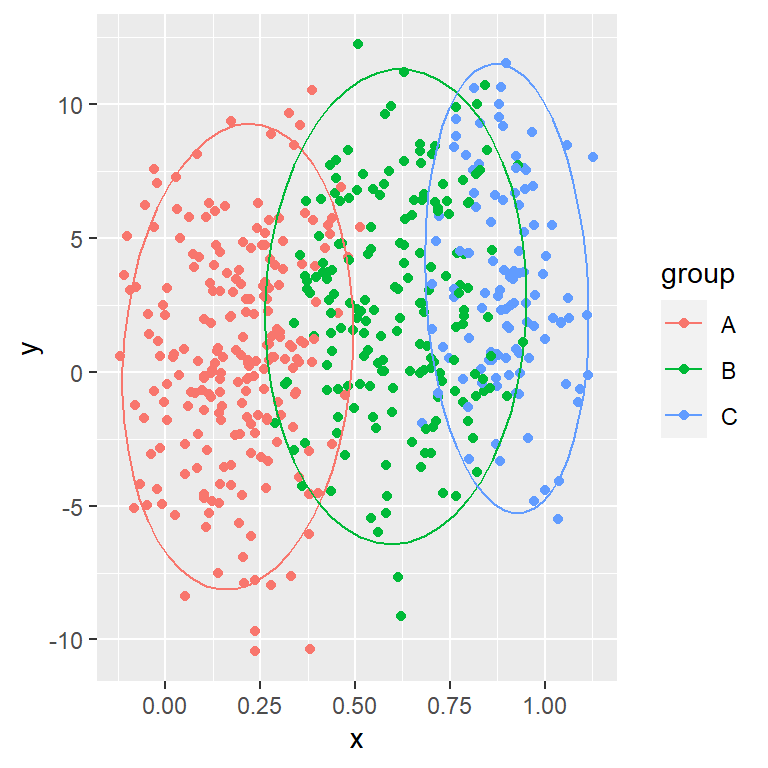
Linetype by group
You can also change the line type of the ellipses based on the group, passing the grouping variable to the linetype argument of the aes function.
# install.packages("ggplot2")
library(ggplot2)

ggplot(df, aes(x = x, y = y, color = group,
               linetype = group)) +
  geom_point() +
  stat_ellipse()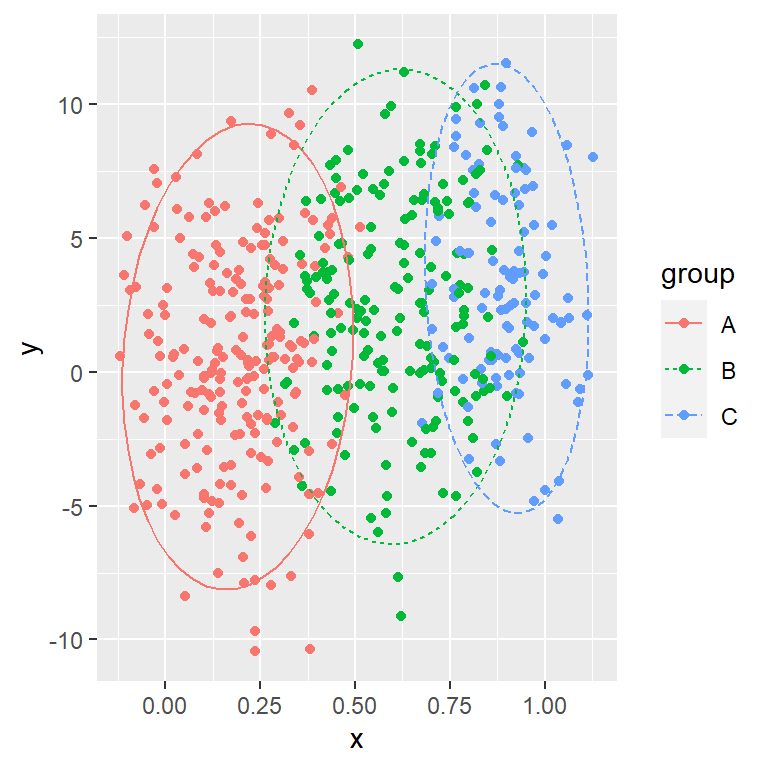
Filling the area of the ellipses
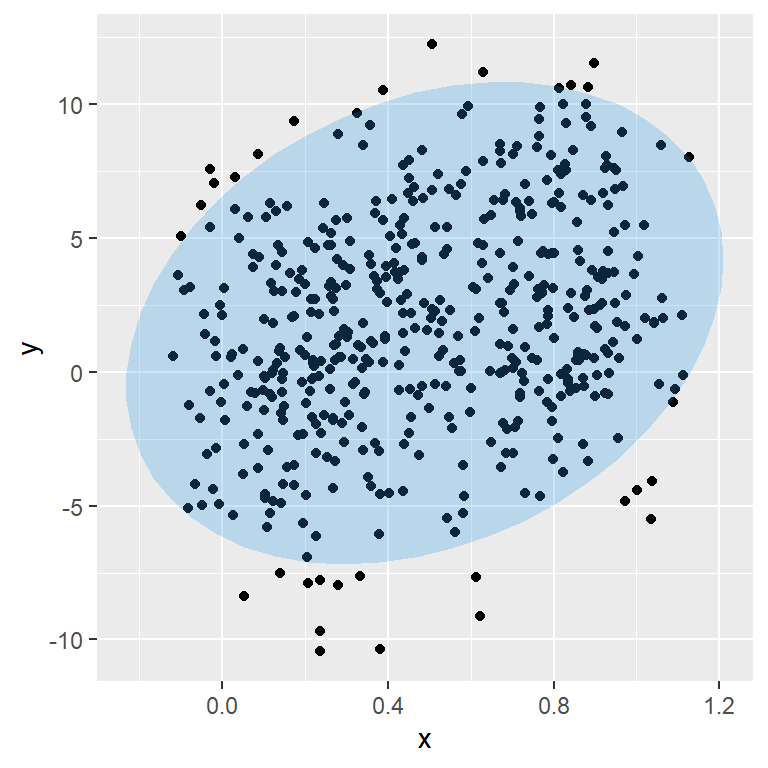
Polygon
The stat_ellipse uses geom_path by default to create the ellipse, but if you set geom = "polygon" a polygon will be created. Note that you can change the level of transparency with alpha.
# install.packages("ggplot2")
library(ggplot2)

ggplot(df, aes(x = x, y = y))+
  geom_point() +
  stat_ellipse(geom = "polygon",
               fill = 4, alpha = 0.25)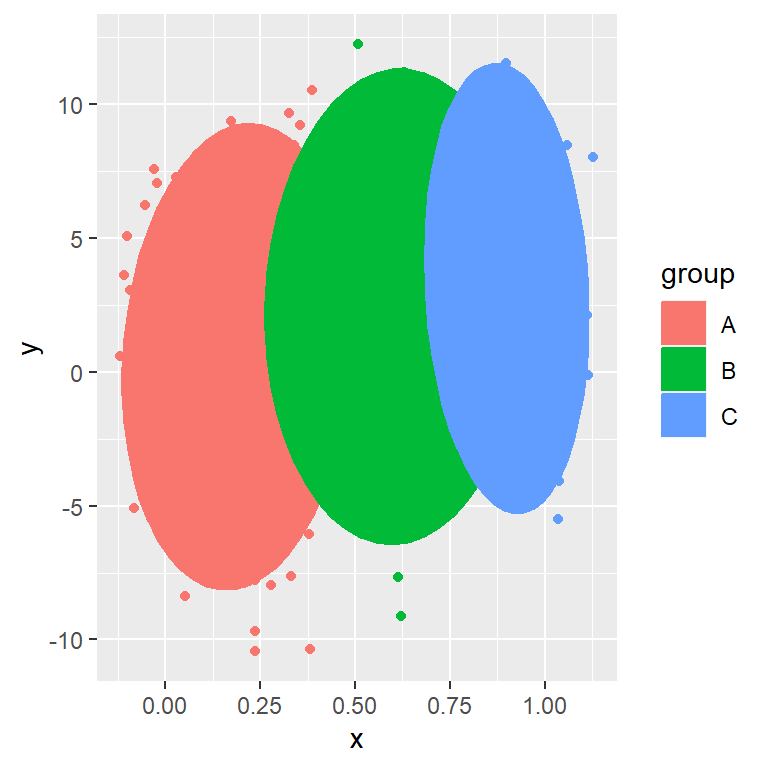
Polygon by group
If you create a scatter plot by group and set geom = "polygon" inside stat_ellipse the polygons areas will be filled by group.
# install.packages("ggplot2")
library(ggplot2)

ggplot(df, aes(x = x, y = y, color = group)) +
  geom_point() +
  stat_ellipse(geom = "polygon",
               aes(fill = group))
Polygon by group with transparency
As in one of the previous examples, the alpha argument can be used to set the level of transparency of the polygons.
# install.packages("ggplot2")
library(ggplot2)

ggplot(df, aes(x = x, y = y, color = group)) +
  geom_point() +
  stat_ellipse(geom = "polygon",
               aes(fill = group),
               alpha = 0.25)
Ellipse types
Normal ellipse
By default, the stat_ellipse function assumes a multivariate t-distribution (type = "t"). However, you can set type = "norm" to assume a multivariate normal distribution.
# install.packages("ggplot2")
library(ggplot2)

ggplot(df, aes(x = x, y = y, color = group)) +
  geom_point() +
  stat_ellipse(type = "t") +
  stat_ellipse(type = "norm", linetype = 2)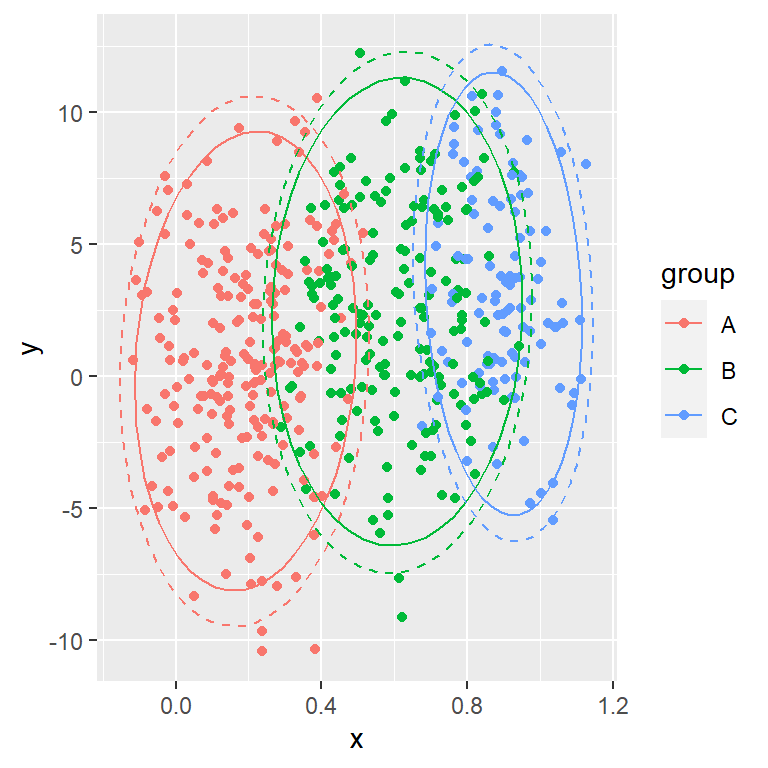
Euclidean ellipse
The other option is setting type = "euclid" for an euclidean ellipse. Note that the ellipse won’t appear circular unless you set coord_fixed. In this scenario, if you set a level, the level will be the radius of the circle to be drawn.
# install.packages("ggplot2")
library(ggplot2)

ggplot(df, aes(x = x, y = y, color = group)) +
  geom_point() +
  stat_ellipse(type = "euclid")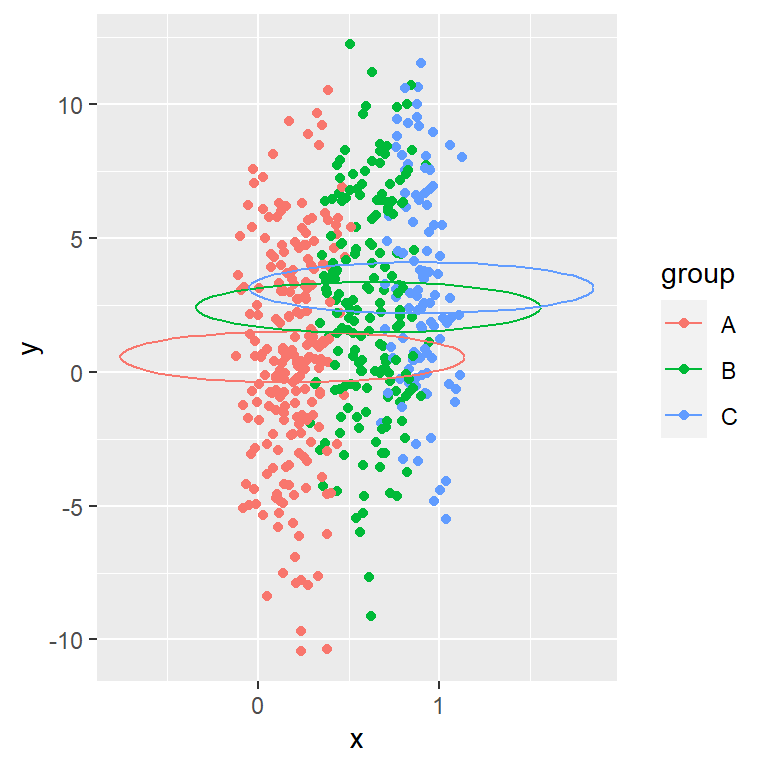

Master Statistics
Learn statistics from the basics to advanced techniques, clearly explained
Go to site