The hexbin package
In base R it is possible to create a hexbin chart making use of the hexbin package, which contains a function of the same name to create a hexbin object that can be plotted.
# install.packages("hexbin")
library(hexbin)

# Data
set.seed(1)
x <- rnorm(5000)
y <- rnorm(5000)

hex <- hexbin(x, y)
plot(hex)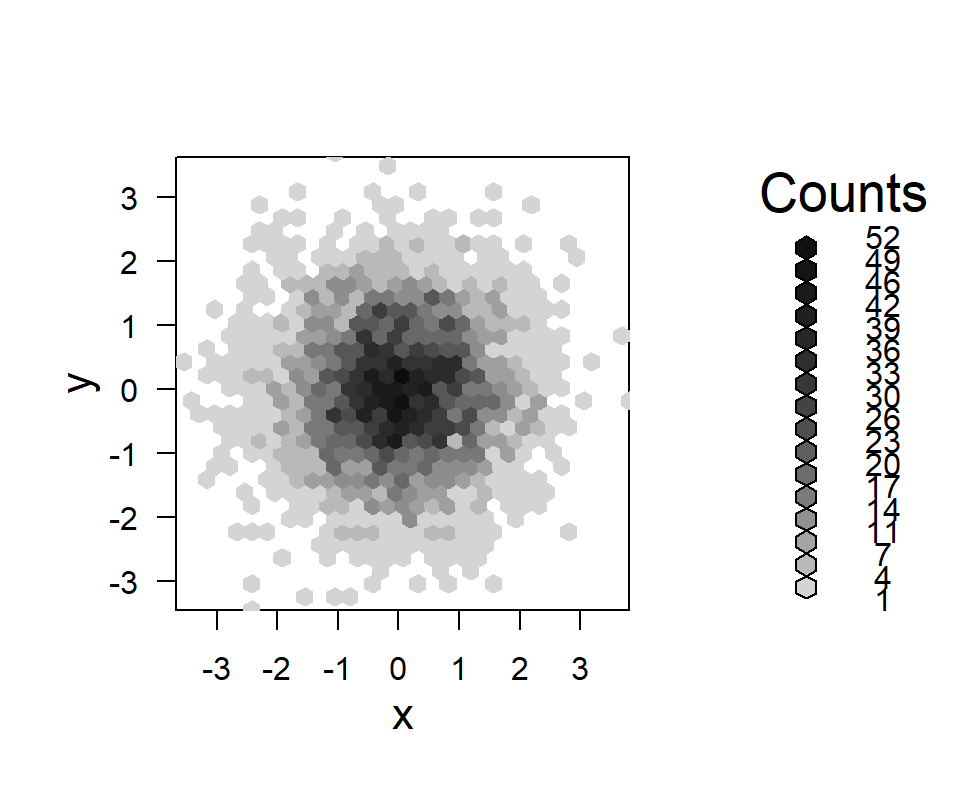
Number of bins
The xbins argument controls the number of bins. The default value is 30.
# install.packages("hexbin")
library(hexbin)

# Data
set.seed(1)
x <- rnorm(5000)
y <- rnorm(5000)

hex <- hexbin(x, y, xbins = 20)
plot(hex)
Color customization
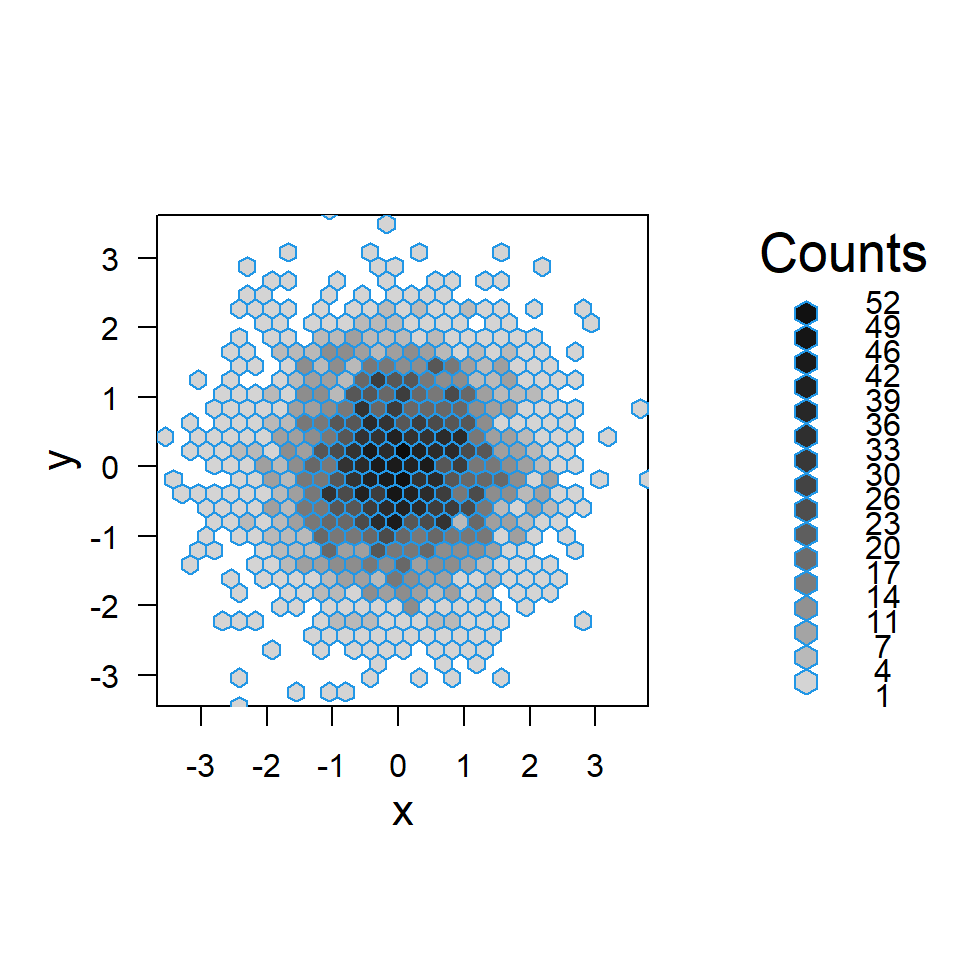
Border color
The border color of the hexagons can be customized with the boder argument.
# install.packages("hexbin")
library(hexbin)

# Data
set.seed(1)
x <- rnorm(5000)
y <- rnorm(5000)

hex <- hexbin(x, y)
plot(hex, border = 4)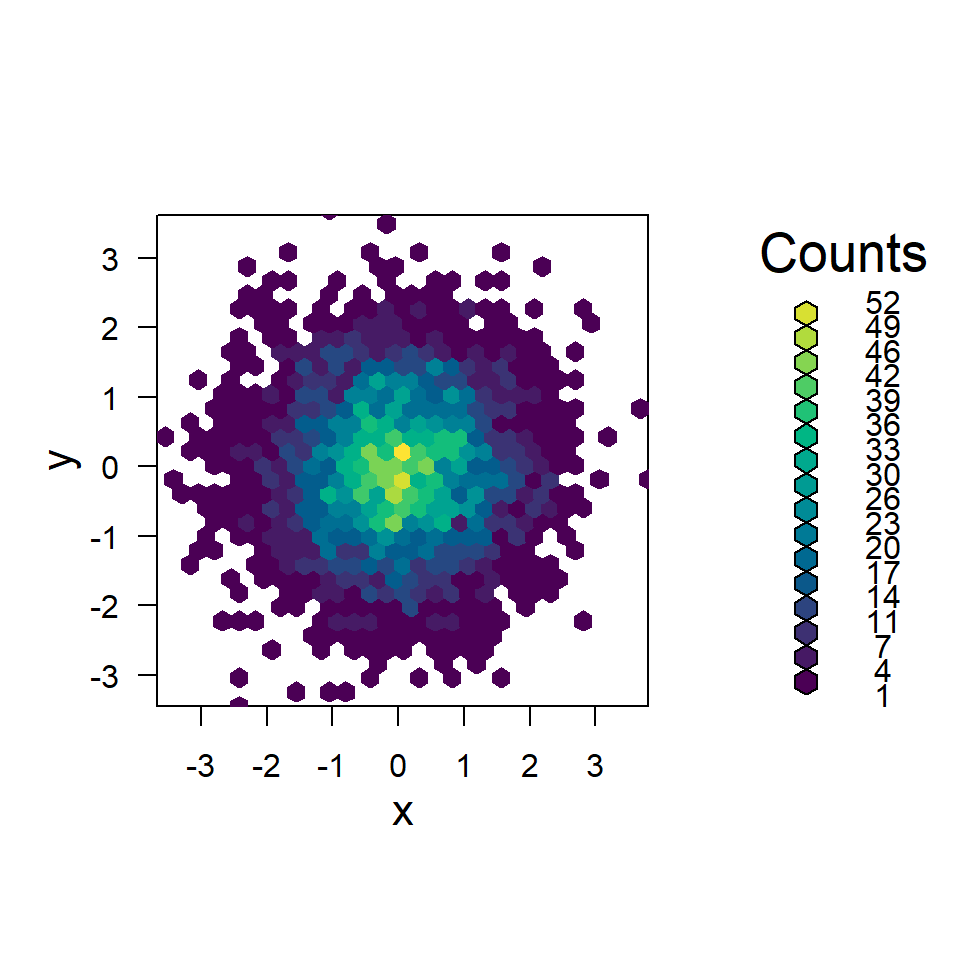
Color palette
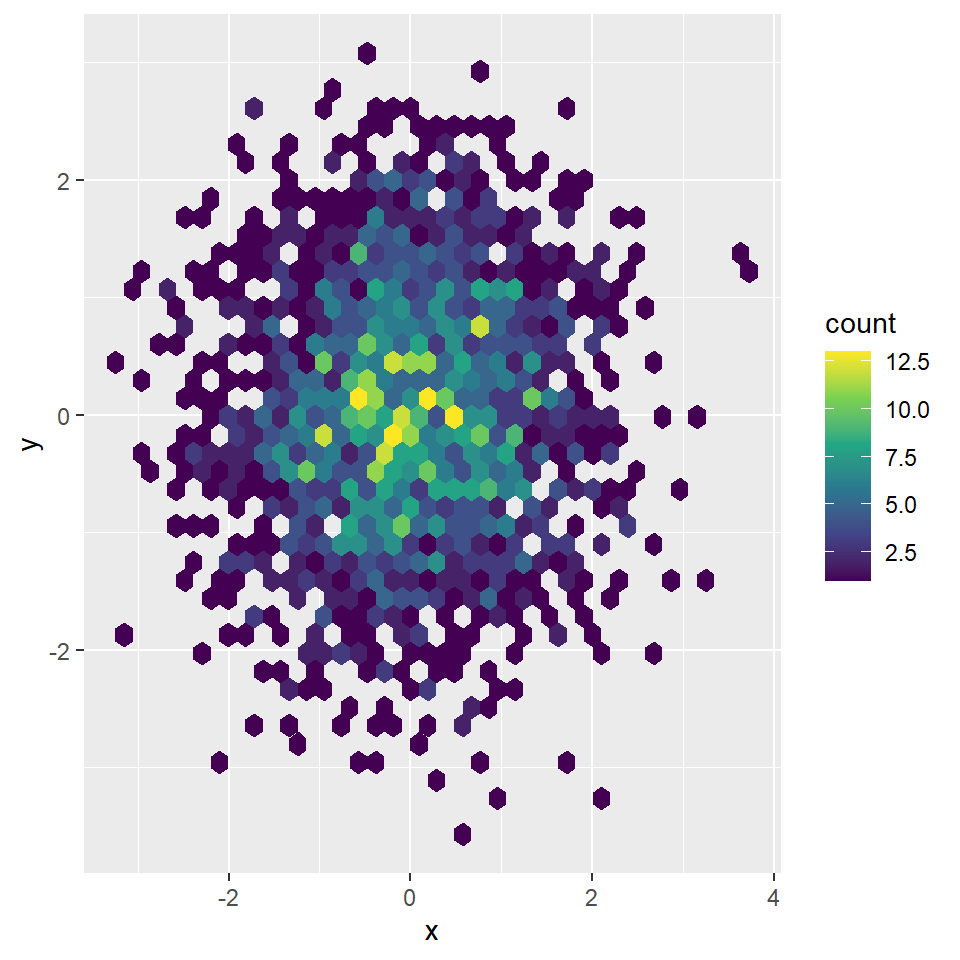
The default gray color palette can be customized passing a color ramp palette to the colramp argument. In the following example we are passing 12 colors of the viridis palette with the hcl.colors function.
# install.packages("hexbin")
library(hexbin)

# Data
set.seed(1)
x <- rnorm(5000)
y <- rnorm(5000)

hex <- hexbin(x, y)
plot(hex, colramp = colorRampPalette(hcl.colors(12)))
Legend
Legend width
The legend argument allows customizing the width of the default legend. However, if the value is too small the legend will be cropped. Default value is 1.2.
# install.packages("hexbin")
library(hexbin)

# Data
set.seed(1)
x <- rnorm(5000)
y <- rnorm(5000)

hex <- hexbin(x, y)
plot(hex, legend = 0.9)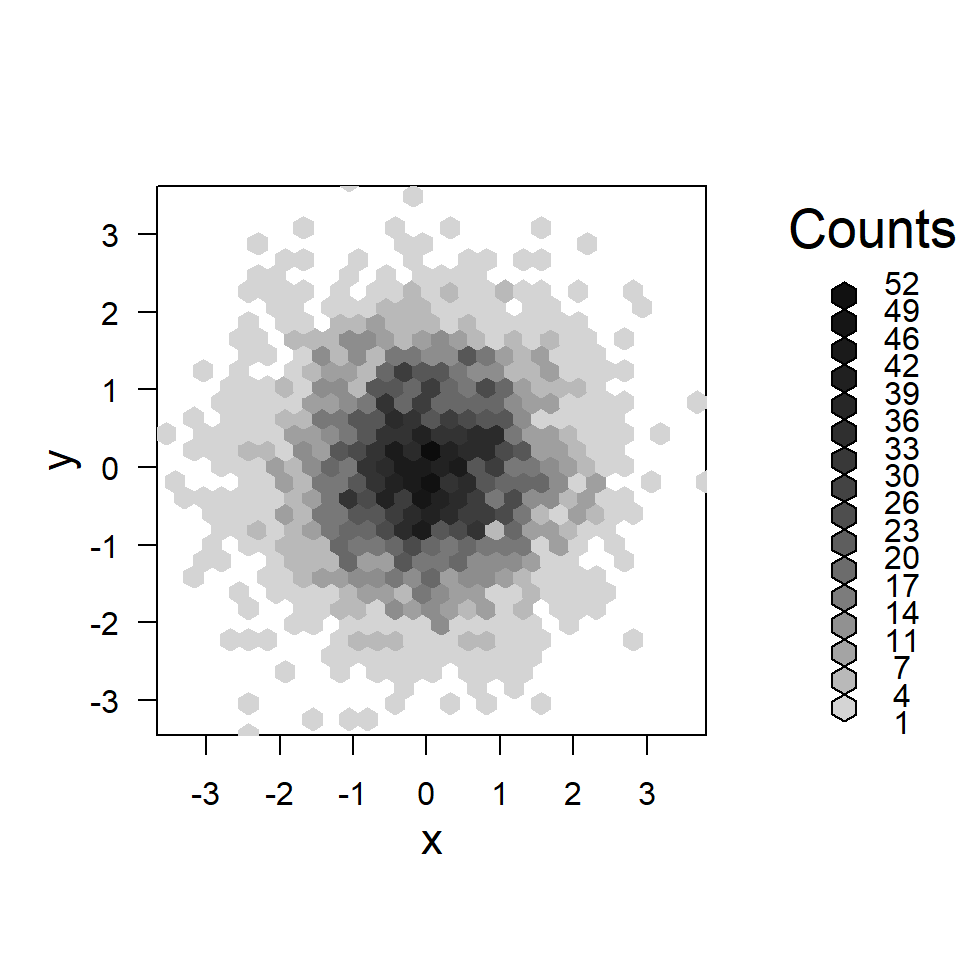
Text size of the legend
You can also change the text size of the legend with lcex.
# install.packages("hexbin")
library(hexbin)

# Data
set.seed(1)
x <- rnorm(5000)
y <- rnorm(5000)

hex <- hexbin(x, y)
plot(hex, lcex = 0.9)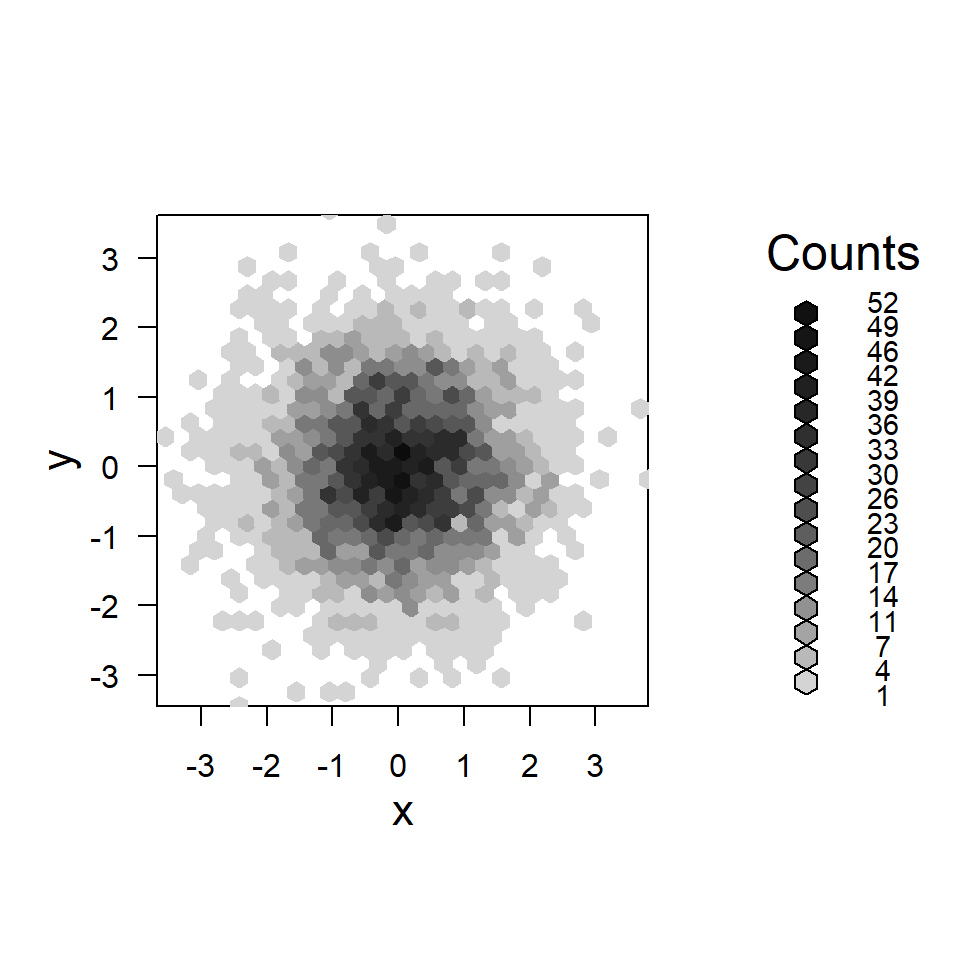
Remove the legend
Finally, if you want to remove the legend set the legend argument to FALSE.
# install.packages("hexbin")
library(hexbin)

# Data
set.seed(1)
x <- rnorm(5000)
y <- rnorm(5000)

hex <- hexbin(x, y)
plot(hex, legend = FALSE,
     colramp = colorRampPalette(hcl.colors(12, "GnBu")))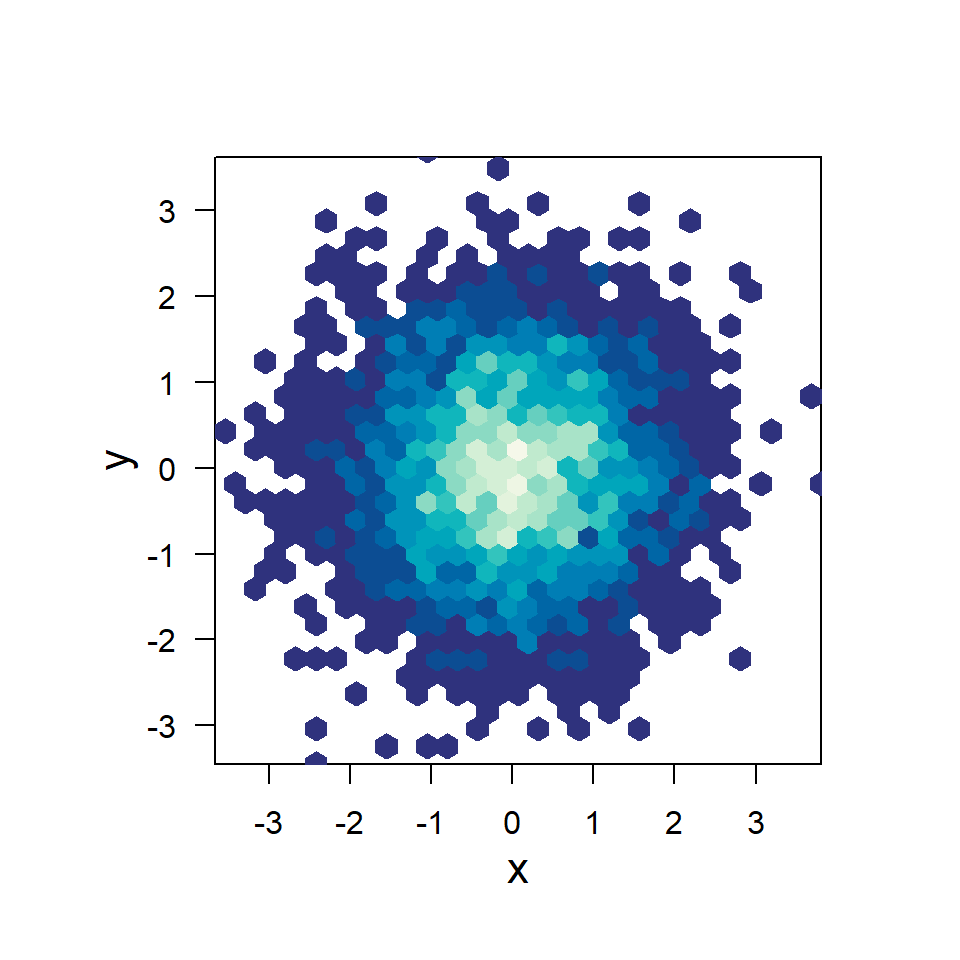

Master Statistics
Learn statistics from the basics to advanced techniques, clearly explained
Go to site