Adding marginal histograms with ggExtra
The ggMarginal function of the ggExtra package allows adding marginal histograms to an existing scatter plot. For that purpose you will need to store the scatter plot made with ggplot2 inside a variable and pass it to ggMarginal, specifying type = "histogram".
# install.packages("ggplot2")
# install.packages("ggExtra")
library(ggplot2)
library(ggExtra)

# Save the scatter plot in a variable
p <- ggplot(cars, aes(x = speed, y = dist)) +
  geom_point()

# Plot the scatter plot with marginal histograms
ggMarginal(p, type = "histogram")
Histogram only on the horizontal axis
The margins argument can be used to set only one of the marginal histograms, as the X-axis histogram.
# install.packages("ggplot2")
# install.packages("ggExtra")
library(ggplot2)
library(ggExtra)

# Save the scatter plot in a variable
p <- ggplot(cars, aes(x = speed, y = dist)) +
  geom_point()

# Horizontal marginal histogram
ggMarginal(p, type = "histogram",
           margins = "x")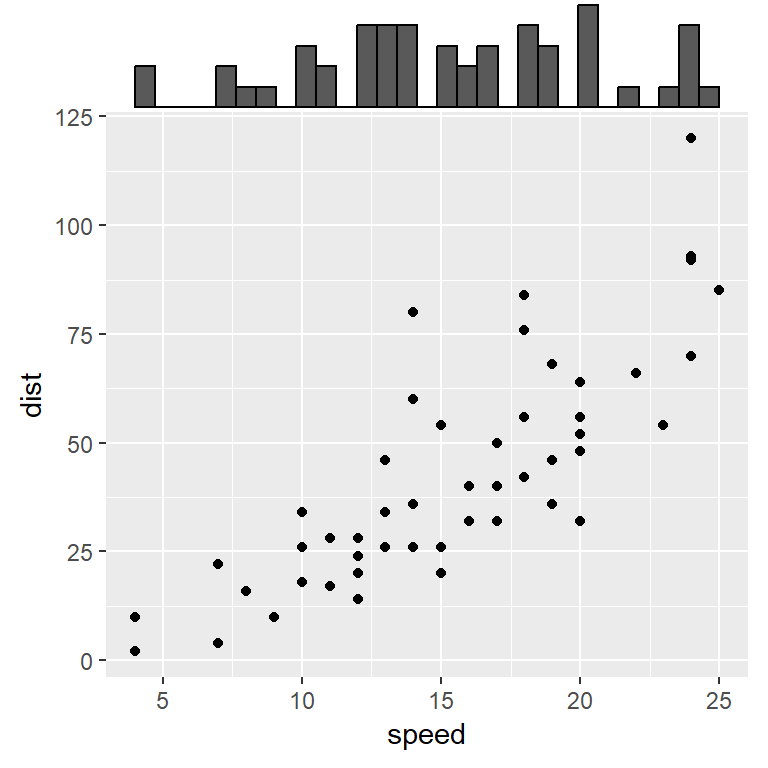
Histogram only on the vertical axis
If you prefer showing only the Y-axis histogram set margins = "y".
# install.packages("ggplot2")
# install.packages("ggExtra")
library(ggplot2)
library(ggExtra)

# Save the scatter plot in a variable
p <- ggplot(cars, aes(x = speed, y = dist)) +
  geom_point()

# Vertical marginal histogram
ggMarginal(p, type = "histogram",
           margins = "y")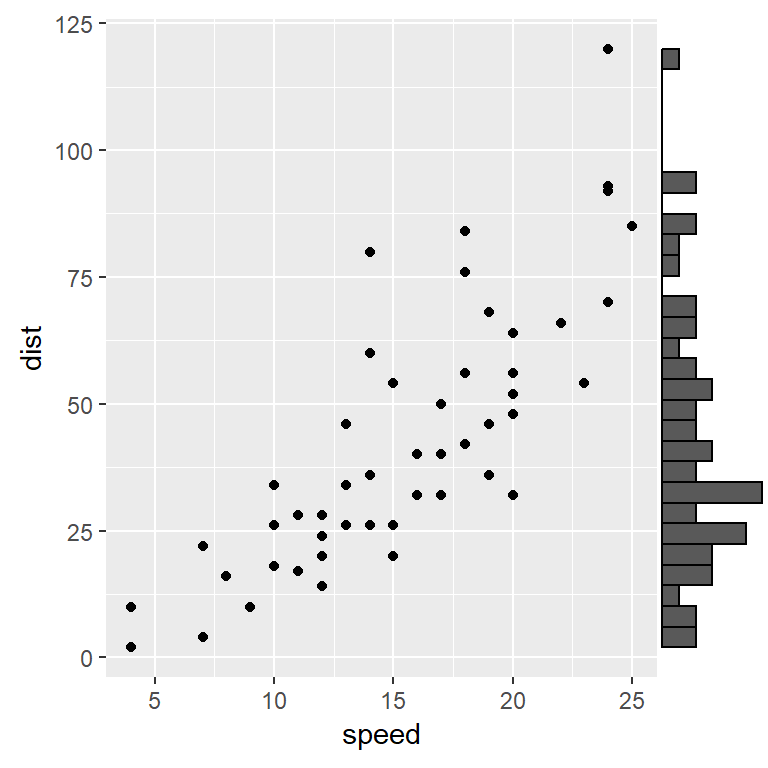
Relative size
The size argument modifies the relative size between the histogram and the scatter plot. The default value is 5 (scatter plot 5 times bigger than the histograms).
# install.packages("ggplot2")
# install.packages("ggExtra")
library(ggplot2)
library(ggExtra)

# Save the scatter plot in a variable
p <- ggplot(cars, aes(x = speed, y = dist)) +
  geom_point()

# Changing the relative size
ggMarginal(p, type = "histogram",
           size = 3)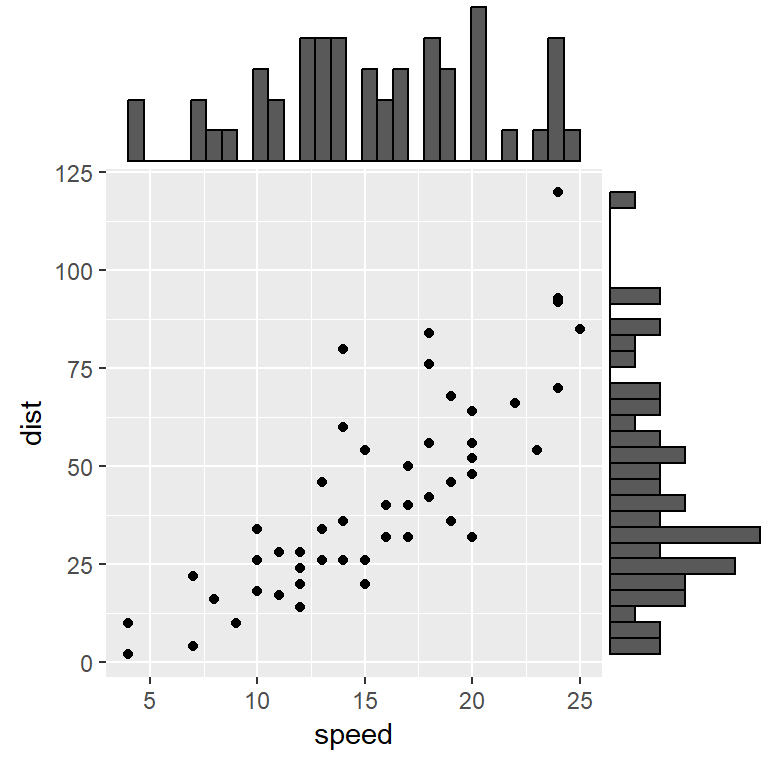
Arguments to be passed to geom_boxplot
You can pass the arguments of geom_boxplot to the function. If you want to set arguments for each histogram pass lists to xparams and yparams.
# install.packages("ggplot2")
# install.packages("ggExtra")
library(ggplot2)
library(ggExtra)

# Save the scatter plot in a variable
p <- ggplot(cars, aes(x = speed, y = dist)) +
  geom_point()

# Bin width customization
ggMarginal(p, type = "histogram",
           binwidth = 4)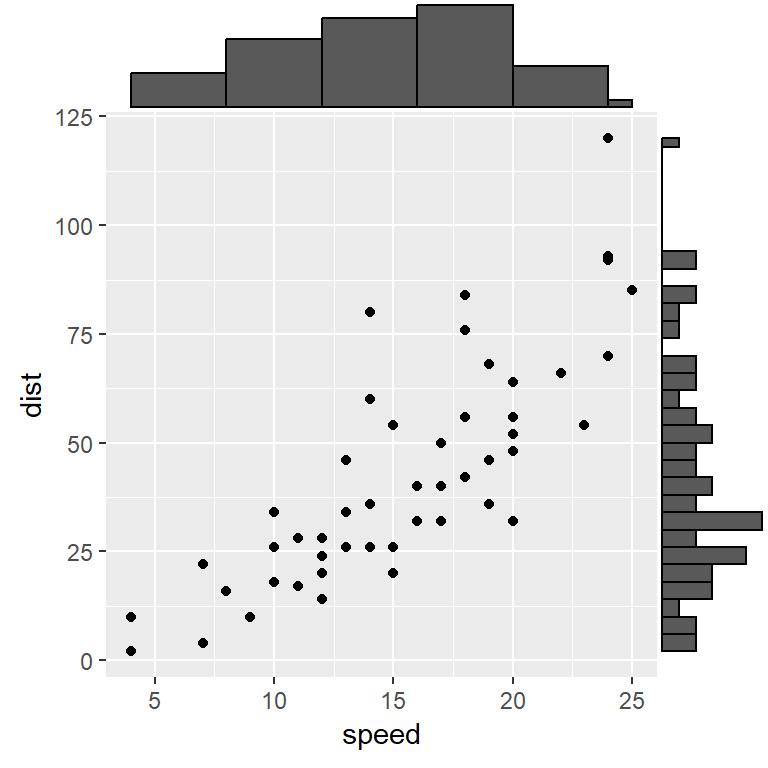
Histogram with density lines
If you want to overlay density lines to the histograms set type = "densigram".
# install.packages("ggplot2")
# install.packages("ggExtra")
library(ggplot2)
library(ggExtra)

# Save the scatter plot in a variable
p <- ggplot(cars, aes(x = speed, y = dist)) +
  geom_point()

# Densigram
ggMarginal(p, type = "densigram")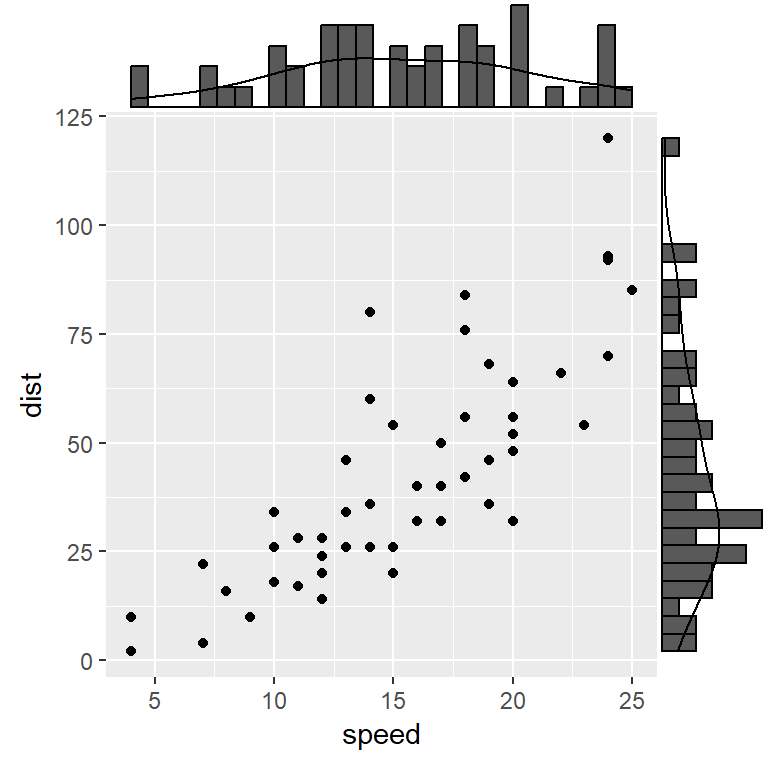
Color customization

Fill color
Change the fill color of the histograms with fill.
# install.packages("ggplot2")
# install.packages("ggExtra")
library(ggplot2)
library(ggExtra)

# Save the scatter plot in a variable
p <- ggplot(cars, aes(x = speed, y = dist)) +
  geom_point()

# Changing the fill color
ggMarginal(p, type = "histogram",
           fill = 4)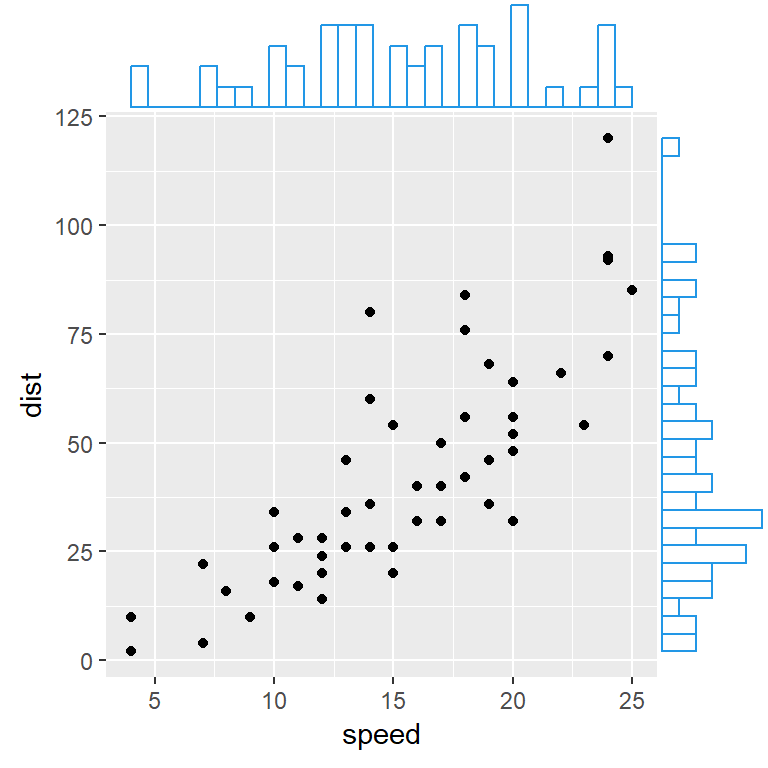
Border color
You can also customize the border color with col argument.
# install.packages("ggplot2")
# install.packages("ggExtra")
library(ggplot2)
library(ggExtra)

# Save the scatter plot in a variable
p <- ggplot(cars, aes(x = speed, y = dist)) +
  geom_point()

# Fill and border color of the marginal histograms
ggMarginal(p, type = "histogram",
           fill = "white",
           col = 4)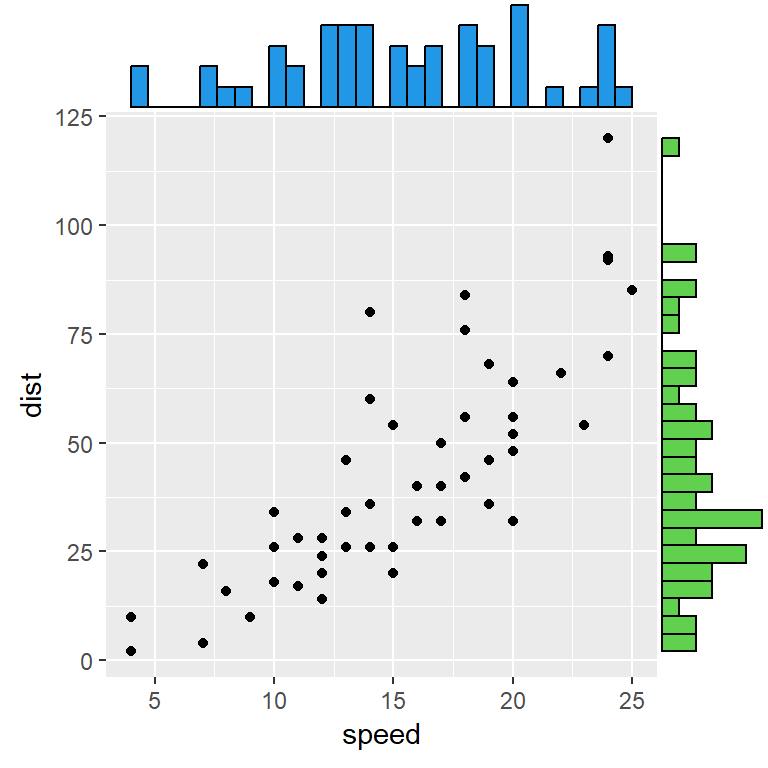
Arguments for each histogram
If you want more customization, pass a list or arguments for each axis with xparams and yparams.
# install.packages("ggplot2")
# install.packages("ggExtra")
library(ggplot2)
library(ggExtra)

# Save the scatter plot in a variable
p <- ggplot(cars, aes(x = speed, y = dist)) +
  geom_point()

# Arguments for each marginal histogram
ggMarginal(p, type = "histogram",
           xparams = list(fill = 4),
           yparams = list(fill = 3))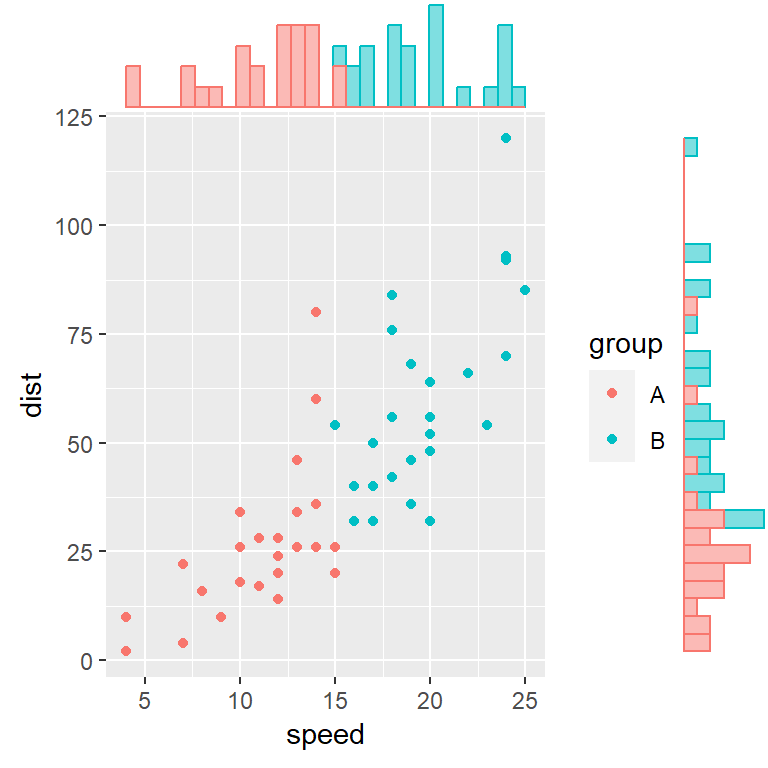
Histograms by group
Finally, if your data set contains a grouping variable you can fill the marginal histograms by group.
# install.packages("ggplot2")
# install.packages("ggExtra")
library(ggplot2)
library(ggExtra)

# Sample grouping variable
cars$group <- c(rep("A", 25), rep("B", 25))

# Save the scatter plot in a variable
p <- ggplot(cars, aes(x = speed, y = dist, color = group)) +
  geom_point()

# Marginal histograms by group
ggMarginal(p, type = "histogram",
           groupColour = TRUE,
           groupFill = TRUE)
Master Statistics
Learn statistics from the basics to advanced techniques, clearly explained
Go to site