smoothScatter function
Creating a smooth scatter plot in base R is straightforward with smoothScatter function. You just need to pass your vectors to the function and a smoothed version of its scatter plot will be created.
# Data
set.seed(9)
x <- rnorm(1000)
y <- rnorm(1000)

# Smooth scatter plot
smoothScatter(y ~ x)

# Equivalent to:
smoothScatter(x, y)
You might have noticed that some points are displayed on the graph, which are points from those areas of lowest regional densities. These points are useful for outlier identification. The number of points can be customized with nrpoints.
# Data
set.seed(9)
x <- rnorm(1000)
y <- rnorm(1000)

# Smooth scatter plot
smoothScatter(y ~ x,
              nrpoints = 1000)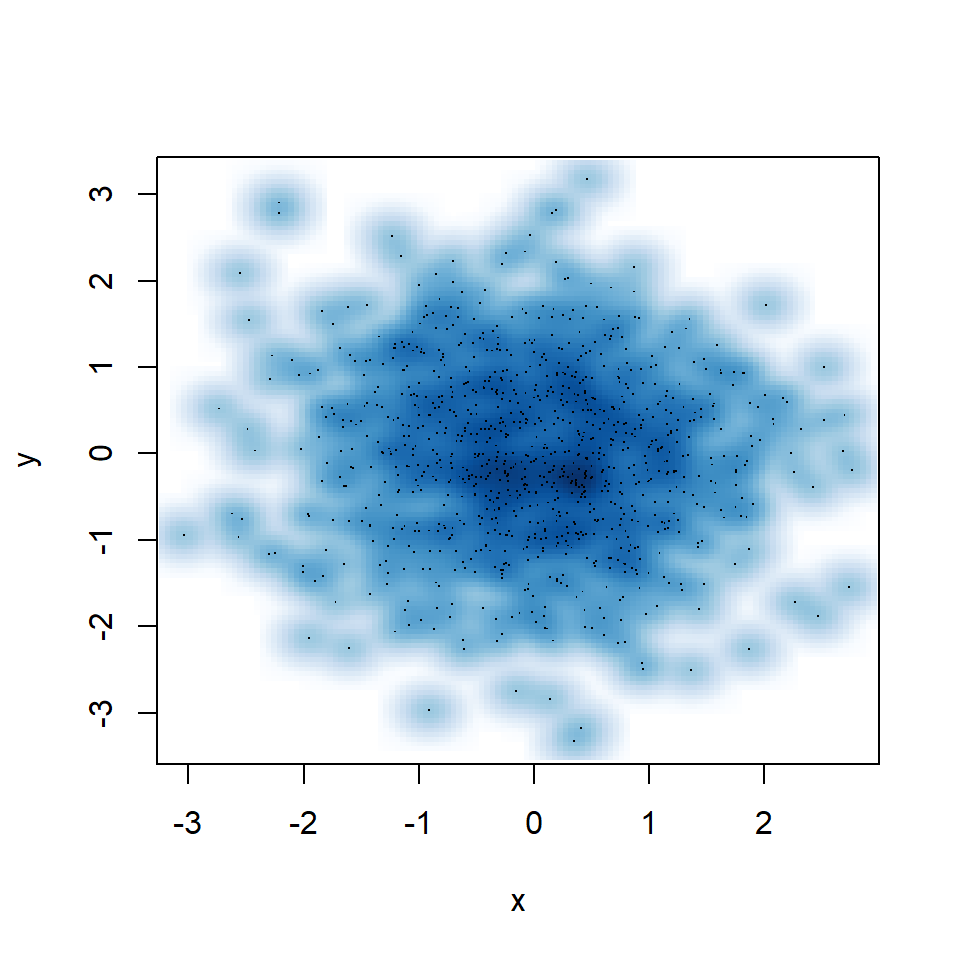
In addition, the pch symbol and its color can be customized with pch and col arguments.
# Data
set.seed(9)
x <- rnorm(1000)
y <- rnorm(1000)

# Smooth scatter plot
smoothScatter(y ~ x,
              pch = 10, col = "red")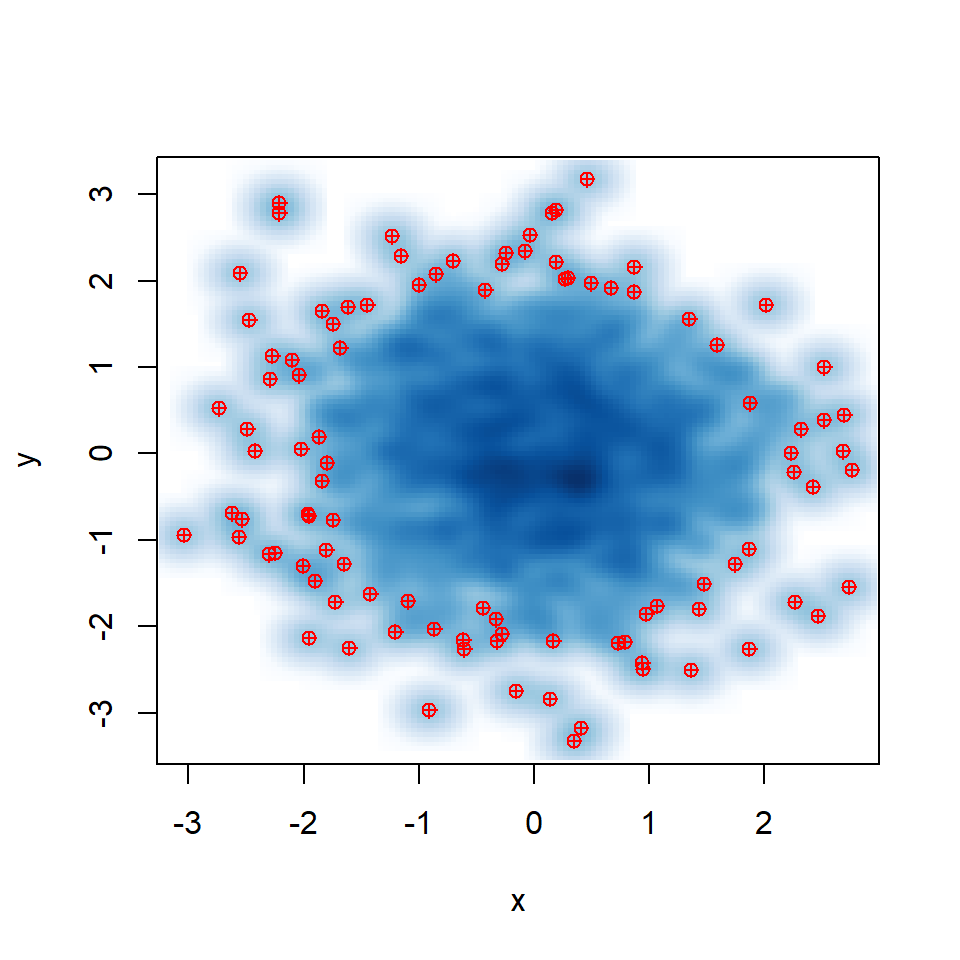
Smooth scatter bandwidth
The smoothScatter function depends on bkde2D function from package KernSmooth to perform the two-dimensional kernel density estimate. However, you can also set a custom smoothing bandwidth with bandwidth argument.
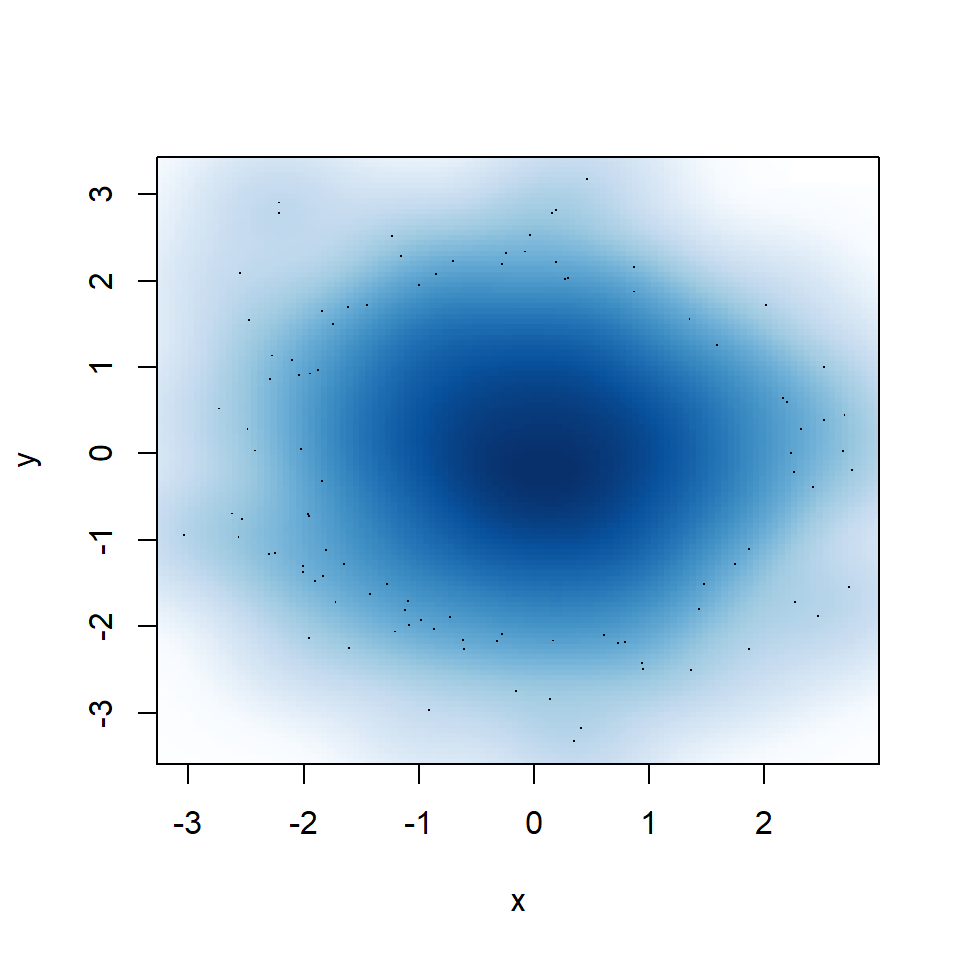
Big bandwidth
If you select a too big bandwidth the estimation will be oversmoothed.
# Data
set.seed(9)
x <- rnorm(1000)
y <- rnorm(1000)

# Smooth scatter plot
smoothScatter(y ~ x,
              bandwidth = 0.4) # Big bandwidth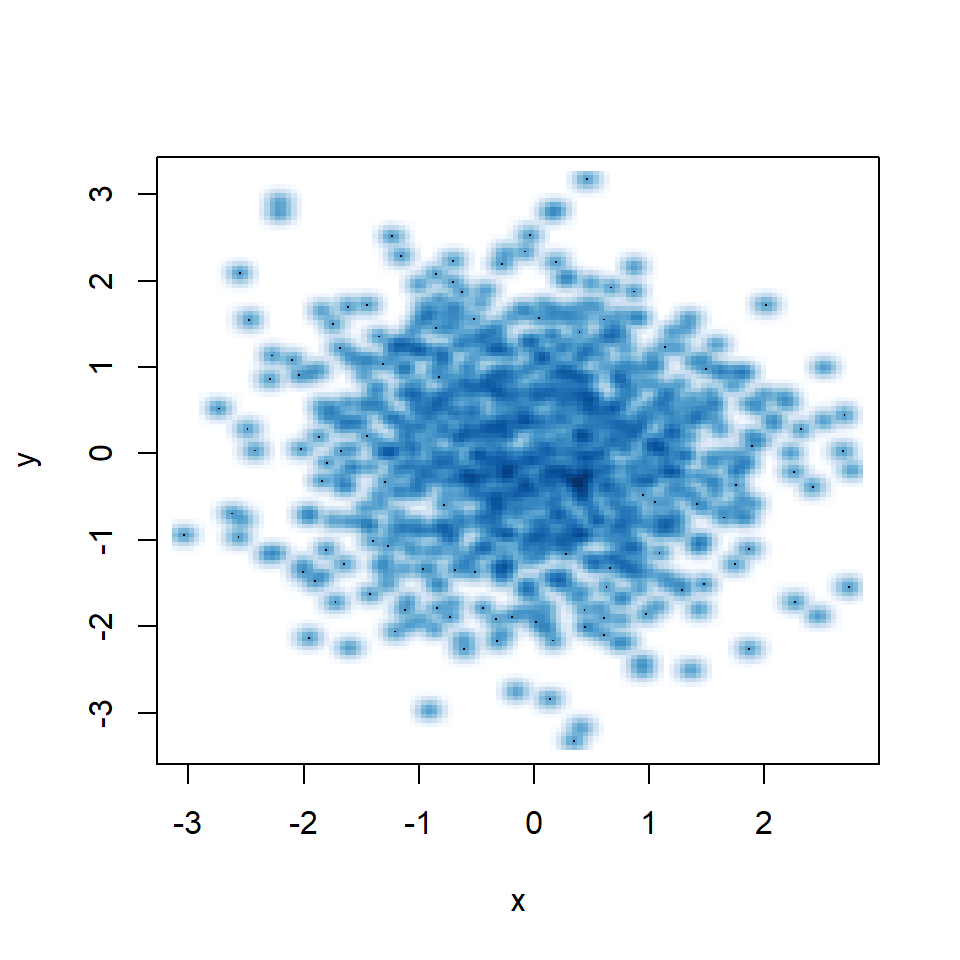
Small bandwidth
A small bandwidth will group the data too much, so the kernel density estimation won’t be smooth.
# Data
set.seed(9)
x <- rnorm(1000)
y <- rnorm(1000)

# Smooth scatter plot
smoothScatter(y ~ x,
              bandwidth = 0.05) # Small bandwidth
Smooth scatter color
The function uses the blues9 color palette, but you can choose your own specifying a color ramp palette as in the following example. See our color palettes list for inspiration.
# Data
set.seed(9)
x <- rnorm(1000)
y <- rnorm(1000)

palette <- hcl.colors(30, palette = "inferno")

# Smooth scatter plot
smoothScatter(y ~ x,
              colramp = colorRampPalette(palette))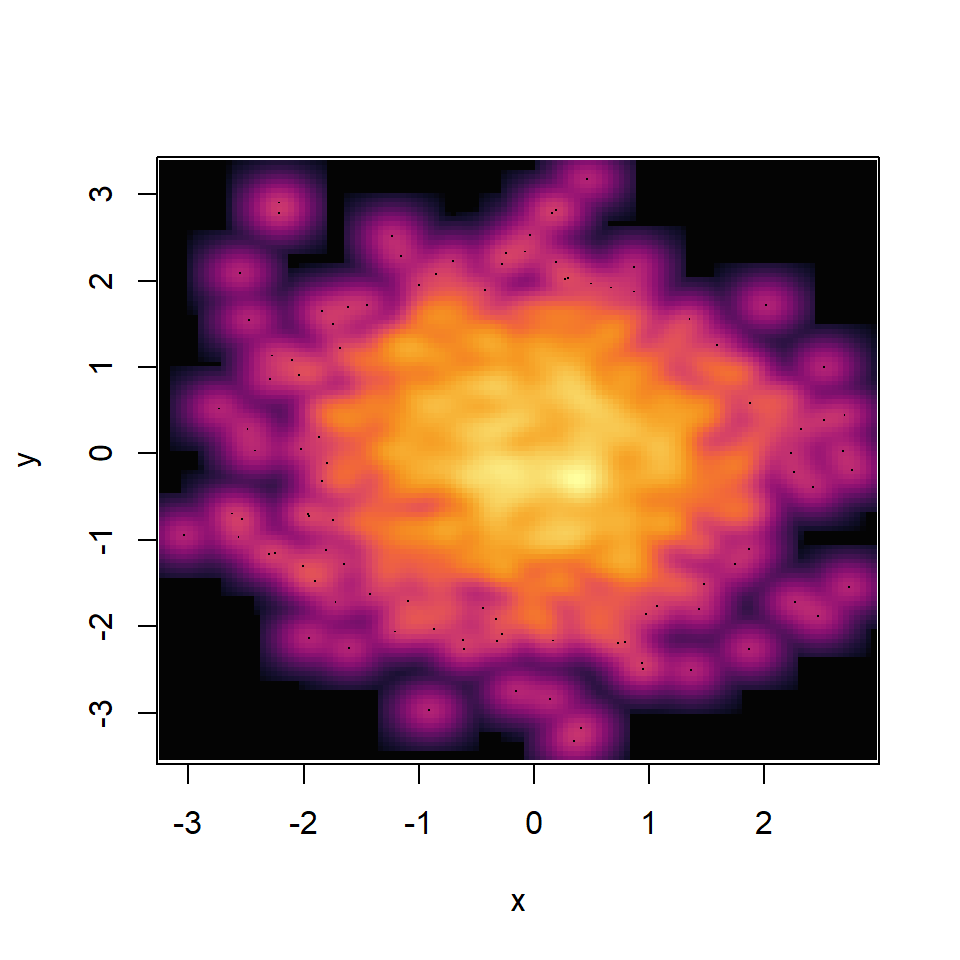

Master Statistics
Learn statistics from the basics to advanced techniques, clearly explained
Go to site