The contour function
Given a matrix, and optionally the grid of X-axis and Y-axis values, it is possible to create a contour plot in R with the contour function.
# Data
x <- -10:10
y <- -10:10
z <- sqrt(outer(x ^ 2, y ^ 2, "+"))

contour(x, y, z)

# You can also type, the following
# but the axes will be between 0 and 1
contour(z)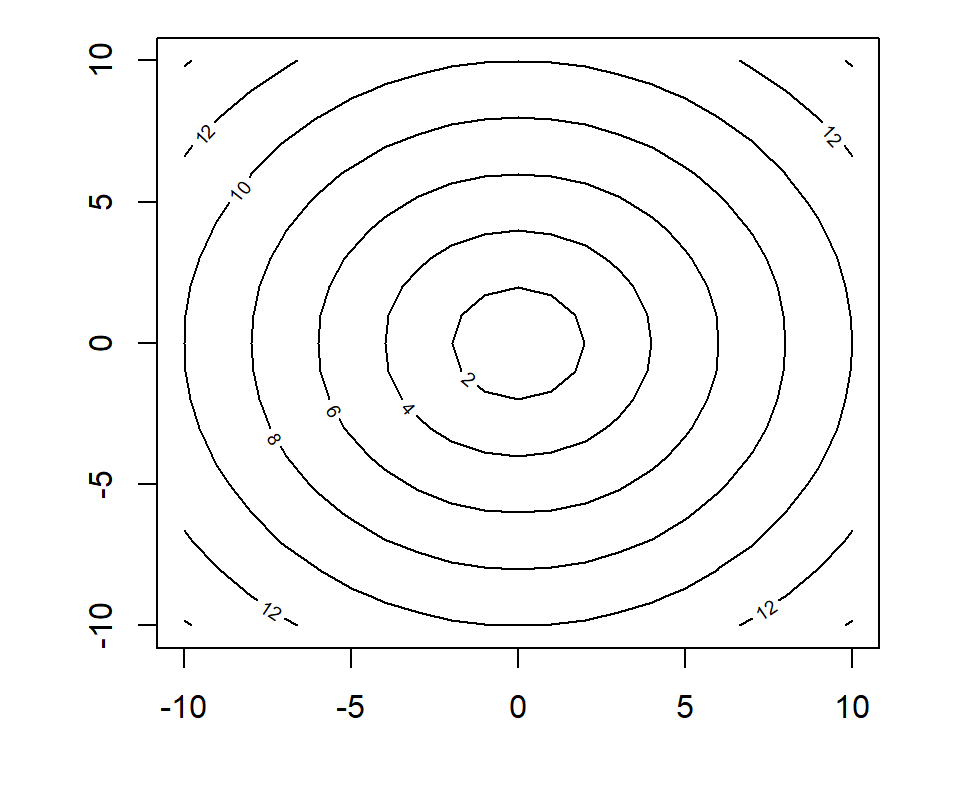
Number of levels
The nlevels argument controls the number of contour levels to be drawn. The default value is 10.
# Data
x <- -10:10
y <- -10:10
z <- sqrt(outer(x ^ 2, y ^ 2, "+"))

contour(x, y, z,
nlevels = 20) 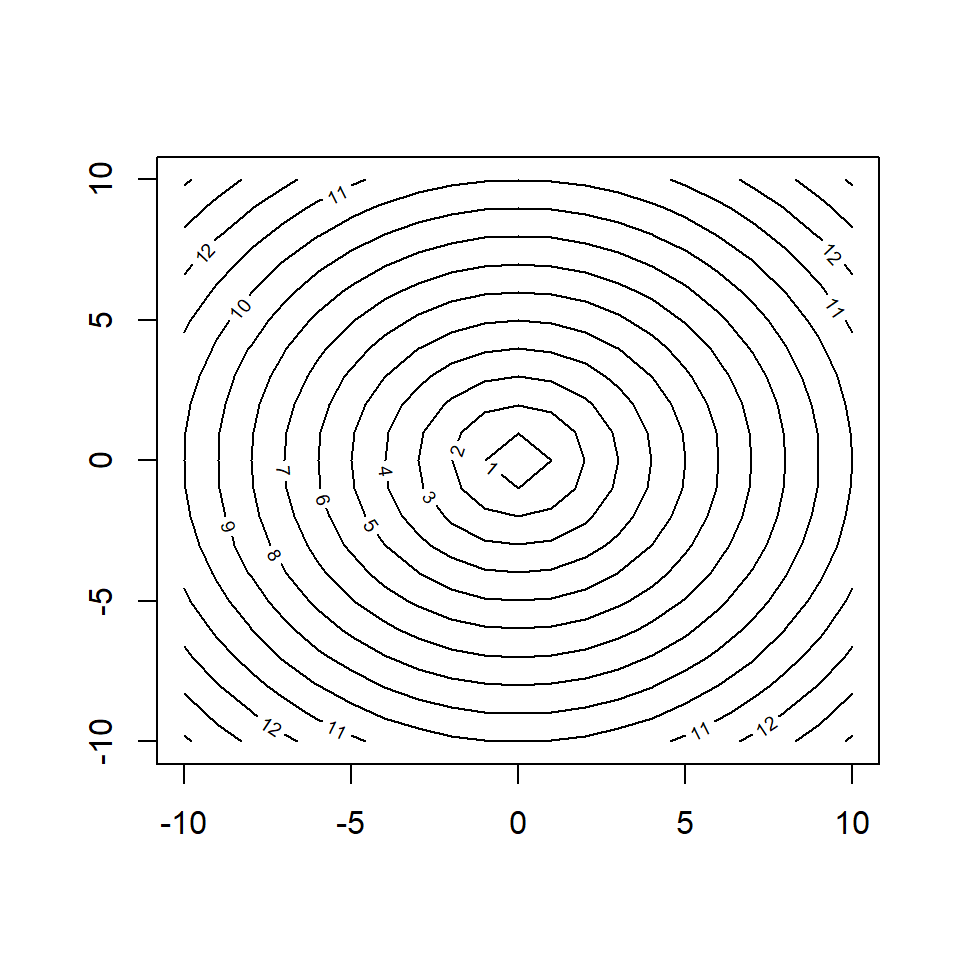
Contour lines
Note that you can change the line width and line style of the contours with lwd and lty, respectively, as well as the size for contour labels with labcex, change the labels with labels or remove them setting drawlabels = FALSE.
# Data
x <- -10:10
y <- -10:10
z <- sqrt(outer(x ^ 2, y ^ 2, "+"))

contour(x, y, z,
        labcex = 1.2, labels = 1:10,
lwd = 2, lty = 1) 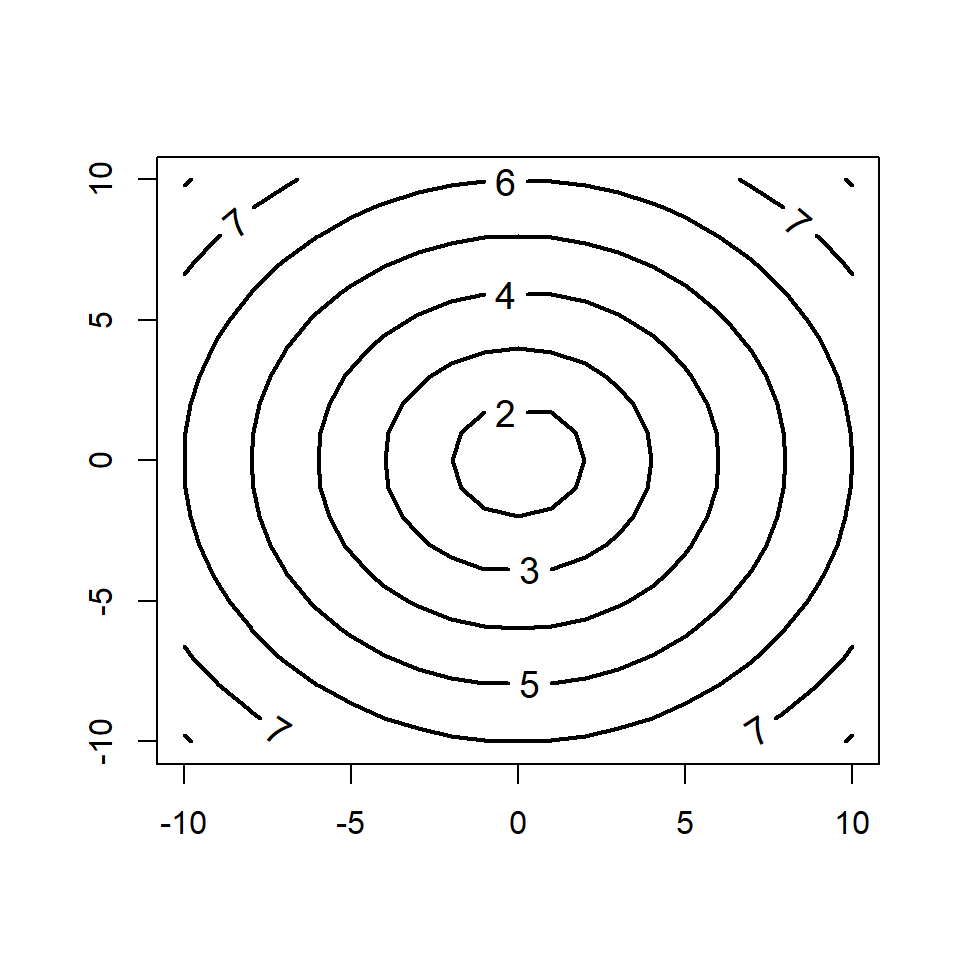
Color palette
You can change the color of the contour lines with col, passing a color or a color palette, such in the example below, which draws contours for the volcano data set.
# Color palette
cols <- hcl.colors(10, "YlOrRd")

contour(volcano,
        col = cols)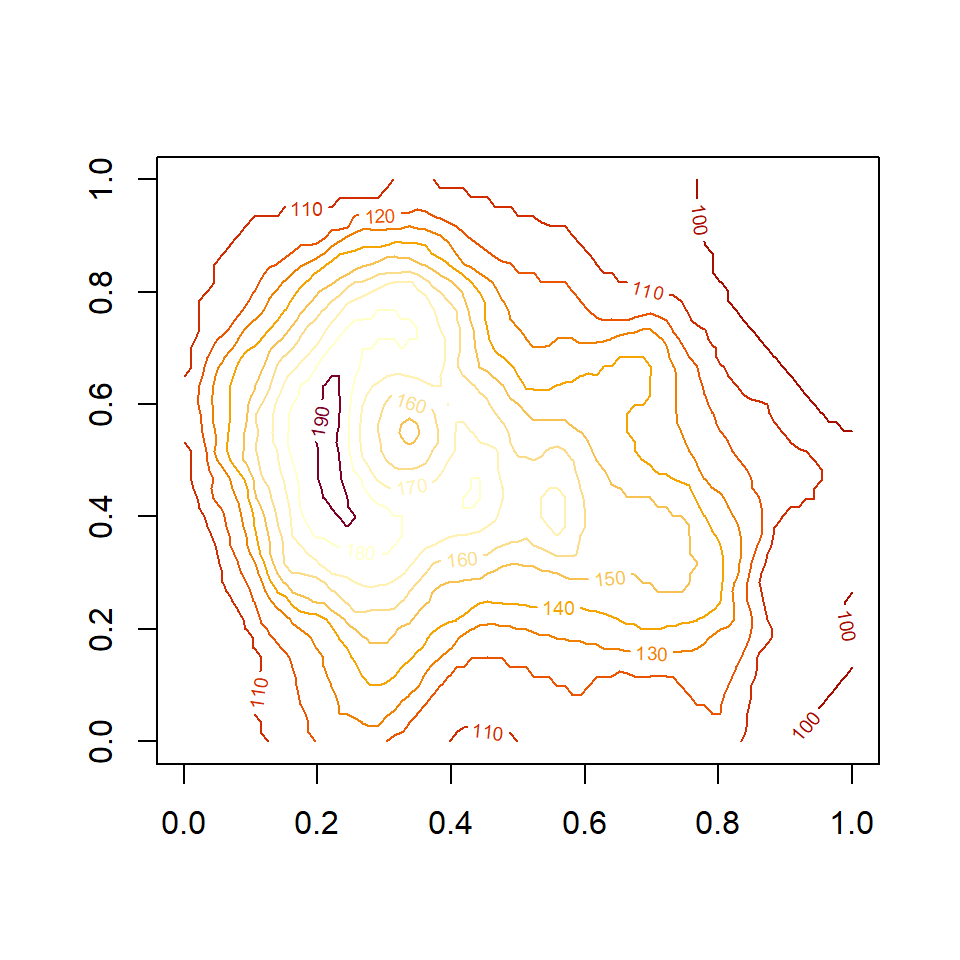
Overlay contour over a scatter plot
If you want to overlay contour lines over a scatter plot you can use the kde2d function from MASS to calculate the kernel density estimate of the variables as shown in the example below. Recall to set add = TRUE inside contour.
# install.packages("MASS")
library(MASS)

# Data
x <- rnorm(500)
y <- rnorm(500)
z <- kde2d(x, y, n = 50)

plot(x, y, pch = 19)
contour(z, lwd = 2, add = TRUE,
        col = hcl.colors(10, "Spectral"))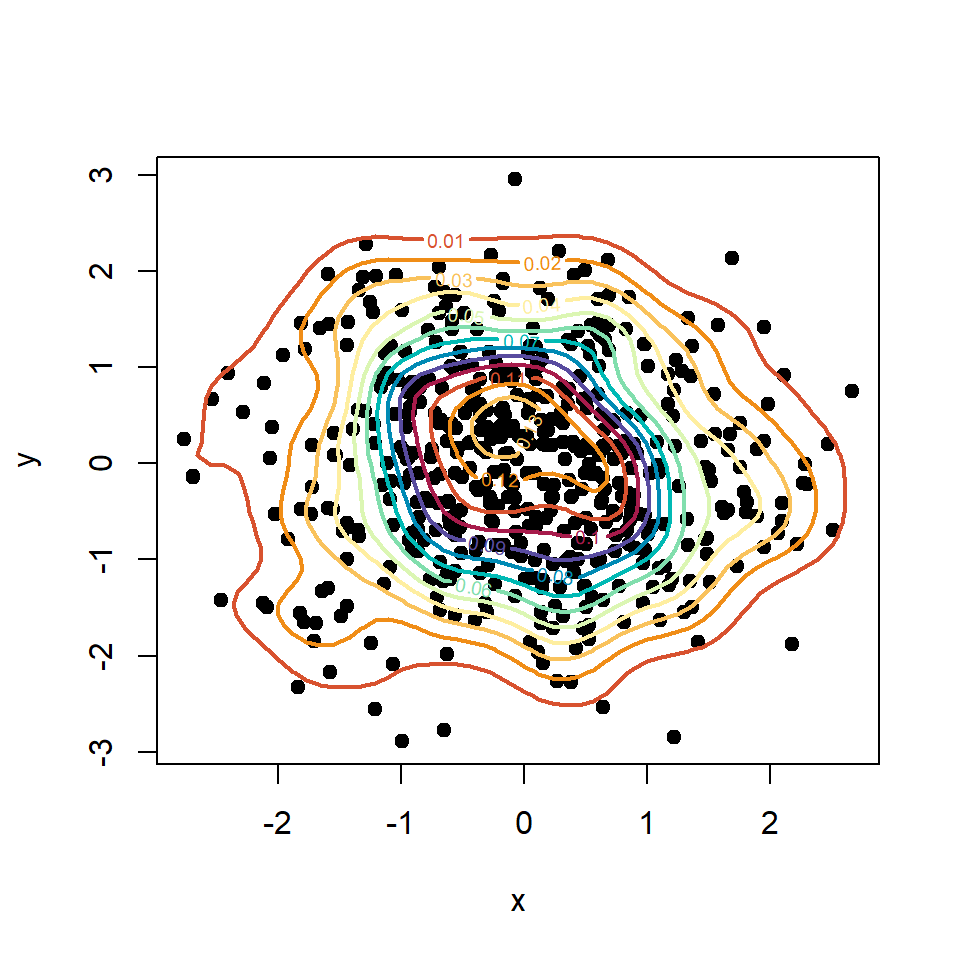
The filled.contour function
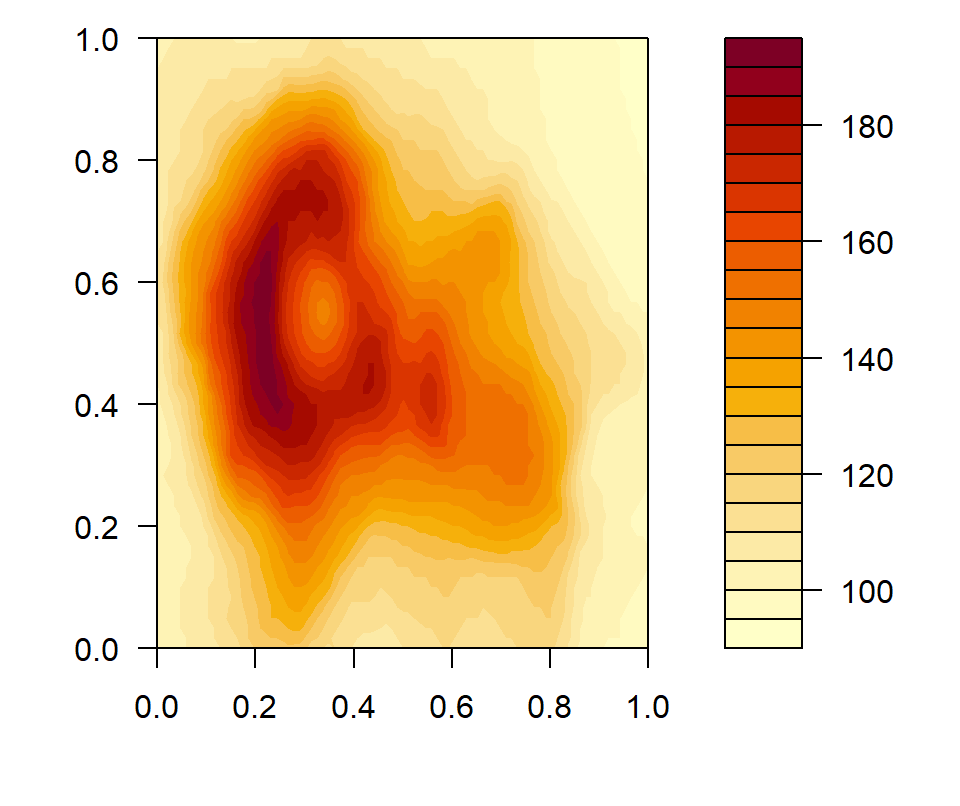
A similar function to contour is filled.contour, which fills the areas between the contour lines. The function behaves almost the same as the function from the previous section.
filled.contour(volcano)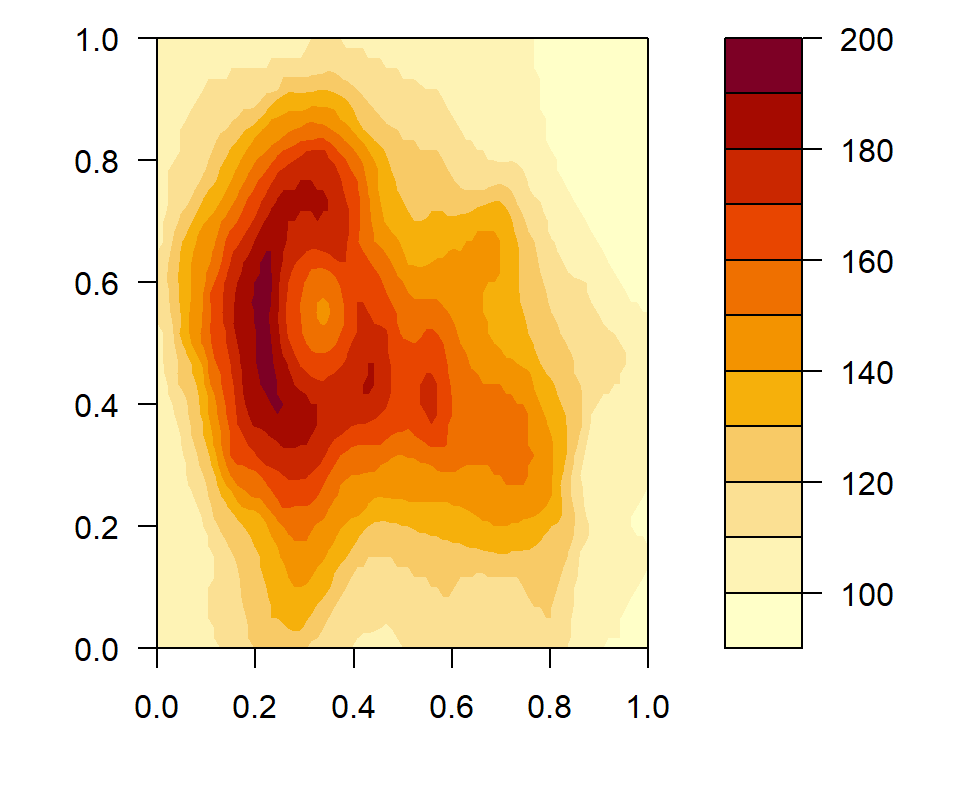
Number of levels
In this function you can also specify the number of levels with nlevels.
filled.contour(volcano,
               nlevels = 10)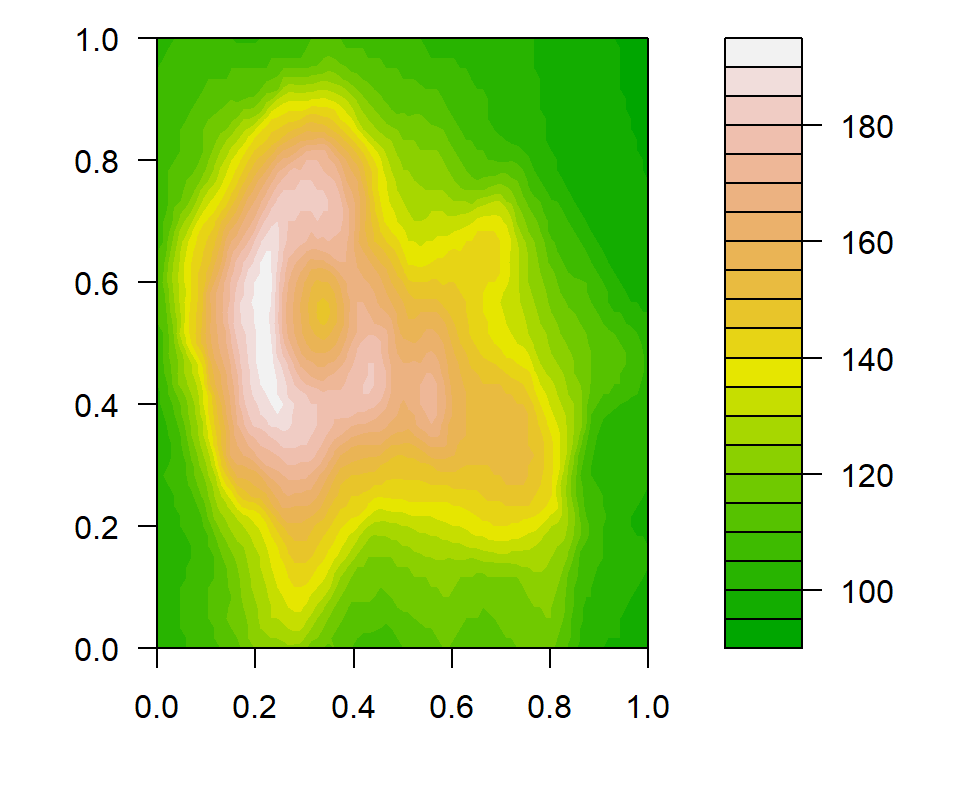
Color palette
The color palette can be set with color.palette or specifying a vector of colors with col.
filled.contour(volcano,
               color.palette = terrain.colors)
Filled contour with lines
The plot.axes function can be used to add a contour over the filled contour plot, as shown in the following example.
filled.contour(volcano, plot.axes = {
  axis(1)
  axis(2)
  contour(volcano, add = TRUE, lwd = 2)
  }
)
Master Statistics
Learn statistics from the basics to advanced techniques, clearly explained
Go to site