Zoom in
Given two vectors of the same length it is possible to create a scatter plot with the plot function as in the example below.
# Data
set.seed(1)
x <- runif(400)
y <- runif(400)

# Scatter plot
plot(x, y)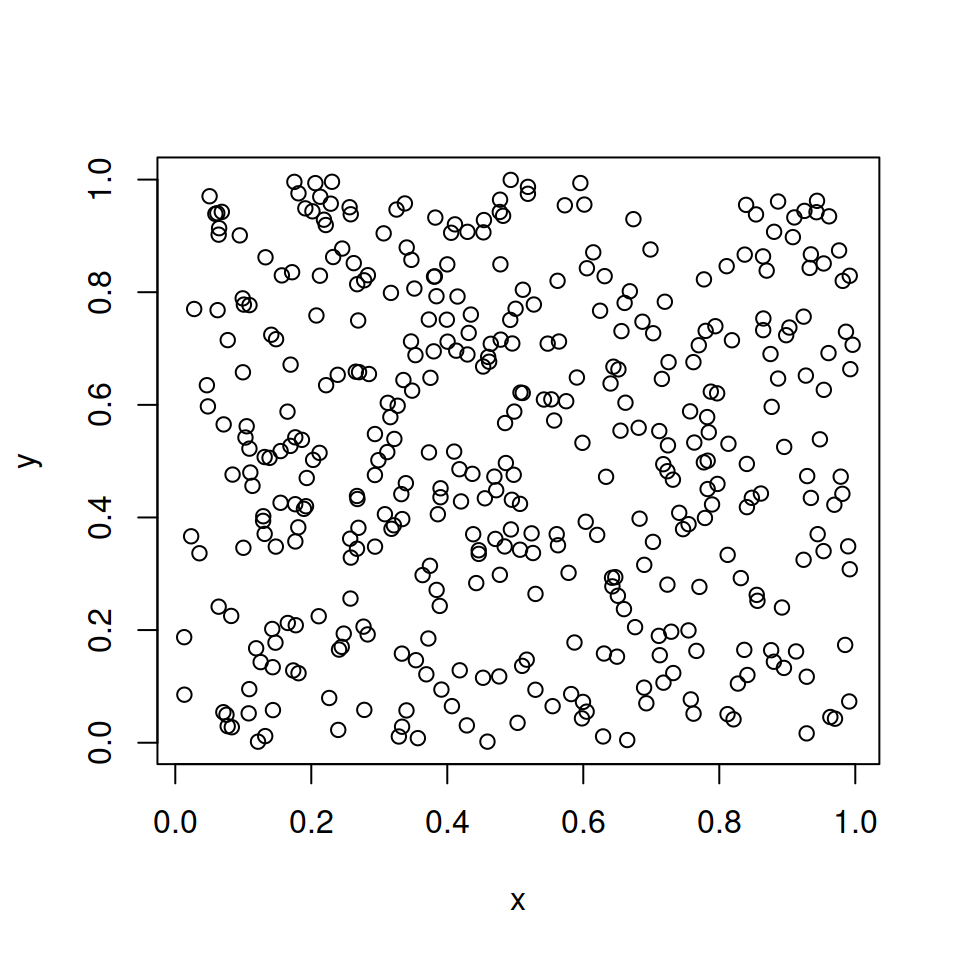
If you want to zoom in an specific area you can make use of the zoomInPlot function from plotrix package. This function will highlight the corresponding area in the chart and create a new plot out of the first with the zoomed data. You just need to specify the X-axis and Y-axis limits for the expanded plot with rxlim and rylim, respectively.
# install.packages("plotrix")
library(plotrix)

# Data
set.seed(1)
x <- runif(400)
y <- runif(400)

# Scatter plot with zoom
zoomInPlot(x, y,                # Data
           rxlim = c(0.6, 0.8), # X-axis limits
           rylim = c(0.4, 0.6)) # Y-axis limits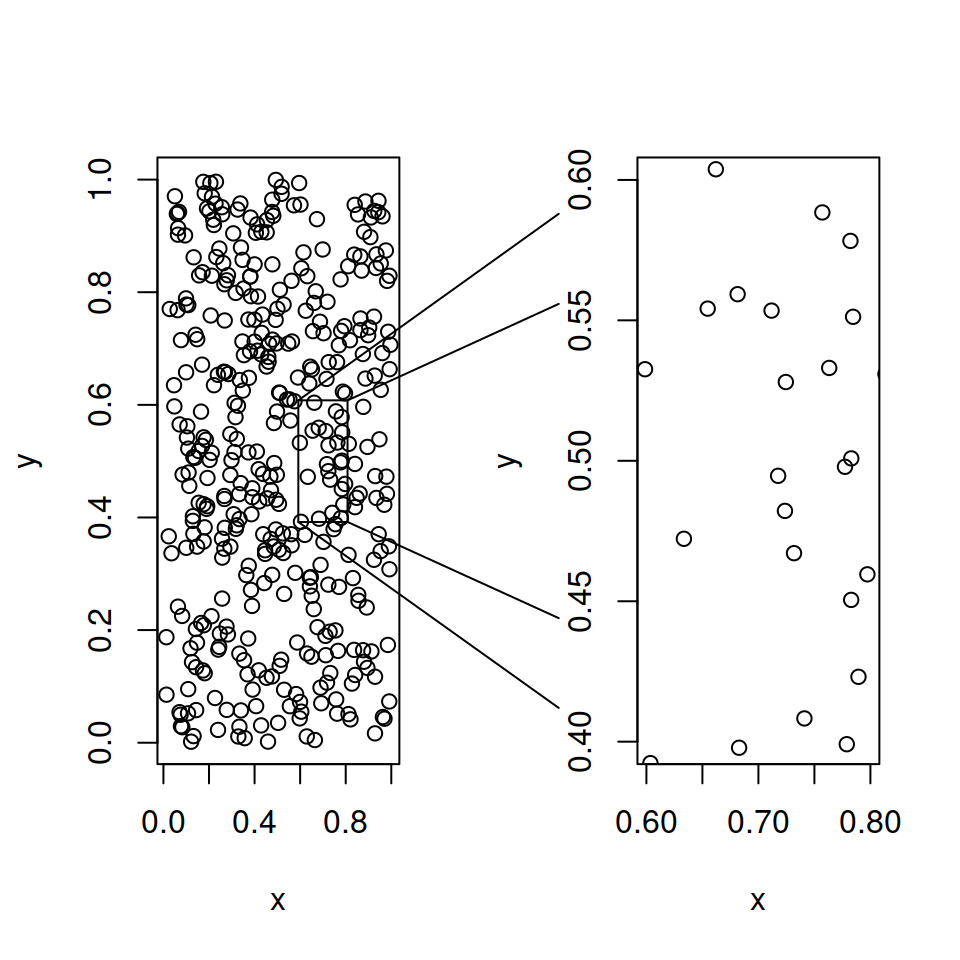
Note that the proportions of the plots depend on the device size. If you increase the size of your plot or if you modify the margins it is possible to get squared plots as in the first figure.
Color customization
You can also change the symbol of the plots, its color and specify other additional arguments of the plot function inside zoomInPlot. In addition, there is an argument named zoomtitle which can be used to set a title for the zoomed plot.
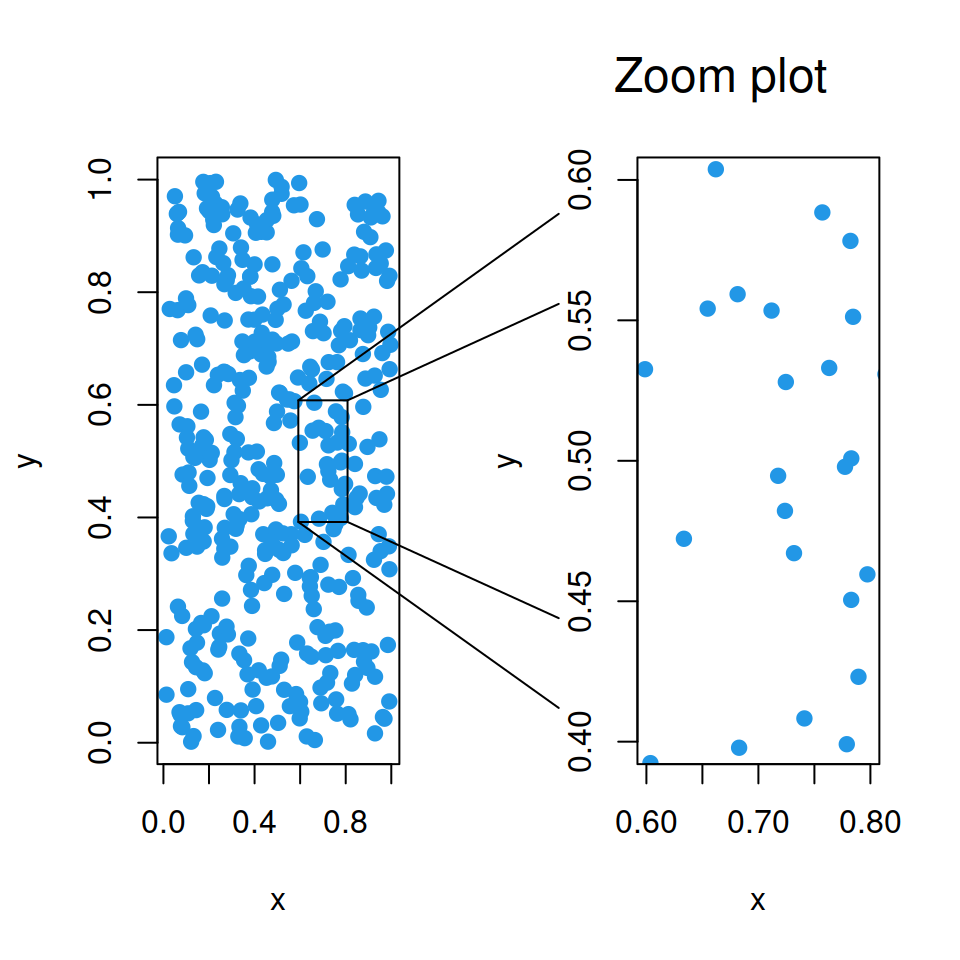
# install.packages("plotrix")
library(plotrix)

# Data
set.seed(1)
x <- runif(400)
y <- runif(400)

# Scatter plot with zoom
zoomInPlot(x, y,                    # Data
           pch = 19,                # Symbol
           col = 4,                 # Color
           zoomtitle = "Zoom plot", # Title
           rxlim = c(0.6, 0.8),
           rylim = c(0.4, 0.6))
Master Statistics
Learn statistics from the basics to advanced techniques, clearly explained
Go to site