The ggpairs function
The GGally provides a function named ggpairs which is the ggplot2 equivalent of the pairs function of base R. You can pass a data frame containing both continuous and categorical variables.
By default, the upper panel will show the correlation between the continuous variables, the lower the scatter plots of the continuous variables, the diagonal the density plots of the continuous variables, and the sides the histograms and box plots for the combinations between the categorical and the continuous variables.
# install.packages("GGally")
library(GGally)

ggpairs(iris) 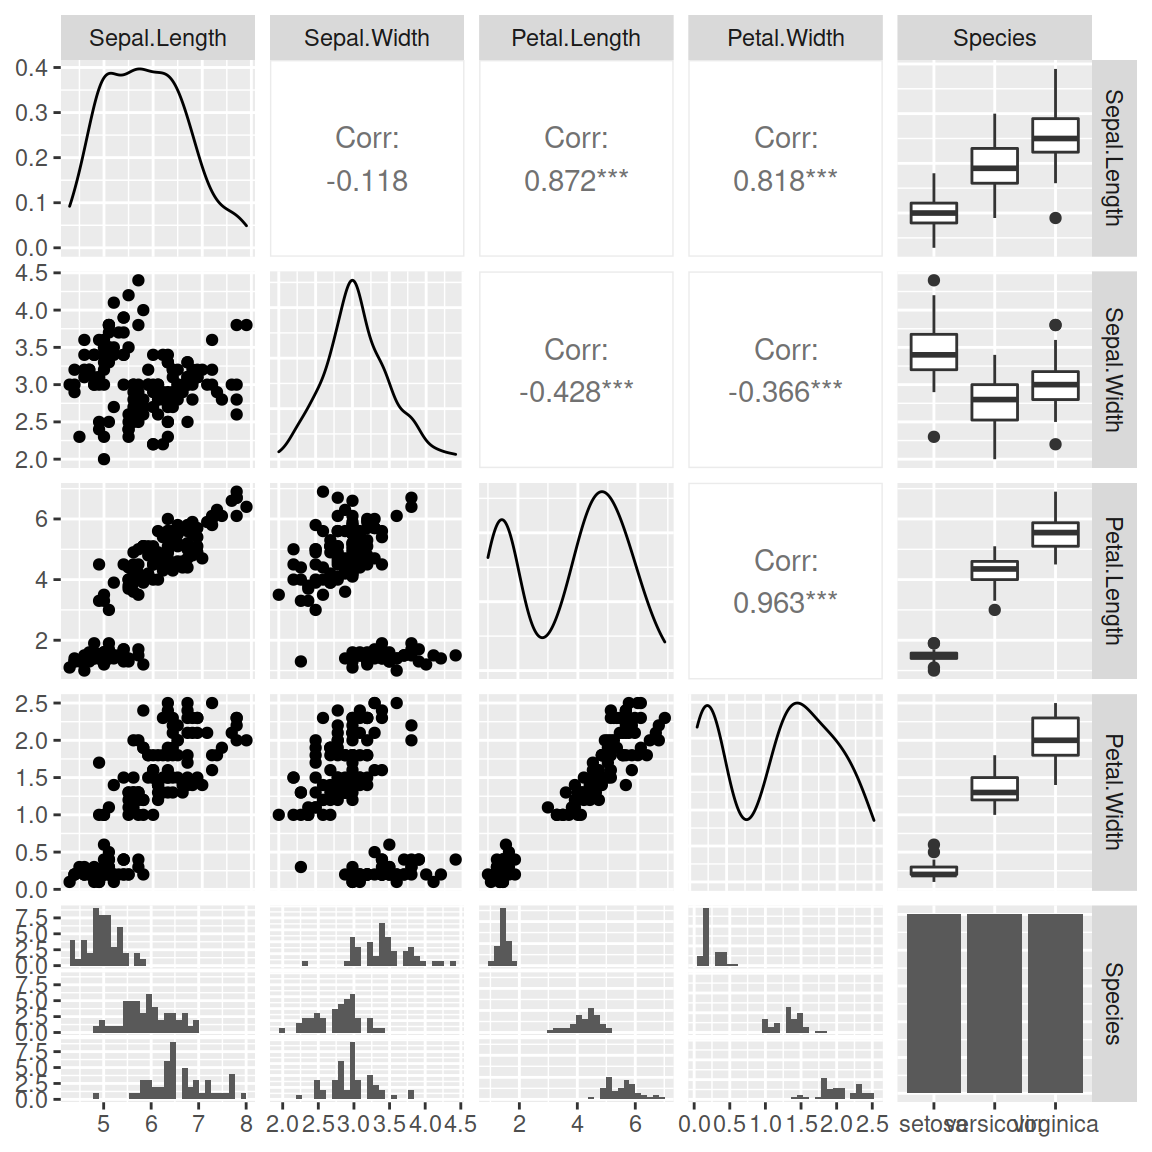
Column selection
The columns argument can be used to select the columns of the data frame to be plotted. You can specify a numerical or a character vector containing the names of the variables. In the following example we are removing the categorical variable of the data set.
# install.packages("GGally")
library(GGally)

ggpairs(iris,          # Data frame
        columns = 1:4) # Columns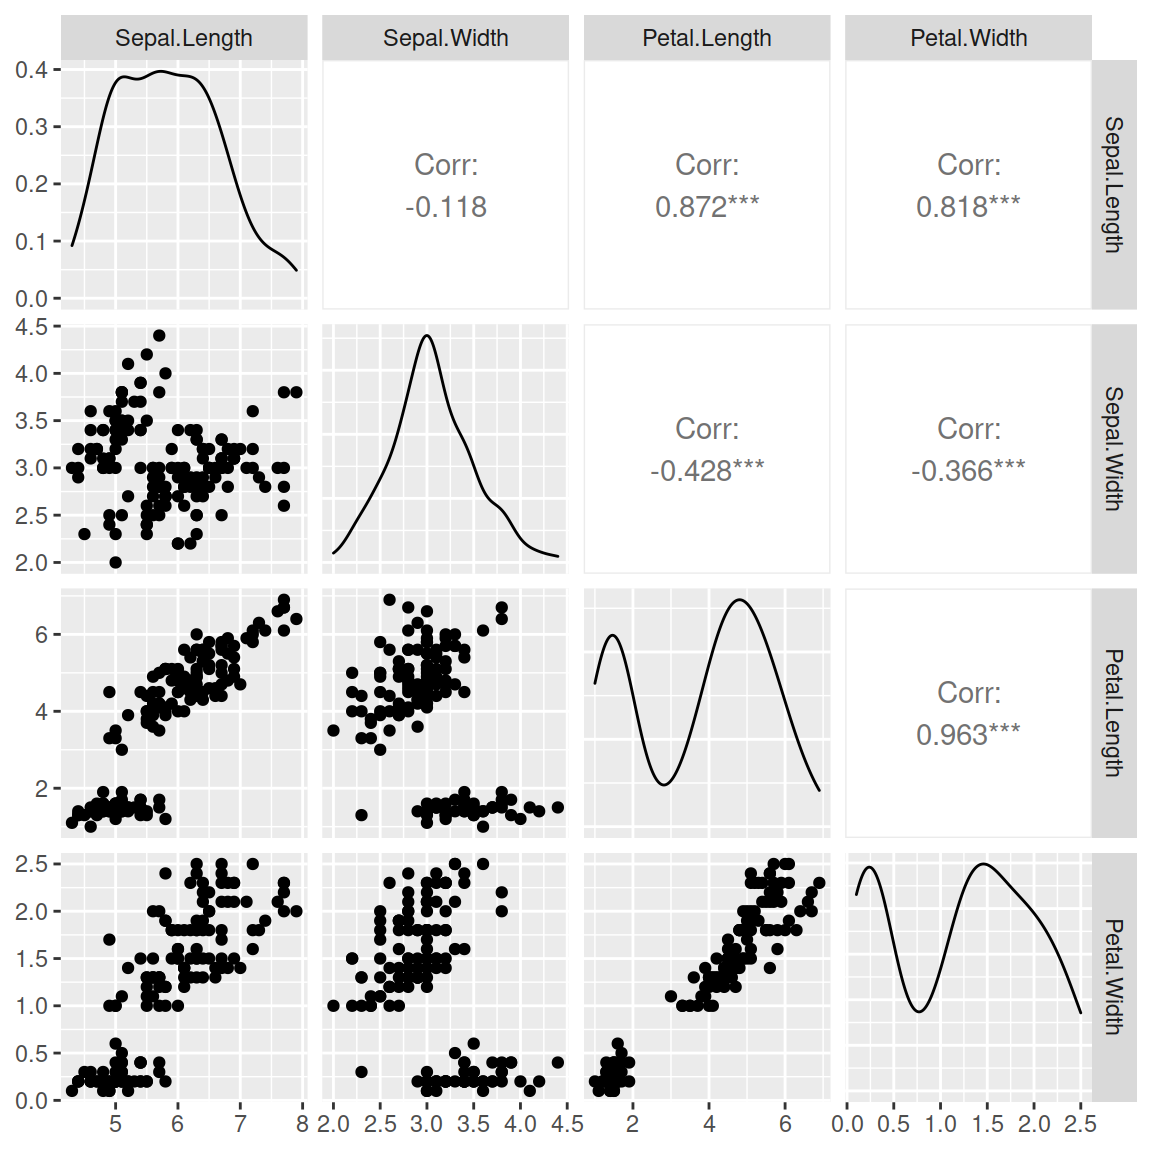
Color by group
You can set an aesthetic mapping with aes. This will allow you to create and fill the density plots, scatter plots and other plots with different colors based on the groups.
# install.packages("GGally")
library(GGally)

ggpairs(iris,                 # Data frame
        columns = 1:4,        # Columns
        aes(color = Species,  # Color by group (cat. variable)
            alpha = 0.5))     # Transparency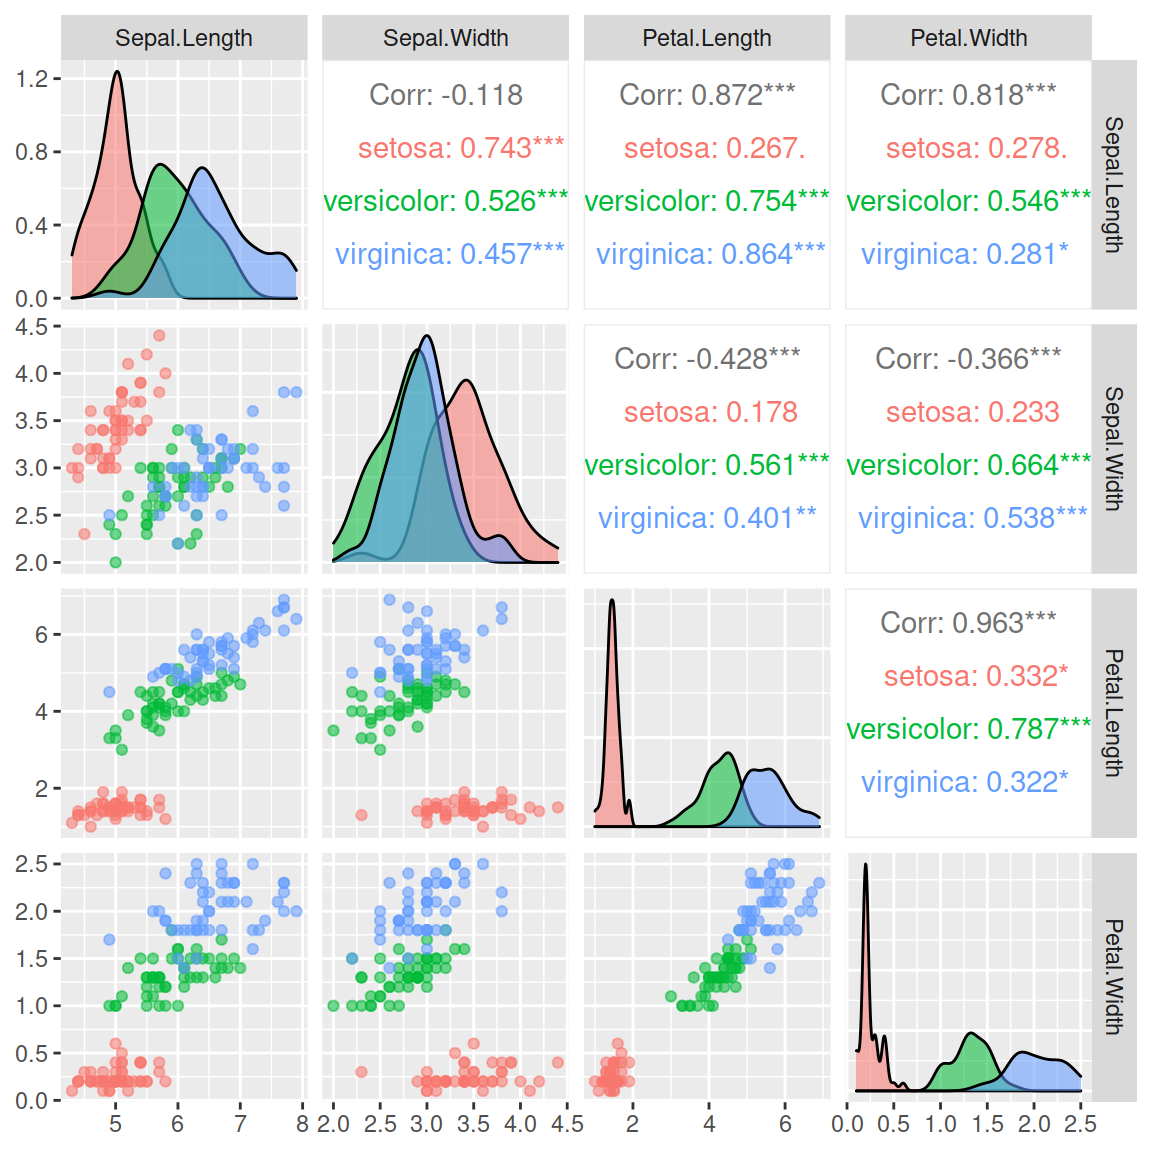
Font size
As you might have noticed, the correlation values doens’t fit on the upper panel. If you need to change the font size you can use the following line:
# install.packages("GGally")
library(GGally)

ggpairs(iris, columns = 1:4, aes(color = Species, alpha = 0.5),
        upper = list(continuous = wrap("cor", size = 2.5)))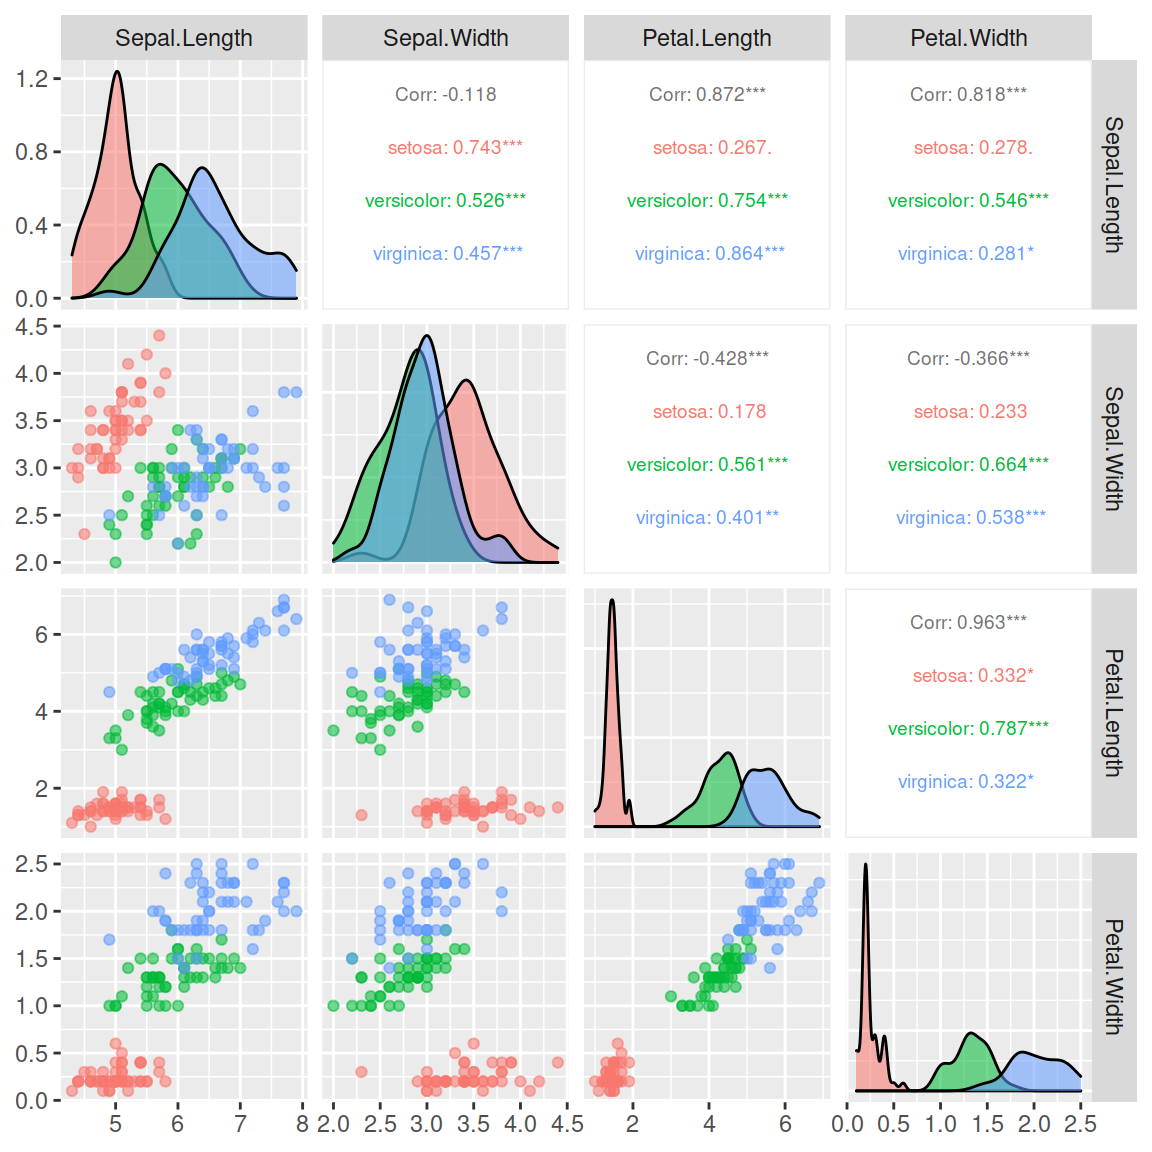
Upper, lower and diagonal panels
The upper, lower and diagonal panels are fully customizable with upper, lower and diag arguments. Each argument defaults to a list with several variables. You will need to look to the ending of ggally_() functions and pass them to the arguments as character.
Continuous variables

Upper panel
You can pass "points" to the continuous variable of the list of the upper argument to add scatter plots on the upper panel. This is because there exists a function named ggally_points.
# install.packages("GGally")
library(GGally)

ggpairs(iris, columns = 1:4, aes(color = Species, alpha = 0.5),
        upper = list(continuous = "points"))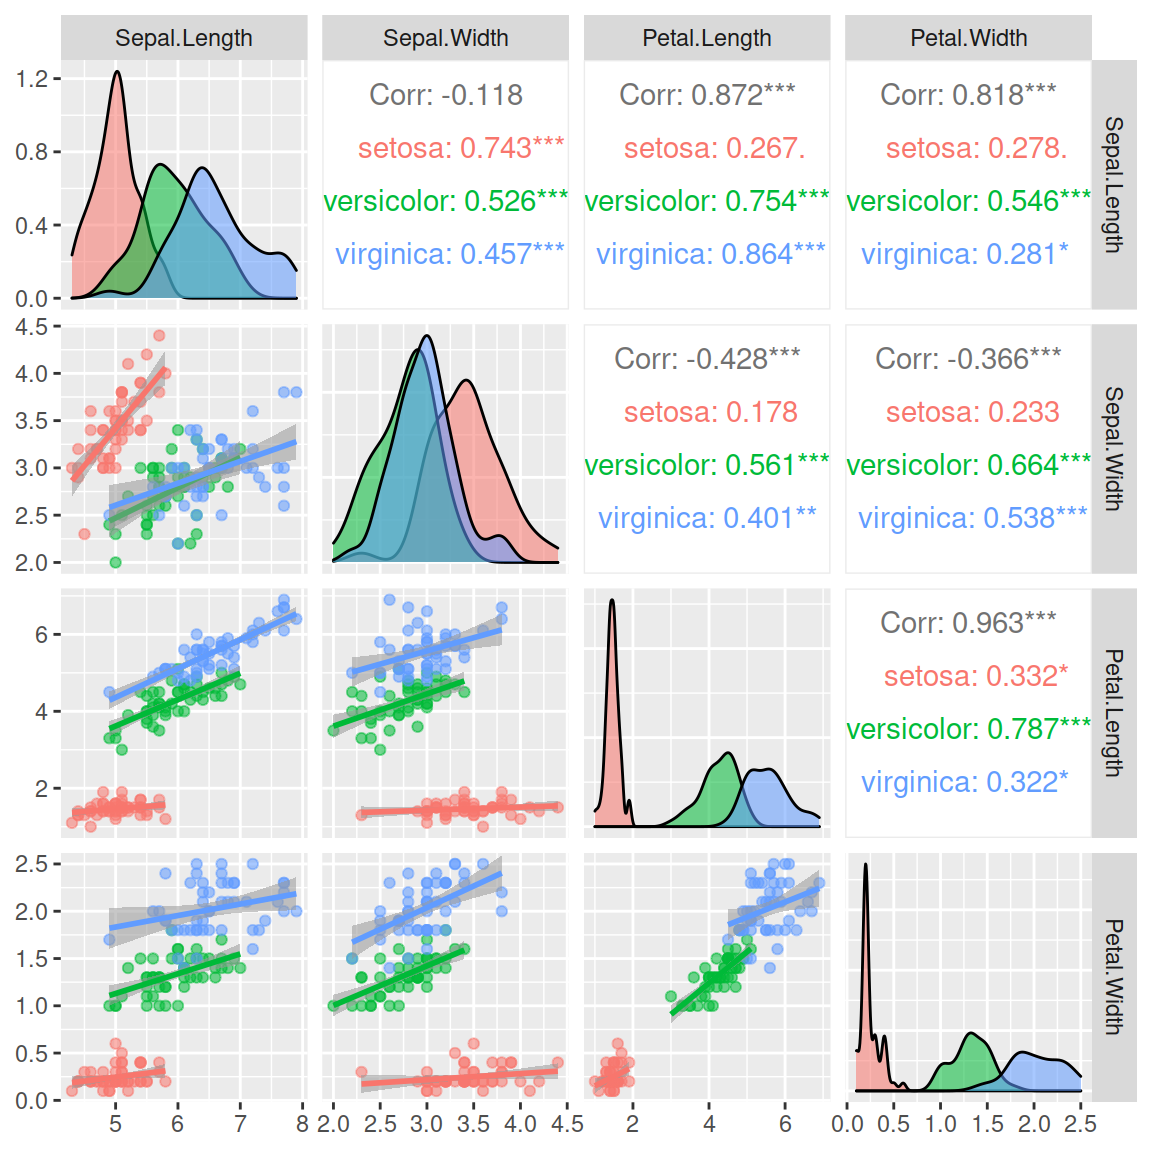
Lower panel
In the following example we are adding scatter plots with smoothed lines (ggally_smooth).
# install.packages("GGally")
library(GGally)

ggpairs(iris, columns = 1:4, aes(color = Species, alpha = 0.5),
        lower = list(continuous = "smooth"))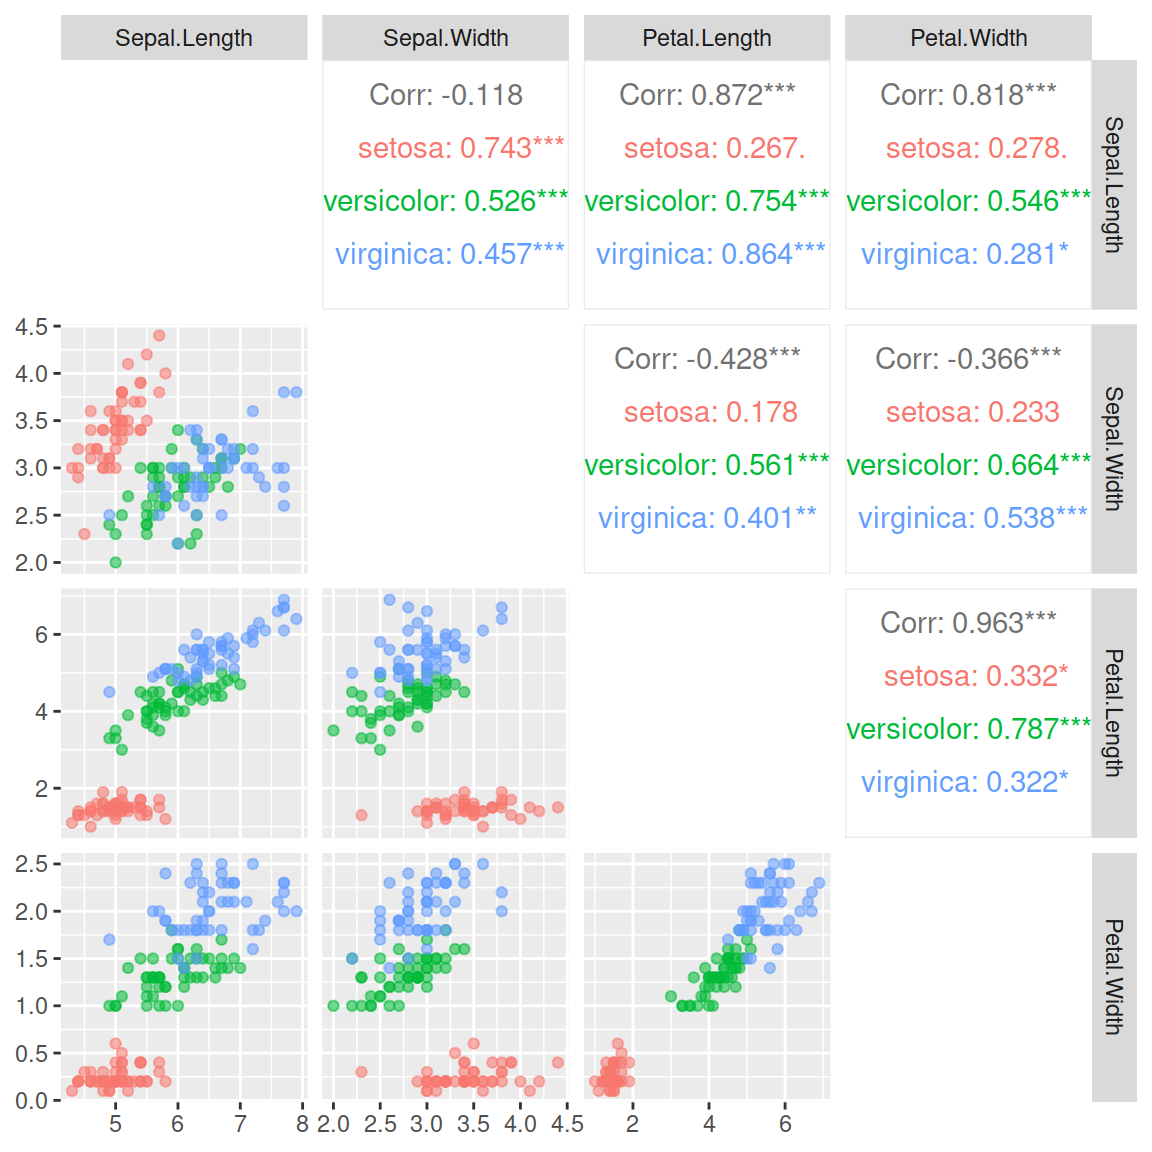
Diagonal
The diag argument defaults to "densityDiag". You can also pass "barDiag" or remove the diagonal with "blankDiag".
# install.packages("GGally")
library(GGally)

ggpairs(iris, columns = 1:4, aes(color = Species, alpha = 0.5),
        diag = list(continuous = "blankDiag"))
Categorical variables
If the data set contains categorical variables it is possible to customize the graphs representing the combination between categorical and numerical variables, as shown below.
Upper
Using the combo variable you can assign a different chart for the categorical variables on the upper panel. In the following example we are adding facet densities (ggally_facetdensity).
# install.packages("GGally")
library(GGally)

ggpairs(iris[3:5], aes(color = Species, alpha = 0.5),
        upper = list(combo = "facetdensity"))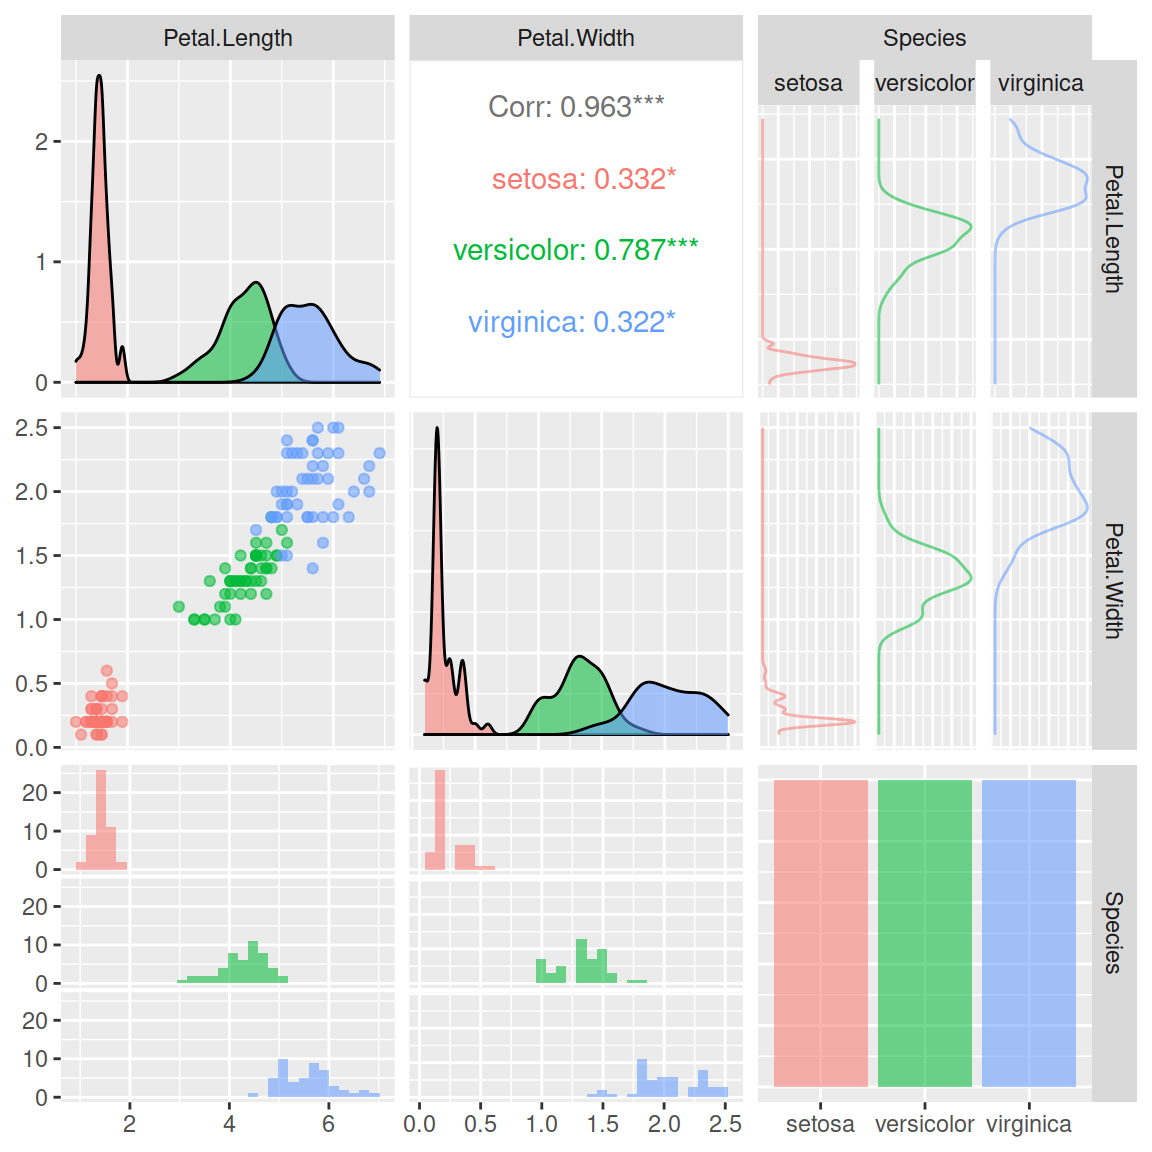
Lower
The same can be applied for the lower panel. In the following example we are displaying counts of observations using rectangles with proportional areas (ggally_count).
# install.packages("GGally")
library(GGally)

ggpairs(iris[3:5], aes(color = Species, alpha = 0.5),
        lower = list(combo = "count"))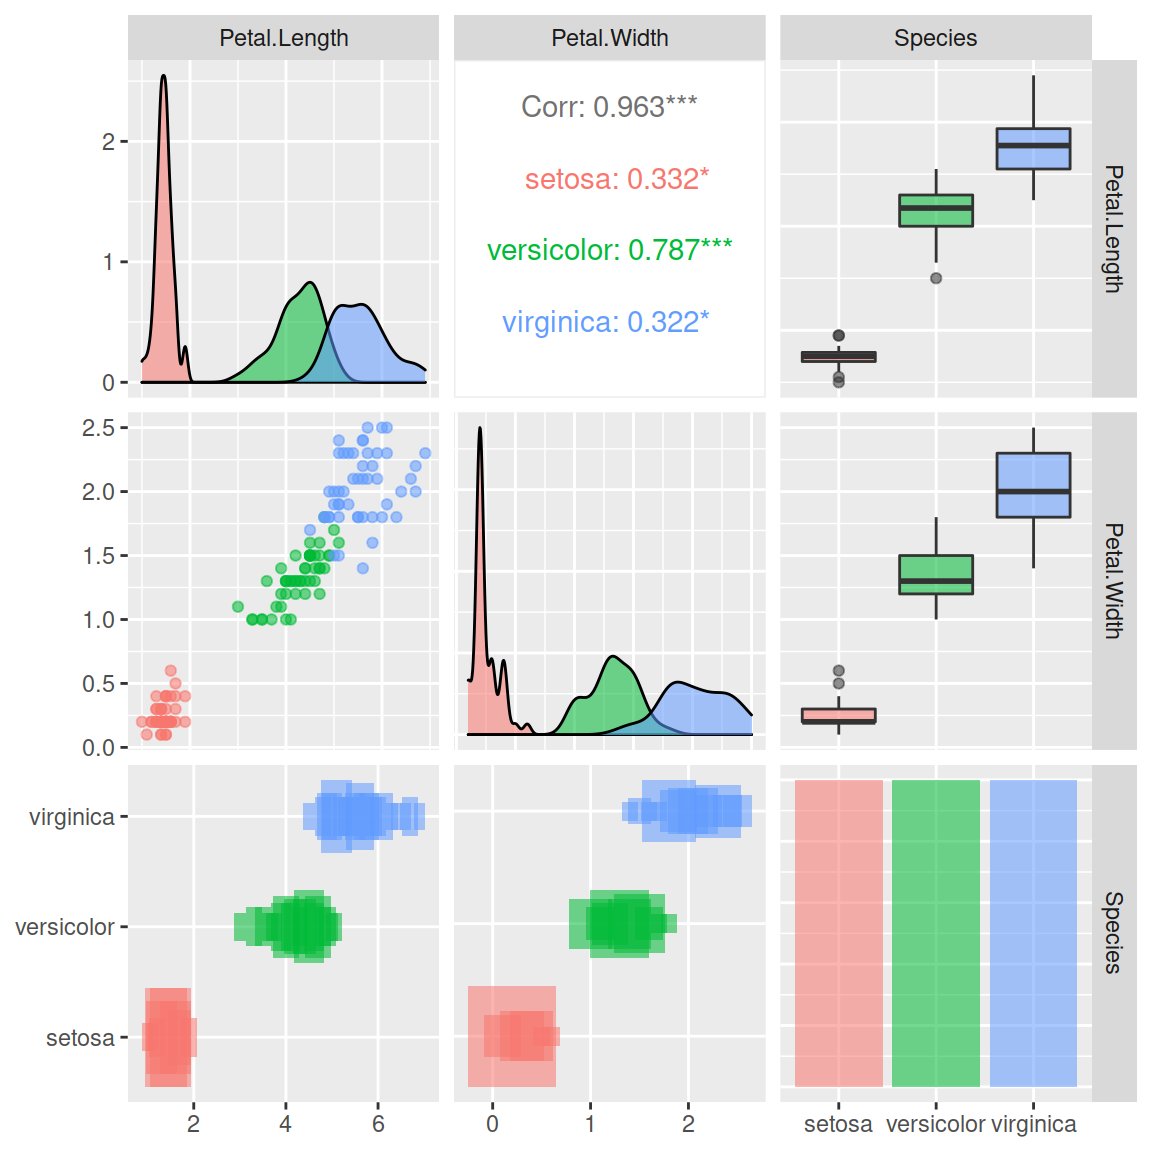

Master Statistics
Learn statistics from the basics to advanced techniques, clearly explained
Go to site