corPlot function from psych package
The corPlot function is very useful for visualizing a correlation matrix. Consider the longley data set and pass some of its columns to the function. You could also use the select argument to select the subset of variables.
# install.packages("psych")
library(psych)

corPlot(longley[, 2:5])
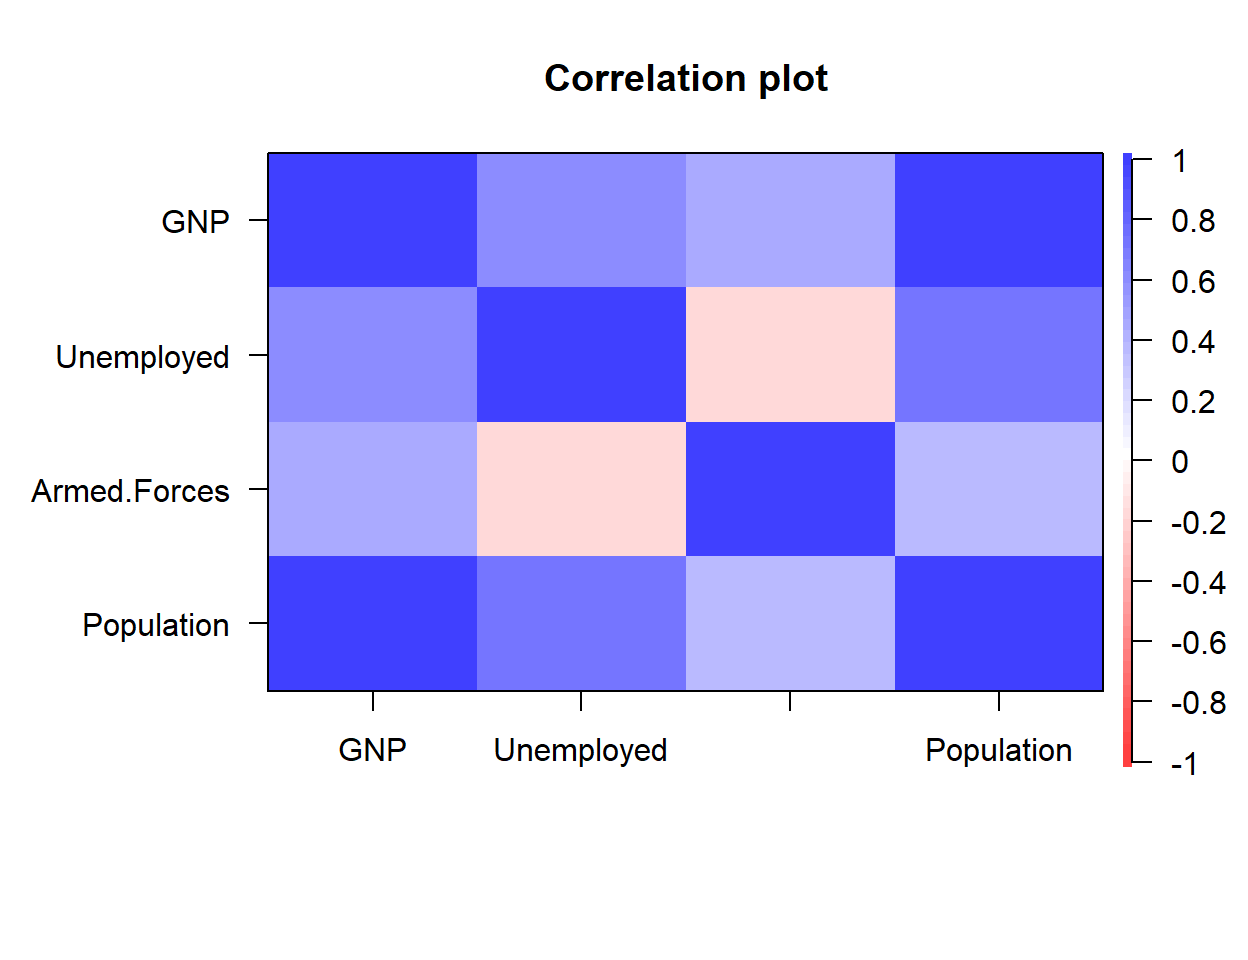
By default, the function display the full names of the columns (if fit). If you want to display only some letters set min.length to the desired number. You can also set custom labels with labels.
# install.packages("psych")
library(psych)

corPlot(longley[, 2:5],
        min.length = 3)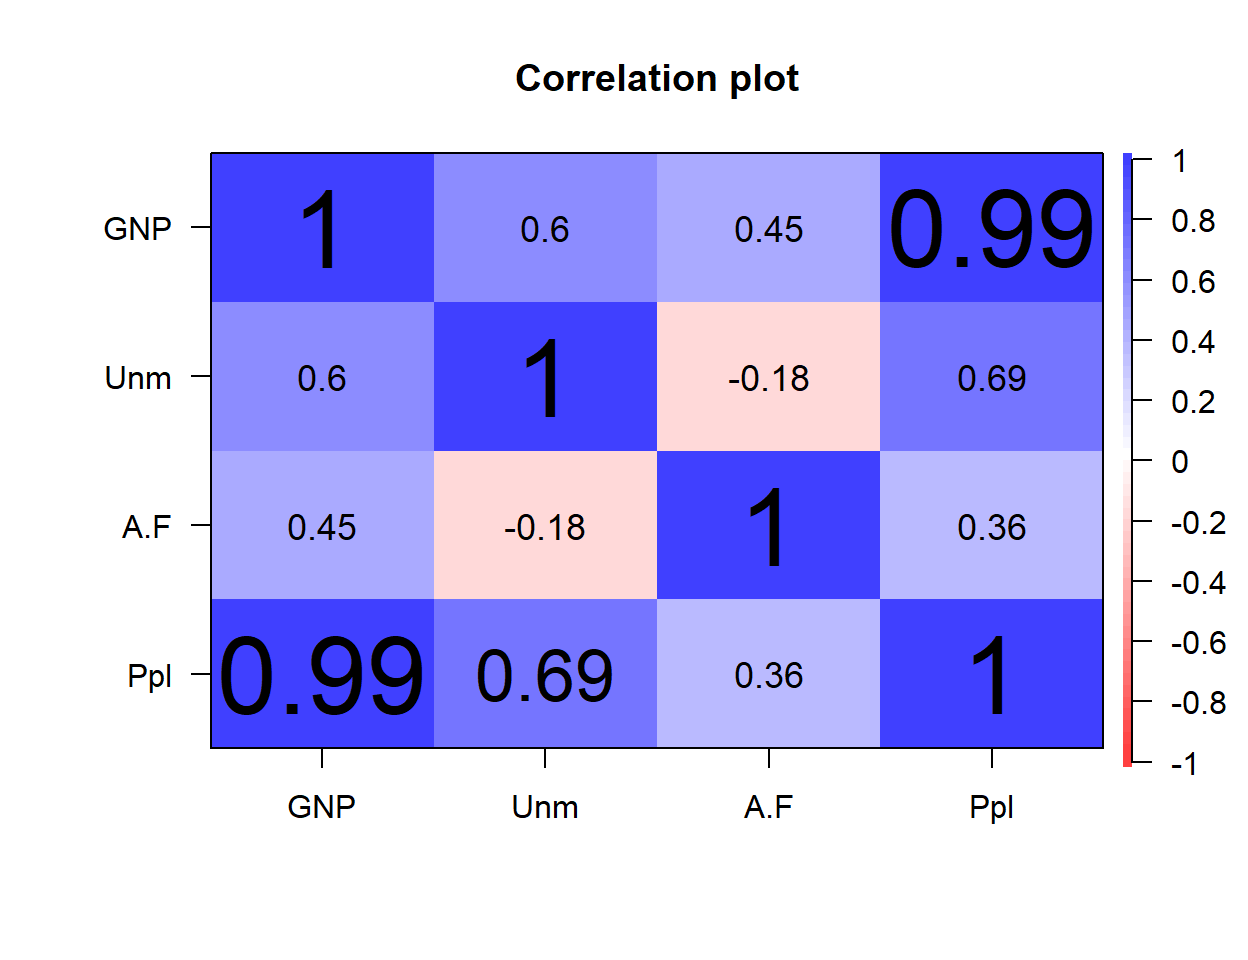
Correlation values and scales
No correlation displayed
Set numbers = FALSE to avoid displaying the correlation values.
# install.packages("psych")
library(psych)

corPlot(longley[, 2:5],
        numbers = FALSE)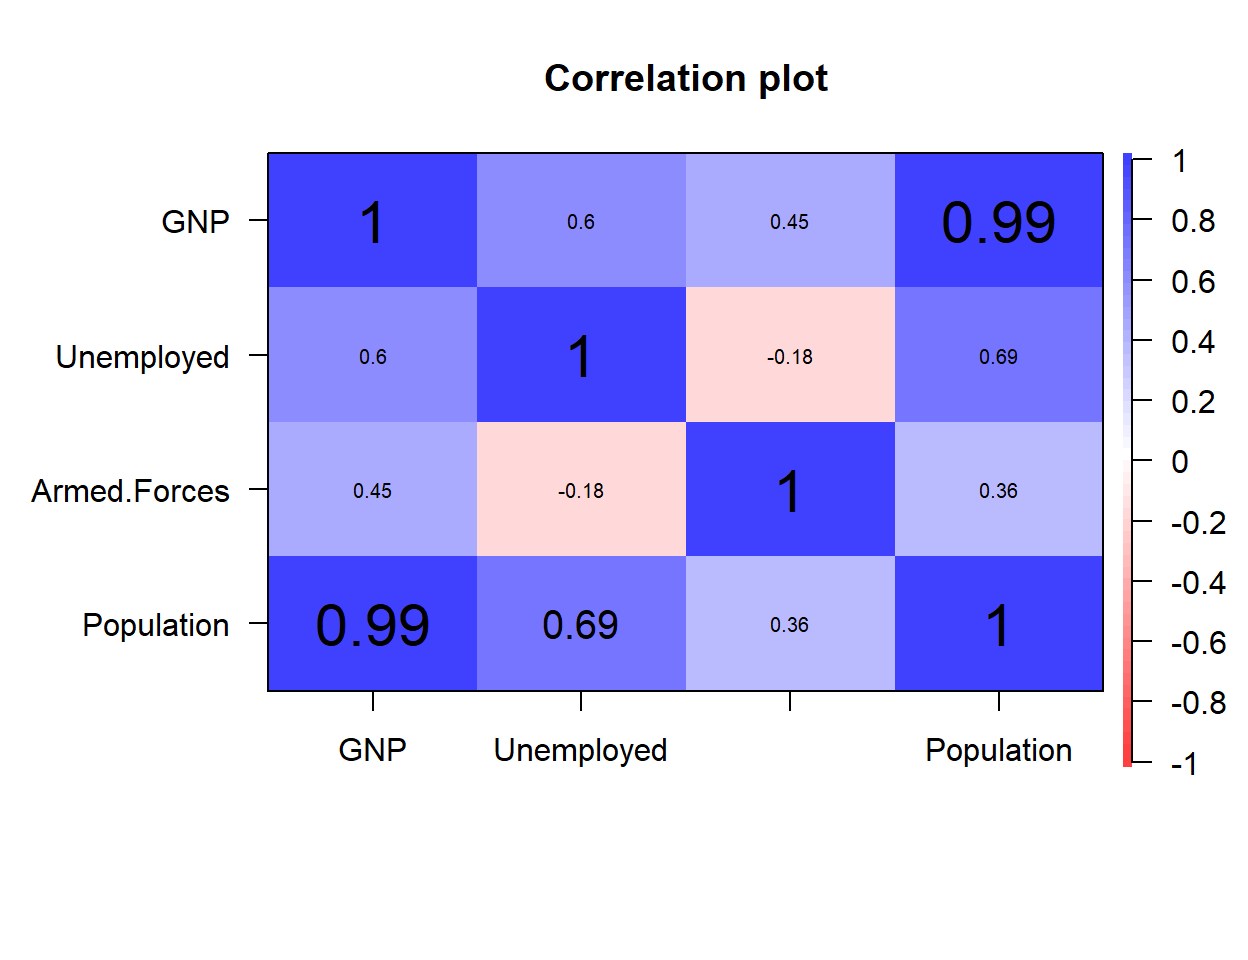
Correlation text size
The default text size is too big for some use cases. Modify the font size with cex.
# install.packages("psych")
library(psych)

corPlot(longley[, 2:5],
        cex = 1.25)
Correlation text of the same size
If you don’t like the scaled correlations text set scale = FALSE.
# install.packages("psych")
library(psych)

corPlot(longley[, 2:5],
        scale = FALSE)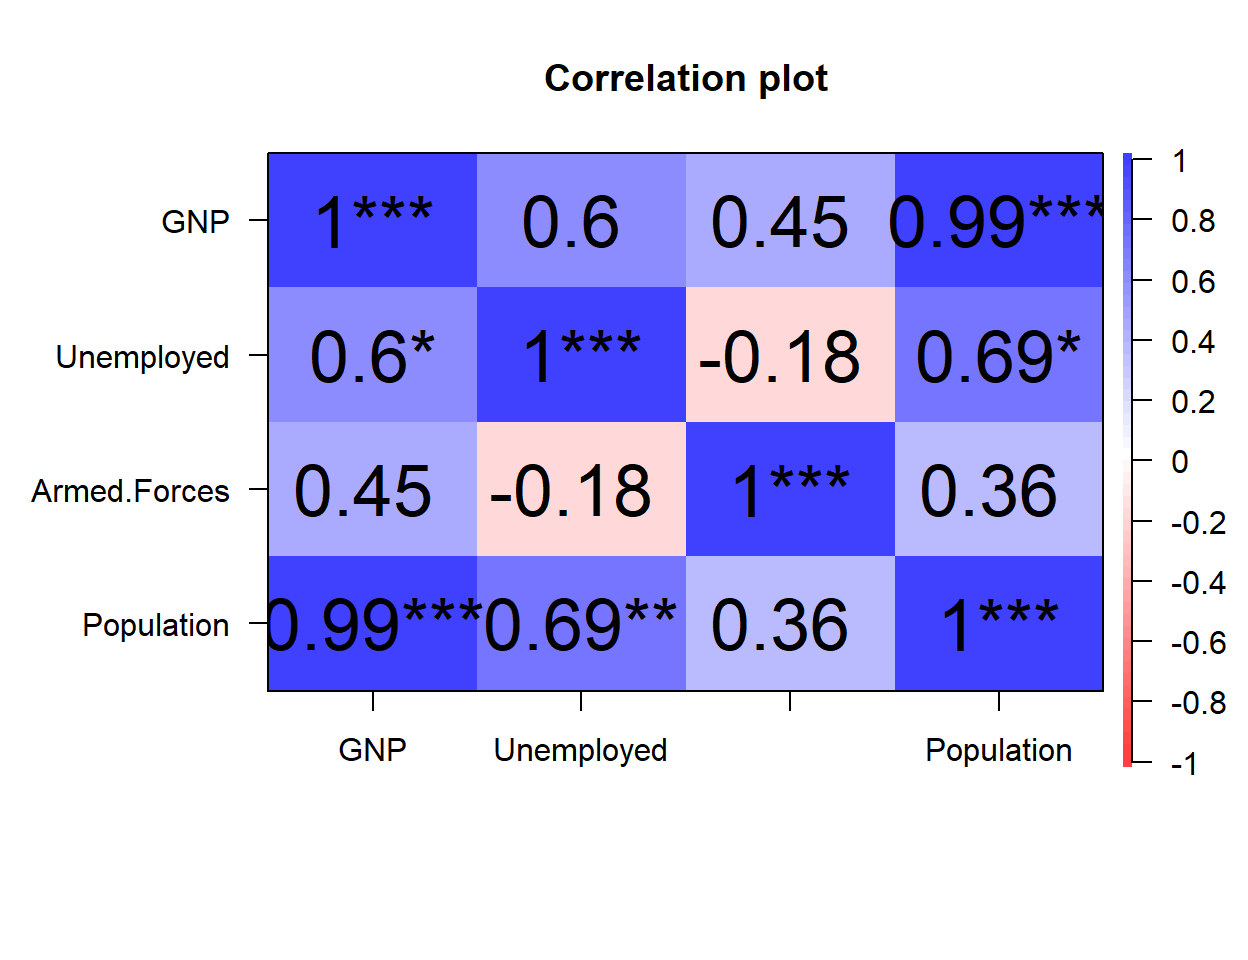
Correlation with significance levels
Show significance levels with astricks setting stars = TRUE.
# install.packages("psych")
library(psych)

corPlot(longley[, 2:5],
        stars = TRUE)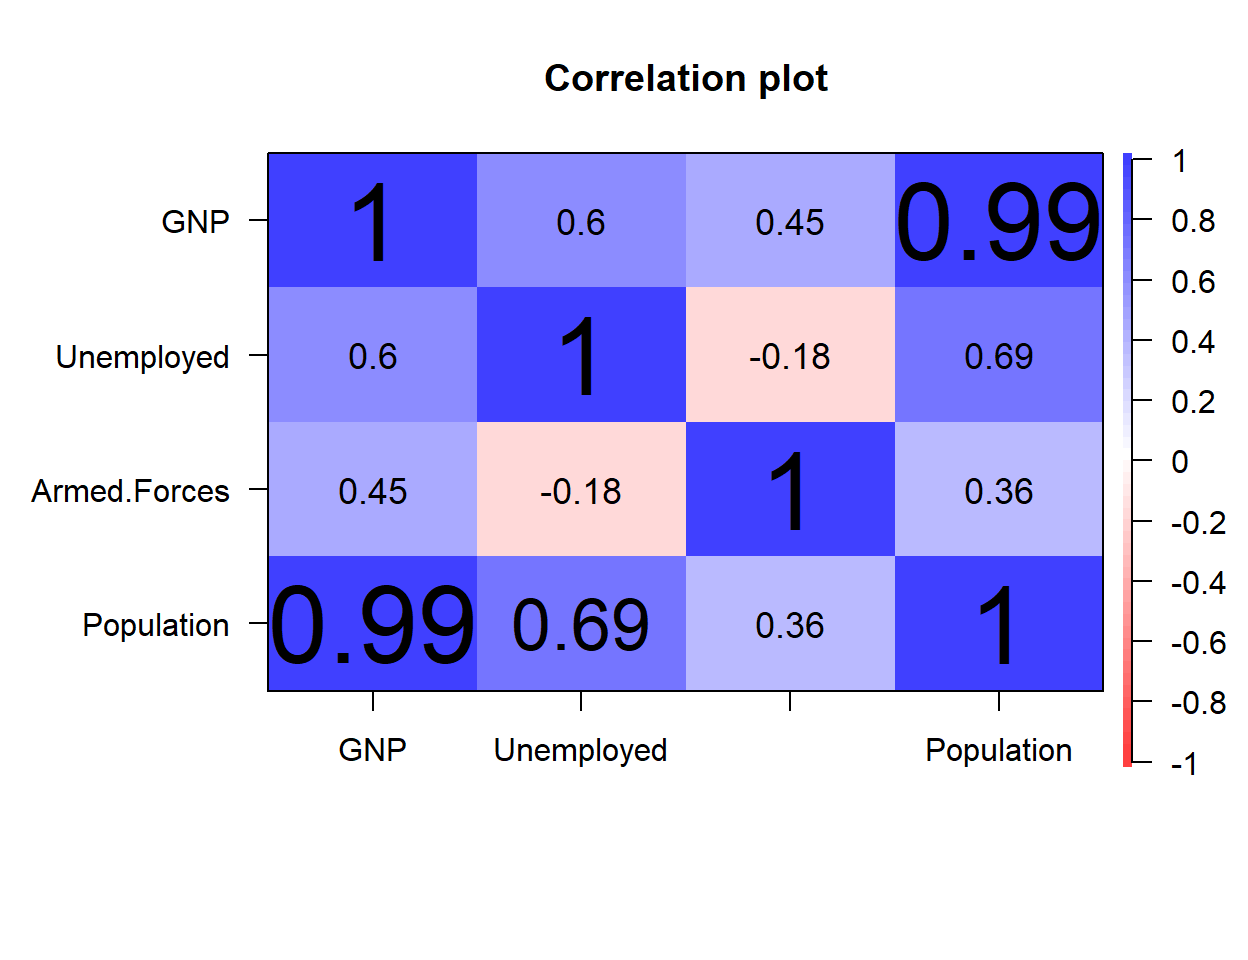
Correlation scaled to p-values
If you prefer scaling the correlation texts to p-values instead of correlation set pval = TRUE.
# install.packages("psych")
library(psych)

corPlot(longley[, 2:5],
        pval = TRUE)
Diagonal and upper panel
Remove the diagonal
It is possible to remove the diagonal of the correlation matrix with diag = FALSE.
# install.packages("psych")
library(psych)

corPlot(longley[, 2:5],
        diag = FALSE)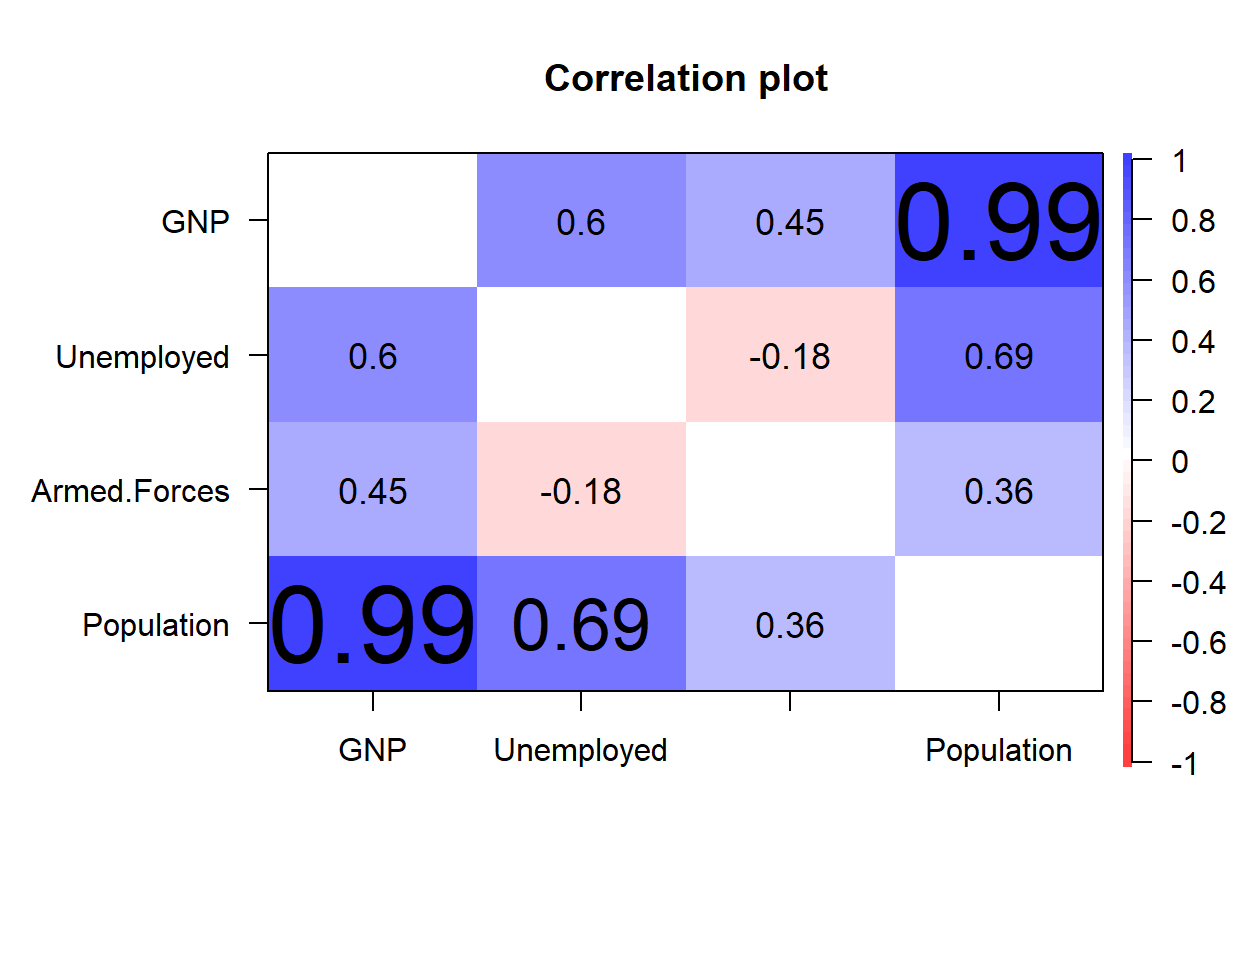
Remove the upper panel
You can also remove the upper panel with upper = FALSE. Note that the plot box will still displayed.
# install.packages("psych")
library(psych)

corPlot(longley[, 2:5],
        upper = FALSE)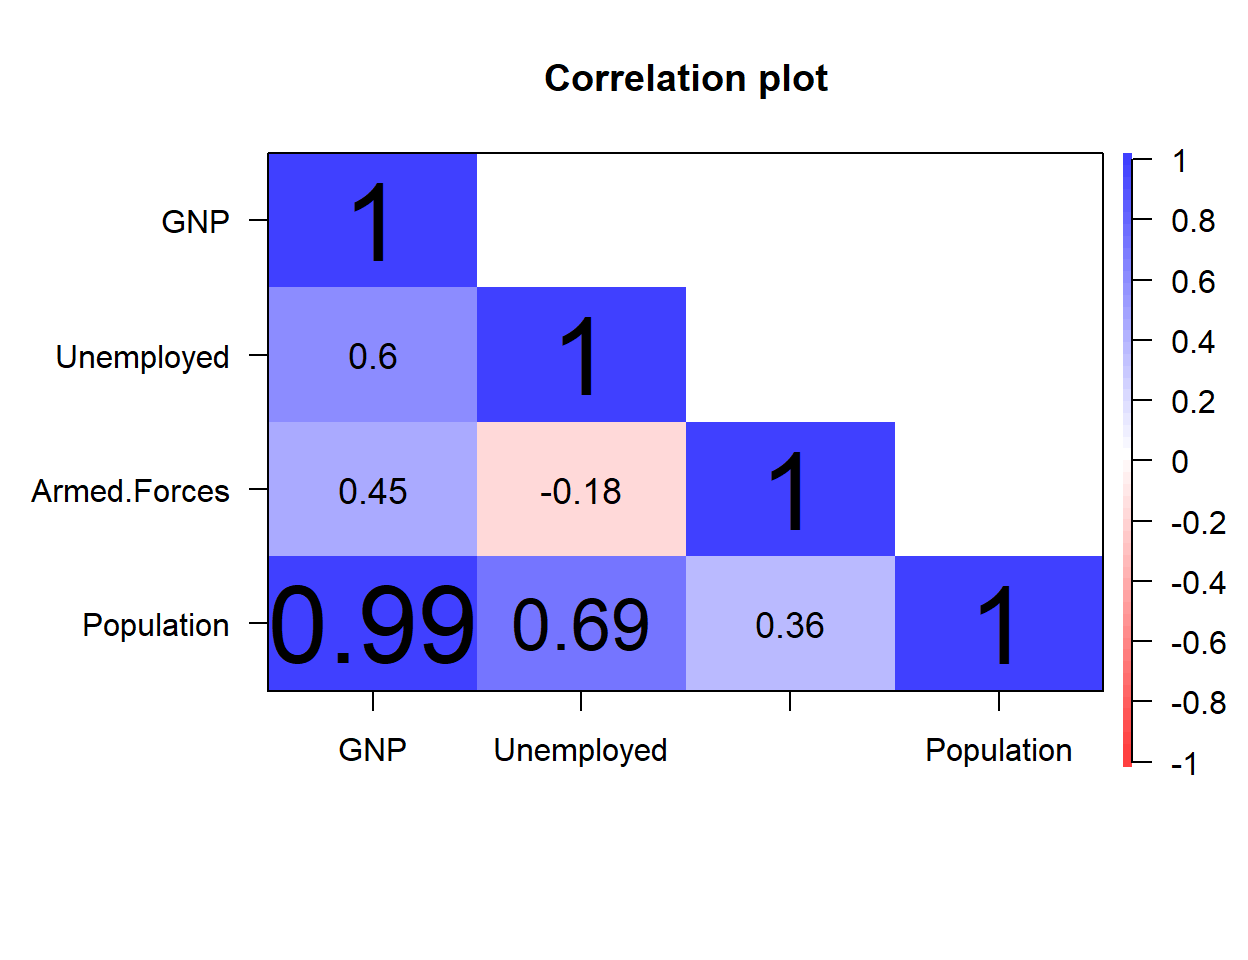
Color palette
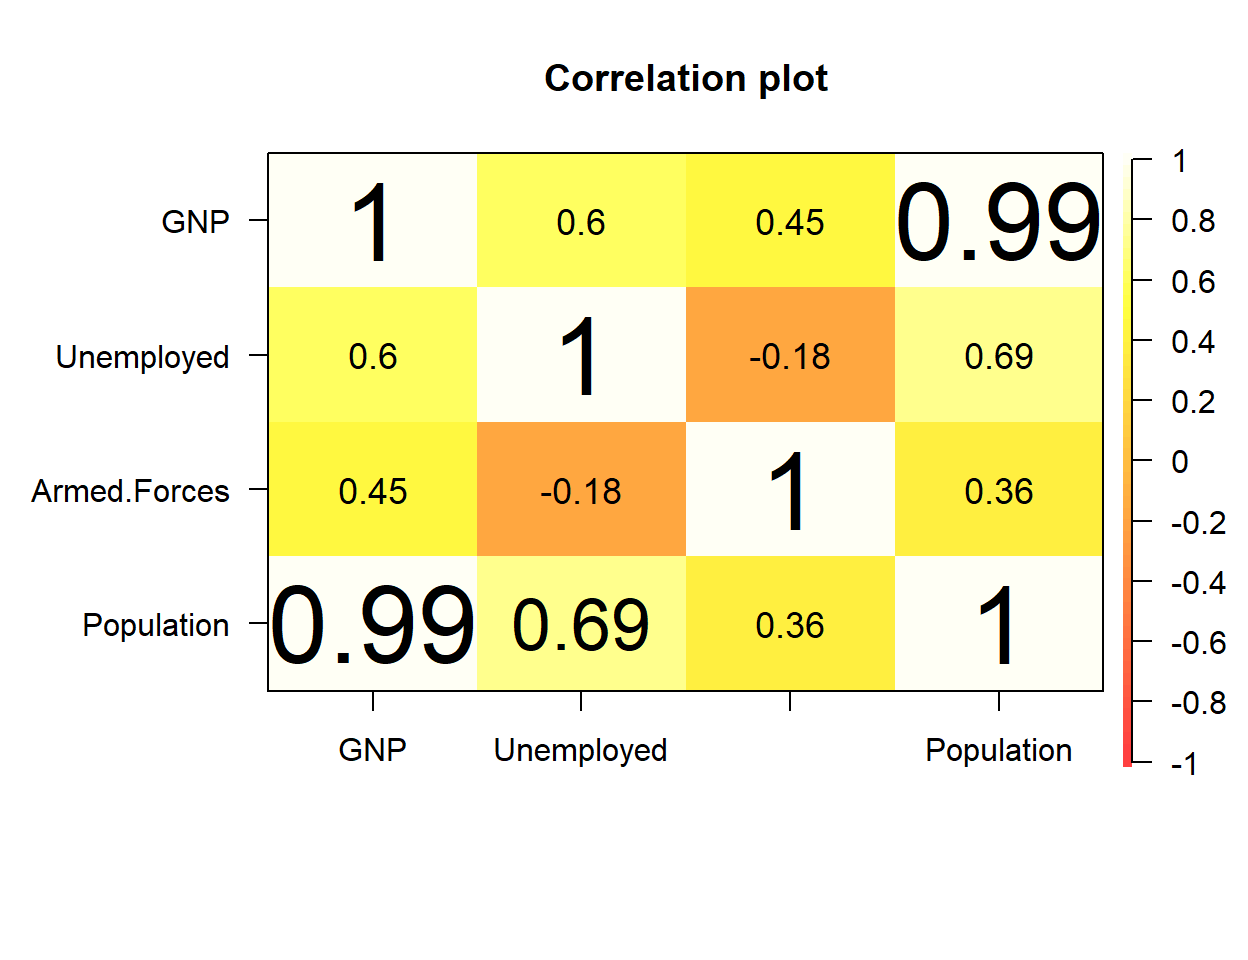
The default color palette can be customized passing a color ramp palette to gr argument as in the example below.
# install.packages("psych")
library(psych)

corPlot(longley[, 2:5],
        gr = colorRampPalette(heat.colors(40)))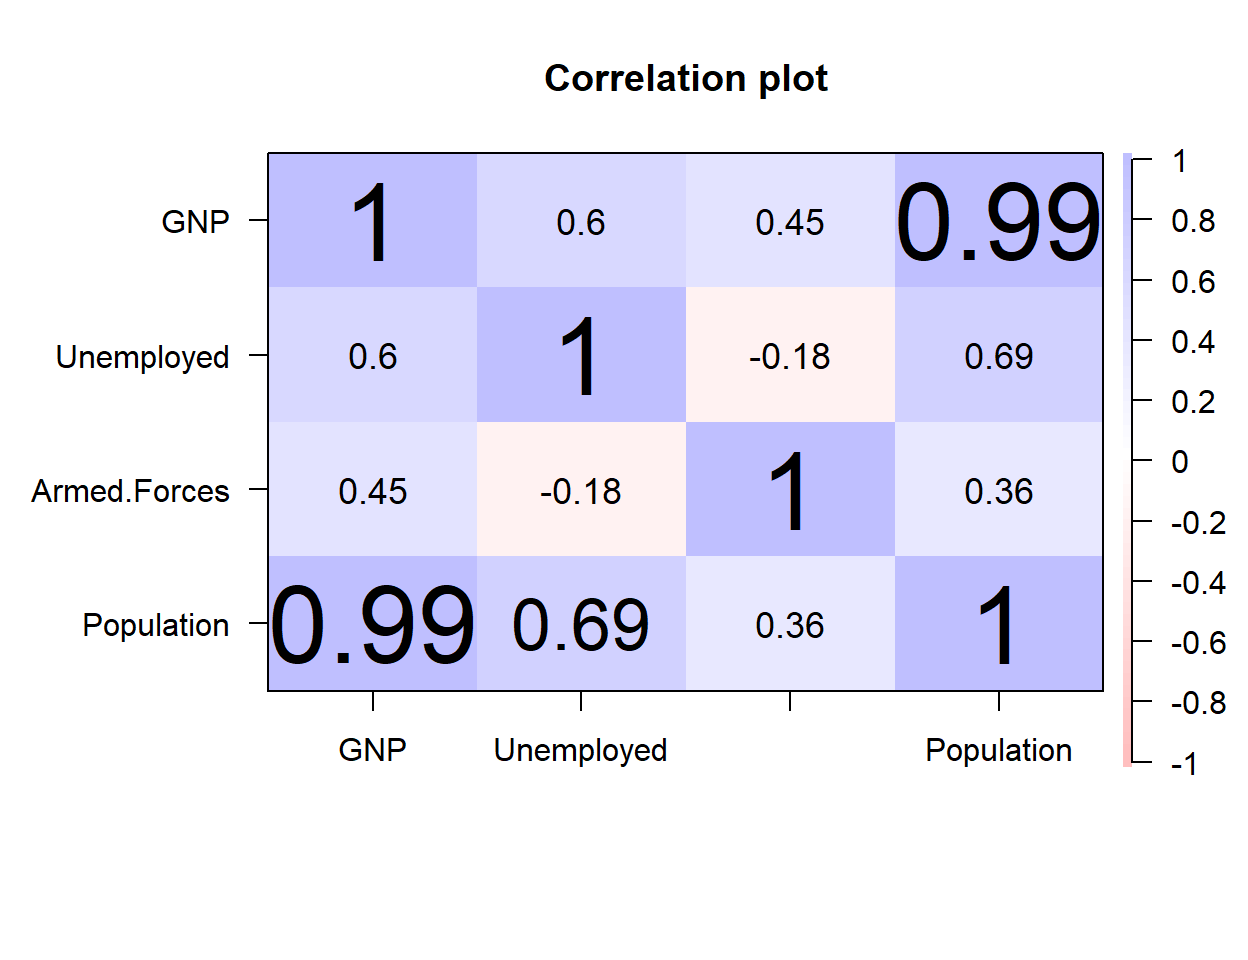
Note that the transparency of the color palette can also be customized with alpha. The default value is alpha = 0.75.
# install.packages("psych")
library(psych)

corPlot(longley[, 2:5],
        alpha = 0.25)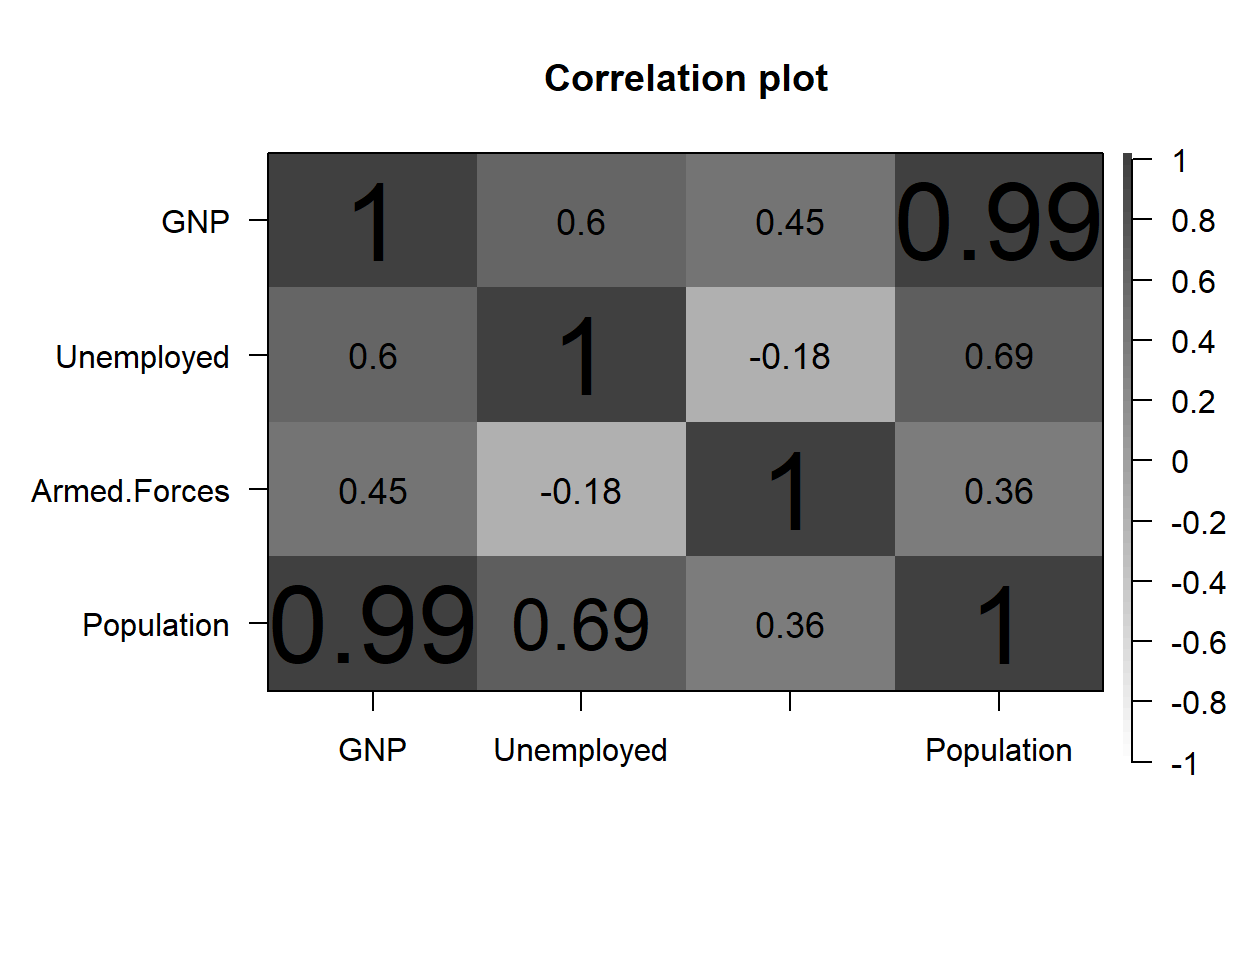
There is also an argument named colors which converts the default color palette to a gray scale.
# install.packages("psych")
library(psych)

corPlot(longley[, 2:5],
        colors = FALSE)
Master Statistics
Learn statistics from the basics to advanced techniques, clearly explained
Go to site