Sample data
ggcorrplot visualizes correlation matrices as ggplot2 plots. Start by computing the correlation matrix with cor() and optionally the p-value matrix with cor_pmat(). We use six numeric variables from mtcars.
# install.packages("ggcorrplot")
library(ggcorrplot)

df         <- mtcars[, c("mpg", "cyl", "disp", "hp", "wt", "qsec")]
cor_matrix <- cor(df)
ggcorrplot()
Pass the correlation matrix to ggcorrplot(). Each cell is colored by the correlation value: blue for positive, red for negative. The color scale runs from -1 to 1 by default.
# install.packages("ggcorrplot")
library(ggcorrplot)

cor_matrix <- cor(df)
ggcorrplot(cor_matrix)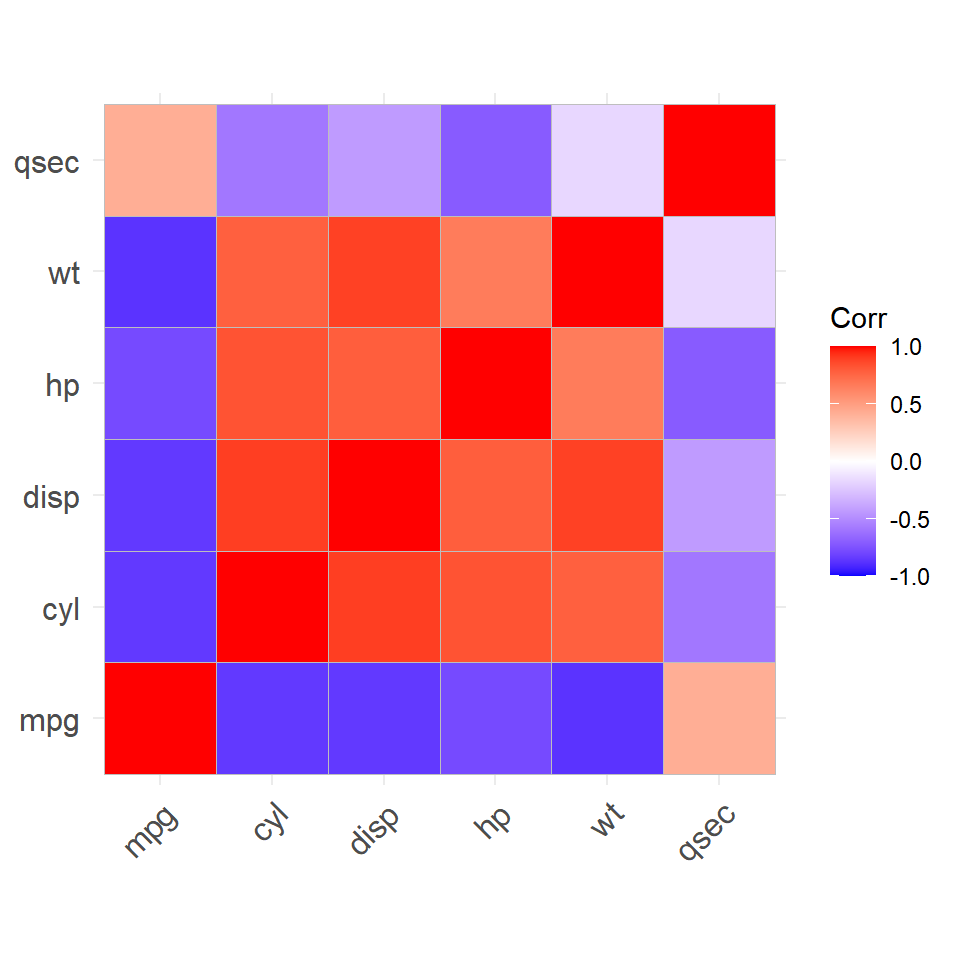
type
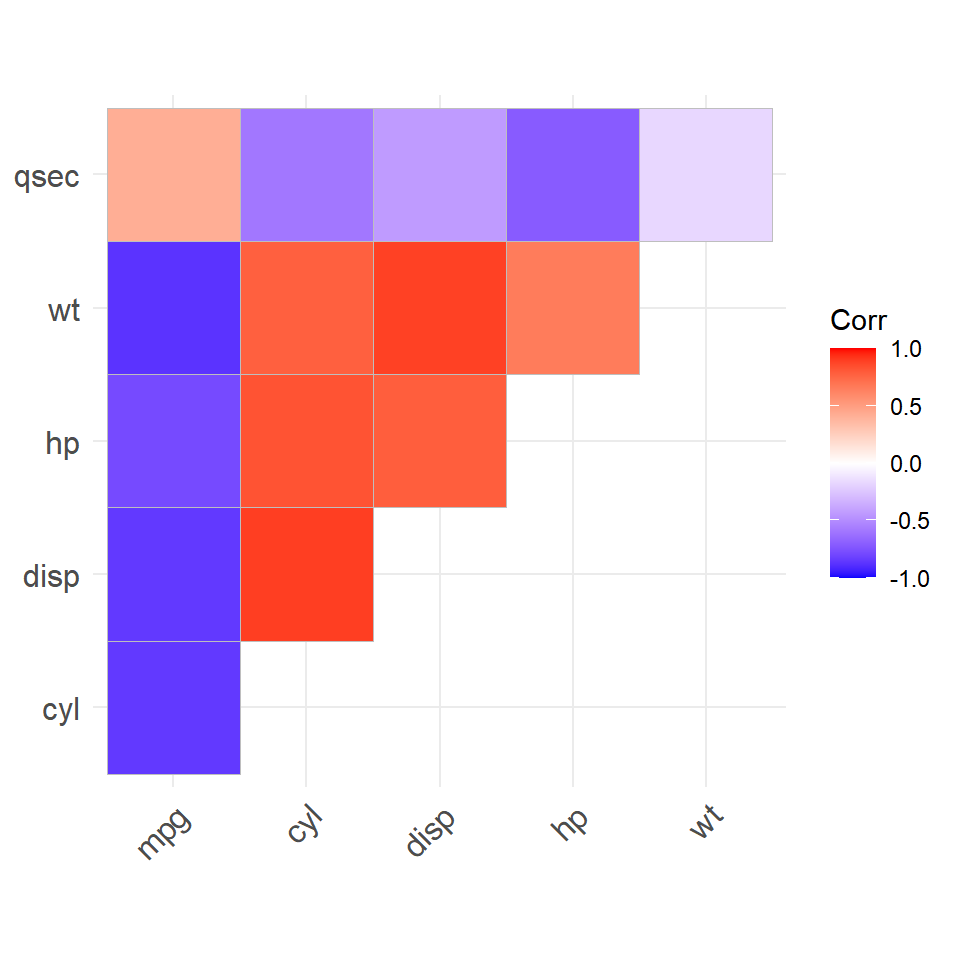
Since the matrix is symmetric, showing only half avoids redundancy. Set type = "upper" for the upper triangle or type = "lower" for the lower triangle. The default is "full".
# install.packages("ggcorrplot")
library(ggcorrplot)

ggcorrplot(cor_matrix,
           type = "upper")
method
Use method = "circle" to replace the colored squares with circles whose size encodes the absolute correlation strength. Larger circles mean stronger correlations, making it easier to spot the most important relationships at a glance.
# install.packages("ggcorrplot")
library(ggcorrplot)

ggcorrplot(cor_matrix,
           method = "circle")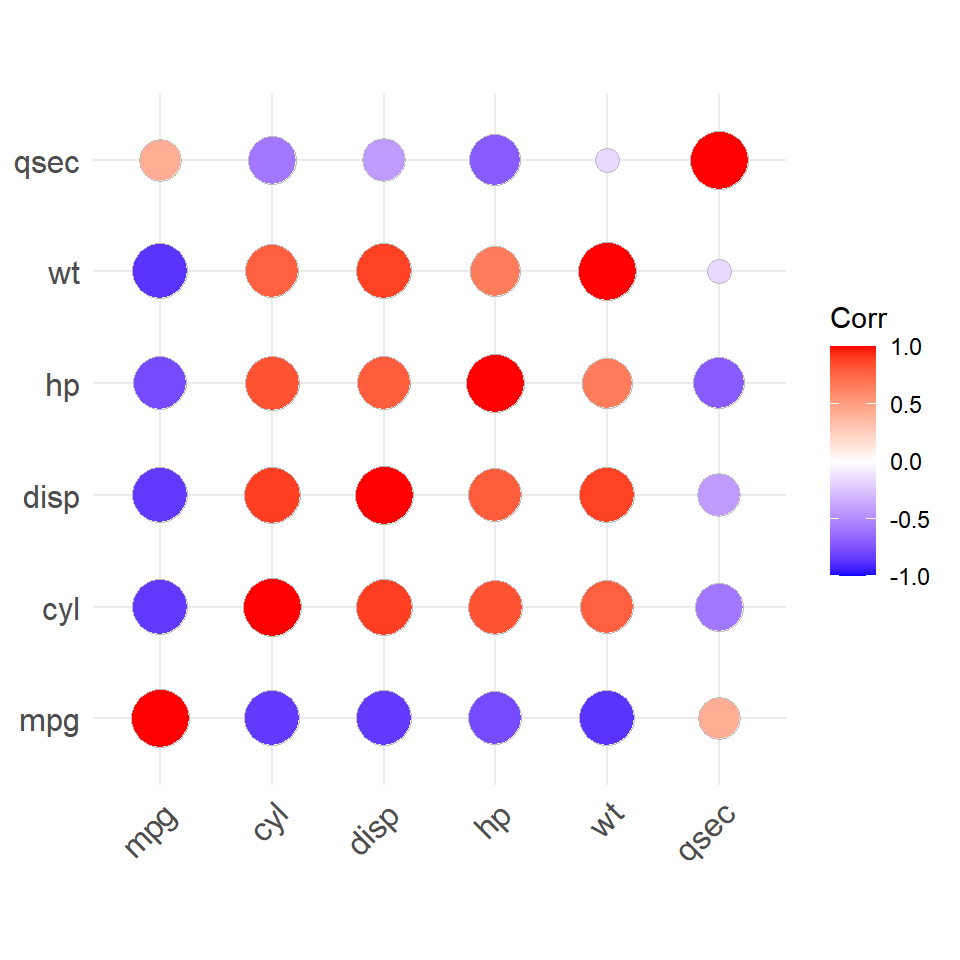
Correlation coefficients

Set lab = TRUE to print the correlation coefficient inside each cell. Adjust the label size with lab_size. Combine with type = "upper" for a cleaner layout.
# install.packages("ggcorrplot")
library(ggcorrplot)

ggcorrplot(cor_matrix,
           type     = "upper",
           lab      = TRUE,
           lab_size = 3)
P-value masking
cor_pmat() computes a matrix of p-values for each pair. Pass it to p.mat and set a sig.level threshold to cross out or blank non-significant correlations, keeping only the ones that matter statistically.
# install.packages("ggcorrplot")
library(ggcorrplot)

p_matrix <- cor_pmat(df)

ggcorrplot(cor_matrix,
           p.mat     = p_matrix,
           sig.level = 0.05)
Colors
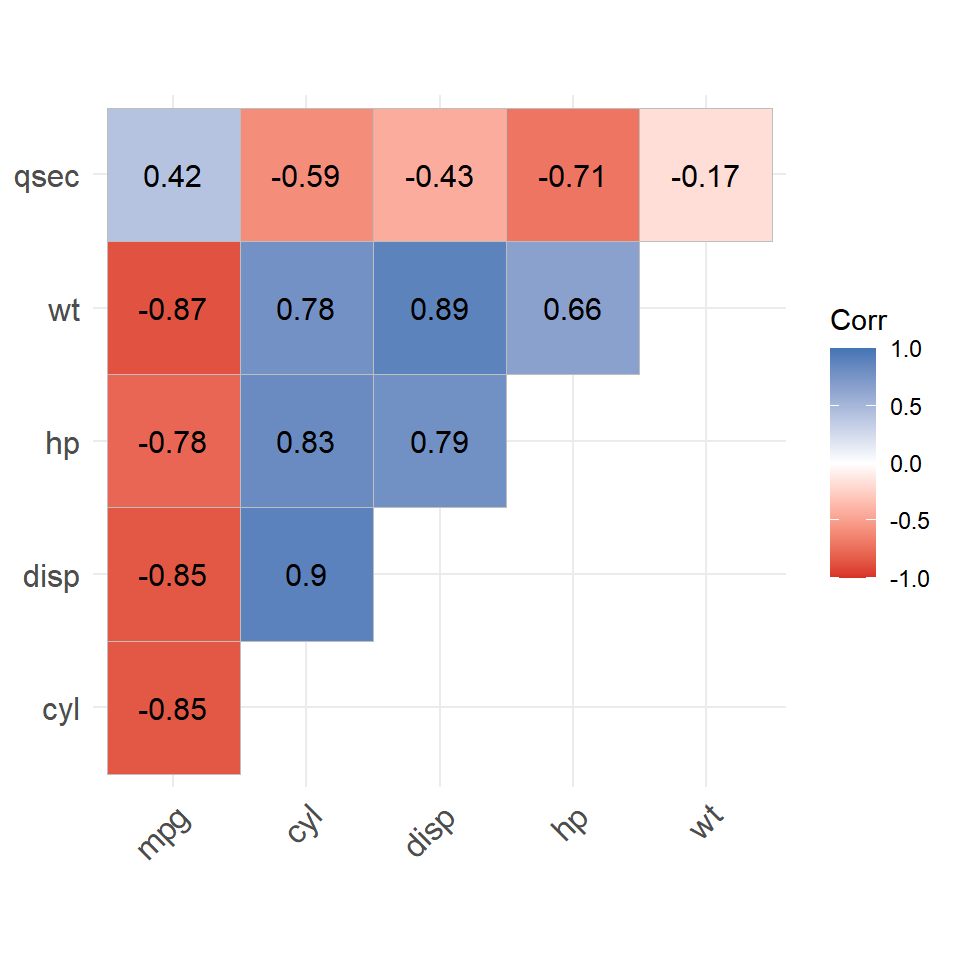
Pass a three-element vector to colors to set the low, mid and high colors of the scale. The first color maps to -1, the second to 0 and the third to +1. Any hex color or R color name works.
# install.packages("ggcorrplot")
library(ggcorrplot)

ggcorrplot(cor_matrix,
           type   = "upper",
           colors = c("#d73027", "white", "#4575b4"))
Master Statistics
Learn statistics from the basics to advanced techniques, clearly explained
Go to site