Box plot in ggplot2 with geom_boxplot
If you have a data frame containing a numerical variable you can use geom_boxplot to create a box plot in ggplot2, passing the variable to aes.
# install.packages("ggplot2")
library(ggplot2)

# Data
set.seed(3)
y <- rnorm(500)
df <- data.frame(y)

# Basic box plot
ggplot(df, aes(y = y)) +
  geom_boxplot()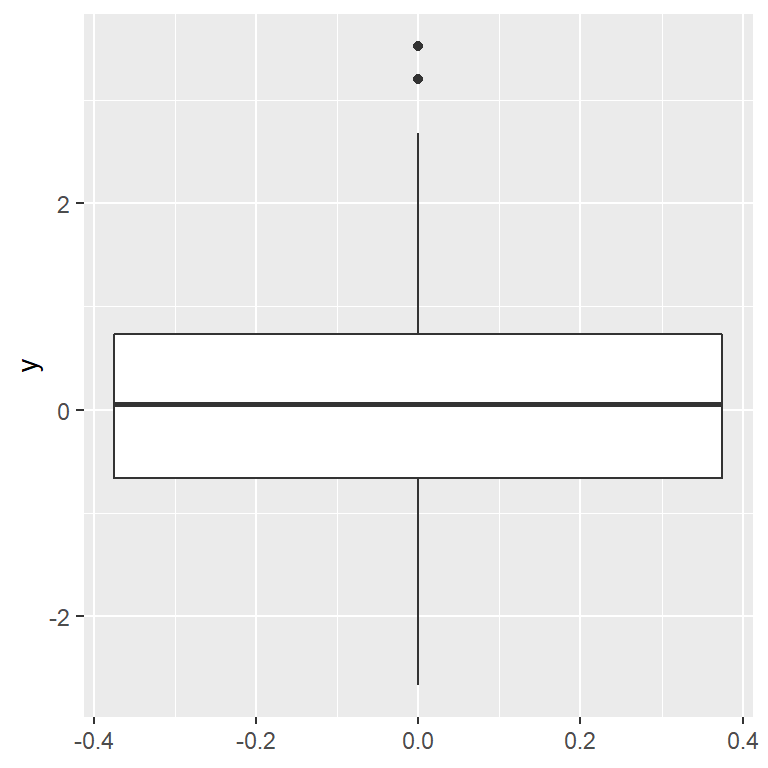
Alternatively you can set x = "". This will remove the values of the X axis and make the box plot thinner.
# install.packages("ggplot2")
library(ggplot2)

# Data
set.seed(3)
y <- rnorm(500)
df <- data.frame(y)

# Basic box plot
ggplot(df, aes(x = "", y = y)) +
  geom_boxplot()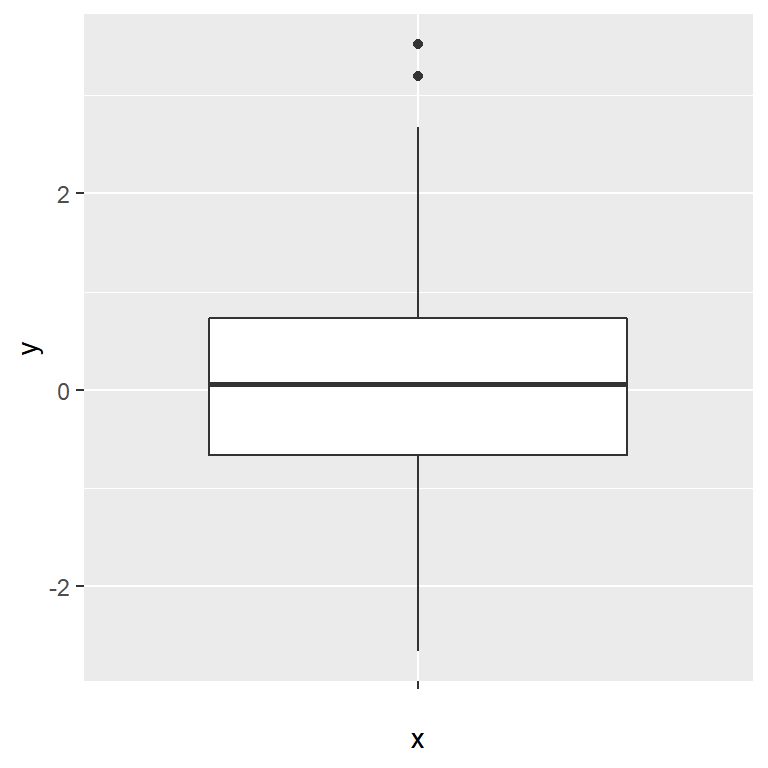
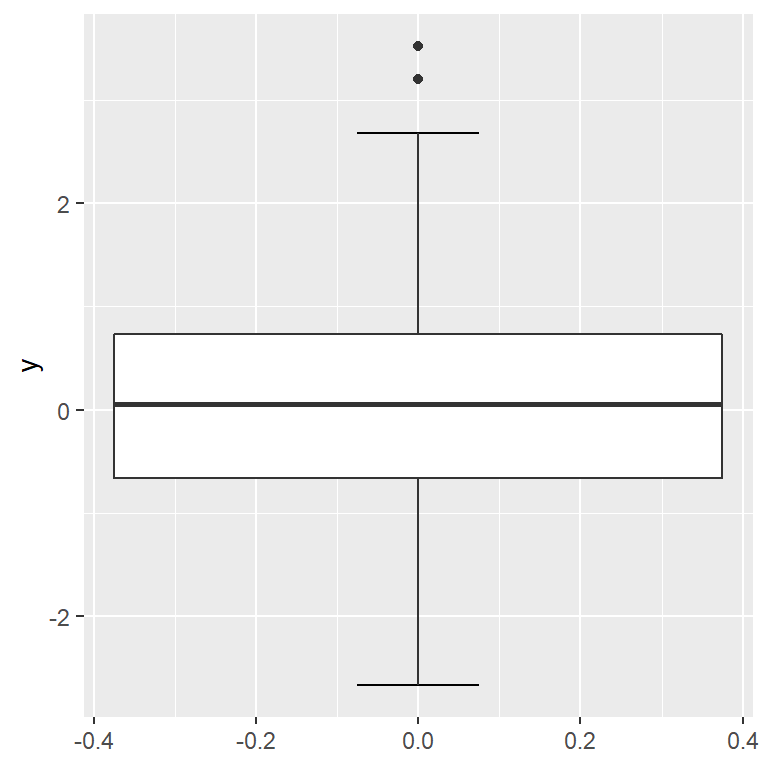
Adding error bars (whiskers) with stat_boxplot
The default box plot in ggplot doesn’t add the error bar lines, but you can add them with stat_boxplot, setting geom = "errorbar". Note that you can change its width with width.
# install.packages("ggplot2")
library(ggplot2)

# Data
set.seed(3)
y <- rnorm(500)
df <- data.frame(y)

# Basic box plot
ggplot(df, aes(y = y)) +
  stat_boxplot(geom = "errorbar",
               width = 0.15) +
  geom_boxplot()
Horizontal box plot
There are two main ways to change the orientation of a box plot in ggplot2: changing the aes variable or using coord_flip as in the examples below.
Option 1: changing the argument.
# install.packages("ggplot2")
library(ggplot2)

# Data
set.seed(3)
y <- rnorm(500)
df <- data.frame(y)

# Horizontal box plot
ggplot(df, aes(x = y)) +
  stat_boxplot(geom = "errorbar",
               width = 0.15) +
  geom_boxplot()
Option 2: using coord_flip.
# install.packages("ggplot2")
library(ggplot2)

# Data
set.seed(3)
y <- rnorm(500)
df <- data.frame(y)

# Horizontal box plot
ggplot(df, aes(y = y)) +
  stat_boxplot(geom = "errorbar",
               width = 0.15) +
  geom_boxplot() +
  coord_flip()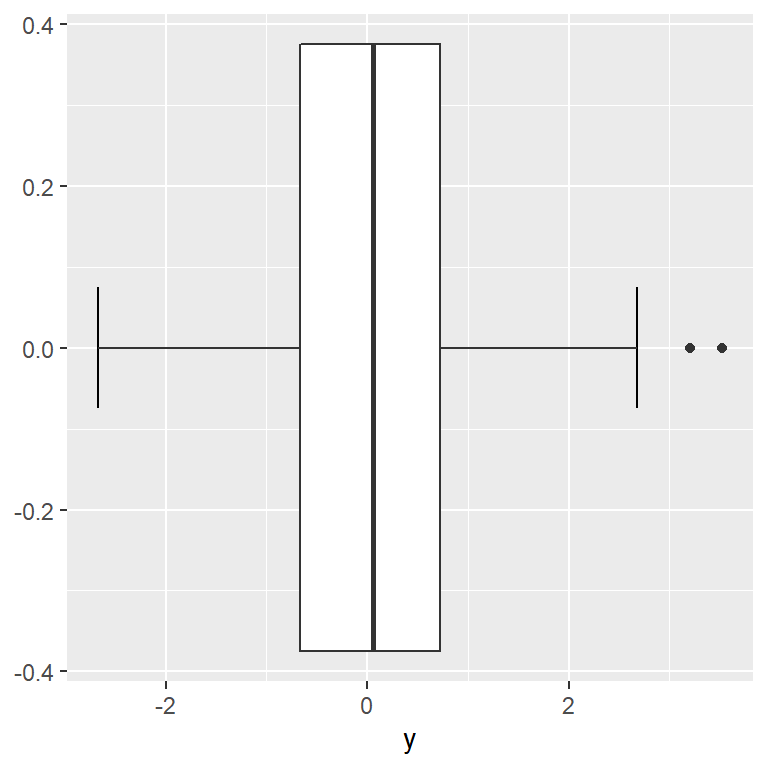
Box plot customization
The ggplot box plots can be customized making use of the arguments of stat_boxplot and geom_boxplot. In the following examples we are changing the colors and line types of the plots, highlighting the corresponding arguments.

Colors customization
# install.packages("ggplot2")
library(ggplot2)

# Data
set.seed(3)
y <- rnorm(500)
df <- data.frame(y)

# Box plot customization
ggplot(df, aes(y = y)) +
  stat_boxplot(geom = "errorbar",
               width = 0.15,
               color = 1) +  # Error bar color
  geom_boxplot(fill = 2,           # Box color
               alpha = 0.5,        # Transparency
               color = 1,          # Border color
               outlier.colour = 2) # Outlier color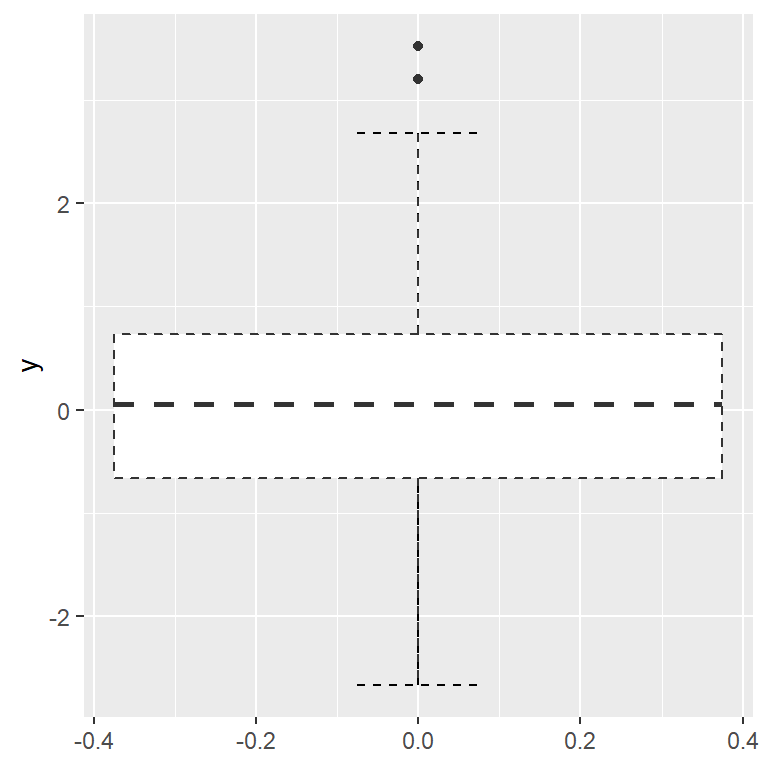
Lines customization
# install.packages("ggplot2")
library(ggplot2)

# Data
set.seed(3)
y <- rnorm(500)
df <- data.frame(y)

# Box plot lines customization
ggplot(df, aes(y = y)) +
  stat_boxplot(geom = "errorbar",
               width = 0.15,
               linetype = 2, # Line type
               lwd = 0.5) +  # Line width
  geom_boxplot(linetype = 2, # Line type
               lwd = 0.5)    # Line width
Master Statistics
Learn statistics from the basics to advanced techniques, clearly explained
Go to site