Default histogram
By default, the underlying computation of geom_histogram through stat_bin uses 30 bins, which is not always a good default.
# install.packages("ggplot2")
library(ggplot2)

# Data
set.seed(05022021)
x <- rnorm(600)
df <- data.frame(x)

# Default histogram
ggplot(df, aes(x = x)) +
  geom_histogram()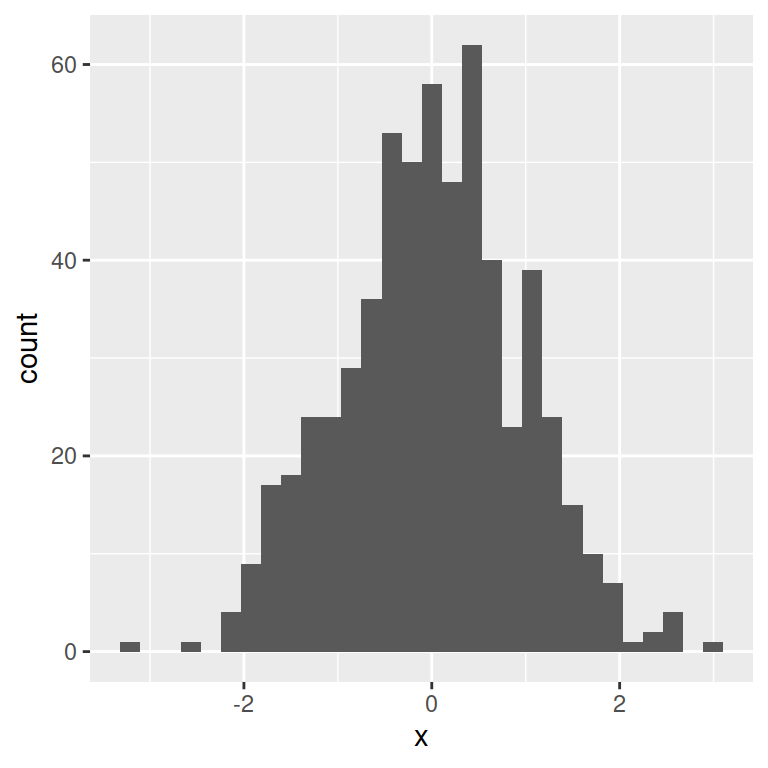
This is the reason why you get the following message every time you create a default histogram in ggplot2:
stat_bin() using bins = 30. Pick better value with binwidth.
Possible options to deal with this is setting the number of bins with bins argument or modifying the width of each bin with binwidth argument.
bins argument
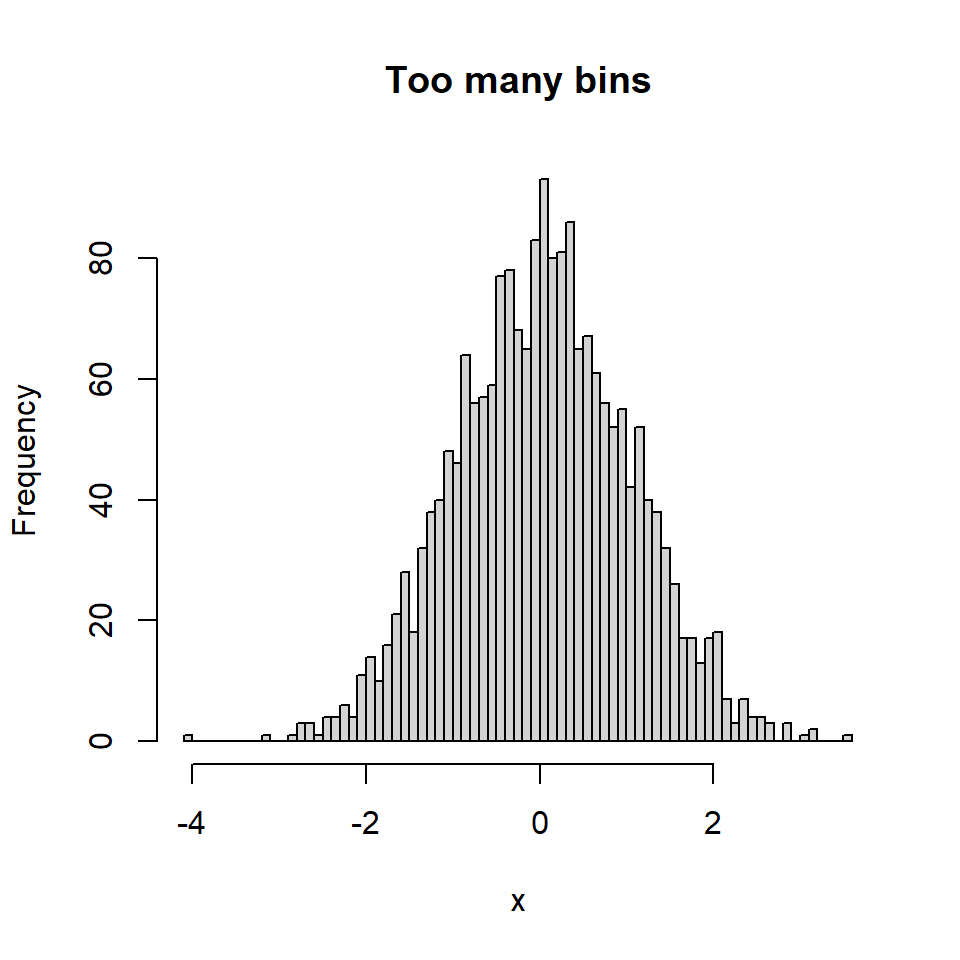
The number of bins or bars of the histogram can be customized with the bins argument of the geom_histogram function. In this example 15 bins seem to be a good choice while 50 are too many.
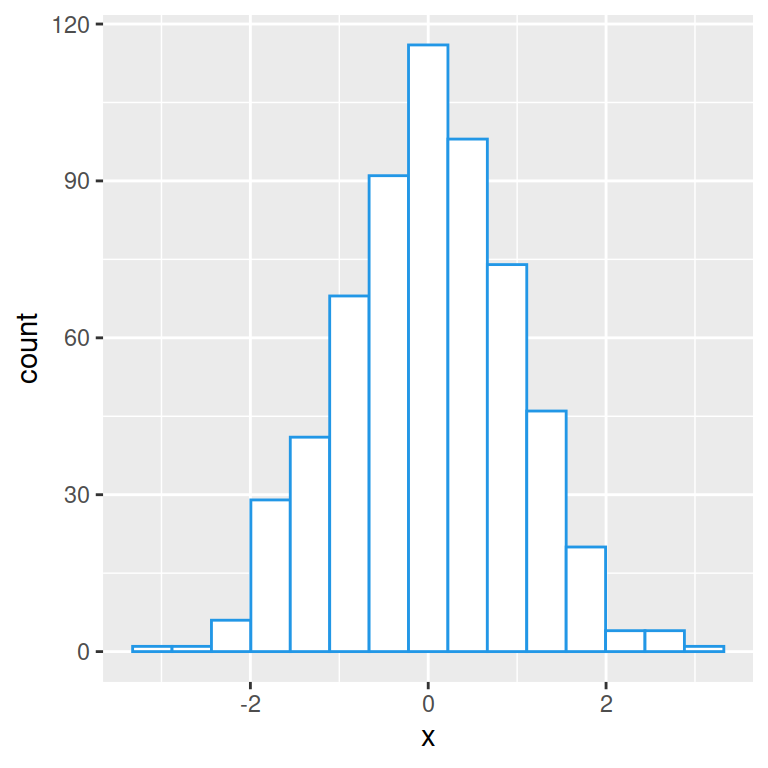
15 bins
# install.packages("ggplot2")
library(ggplot2)

# Data
set.seed(05022021)
x <- rnorm(600)
df <- data.frame(x)

# Histogram bins
ggplot(df, aes(x = x)) +
  geom_histogram(colour = 4, fill = "white",
                 bins = 15)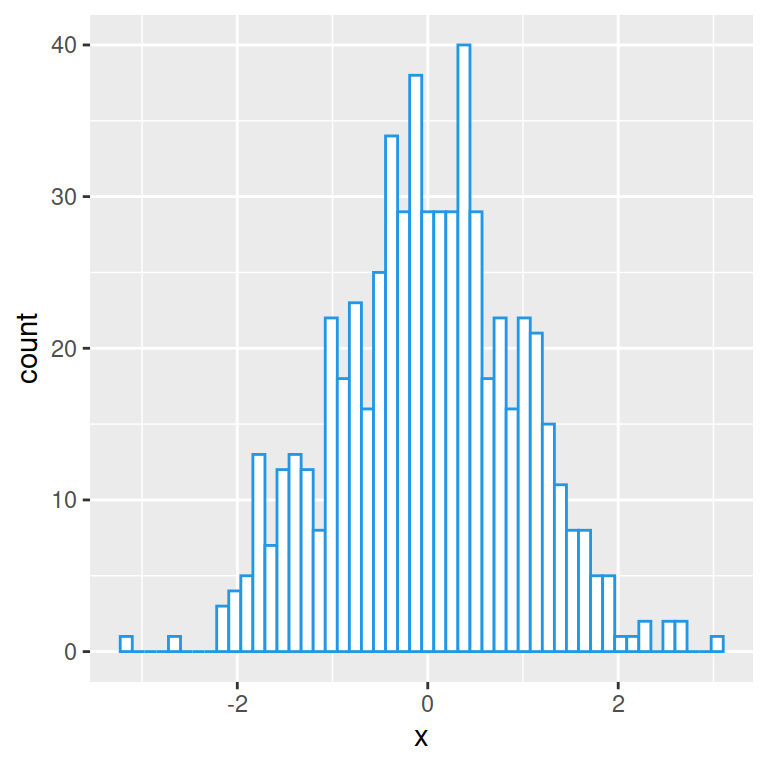
50 bins
# install.packages("ggplot2")
library(ggplot2)

# Data
set.seed(05022021)
x <- rnorm(600)
df <- data.frame(x)

# Histogram bins
ggplot(df, aes(x = x)) +
  geom_histogram(colour = 4, fill = "white",
                 bins = 50)
binwidth argument
The other option is using the binwidth argument of the geom_histogram function. This argument controls the width of each bin along the X-axis. Note that this argument overrides the bin argument.
Binwidth of 0.5
# install.packages("ggplot2")
library(ggplot2)

# Data
set.seed(05022021)
x <- rnorm(600)
df <- data.frame(x)

# Histogram bin width
ggplot(df, aes(x = x)) +
  geom_histogram(colour = 4, fill = "white",
                 binwidth = 0.5)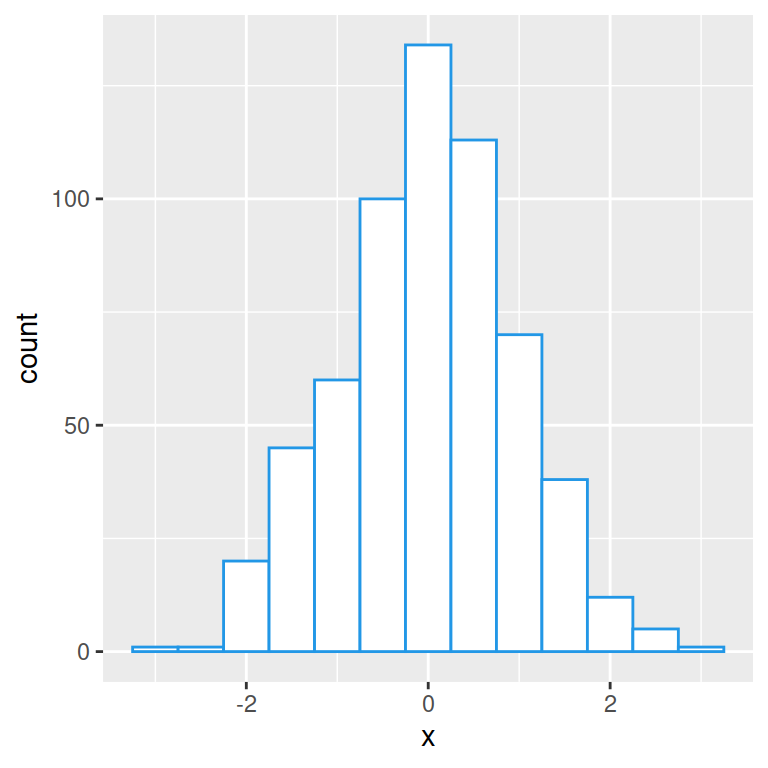
Binwidth of 0.15
# install.packages("ggplot2")
library(ggplot2)

# Data
set.seed(05022021)
x <- rnorm(600)
df <- data.frame(x)

# Histogram bin width
ggplot(df, aes(x = x)) +
  geom_histogram(colour = 4, fill = "white",
                 binwidth = 0.15)
Base R hist function uses the Sturges method to calculate the number of bins, which is a good default.

Master Statistics
Learn statistics from the basics to advanced techniques, clearly explained
Go to site