Sample data
Consider the following data from palmerpenguins package, where the continuous variable is the flipper length of the pinguins and the categorial the penguin species.
# install.packages("palmerpenguins")
library(palmerpenguins)

x <- penguins$flipper_length_mm
g <- as.factor(penguins$species)

p <- data.frame(Flipper.length = x, species = g)
p <- na.omit(p)
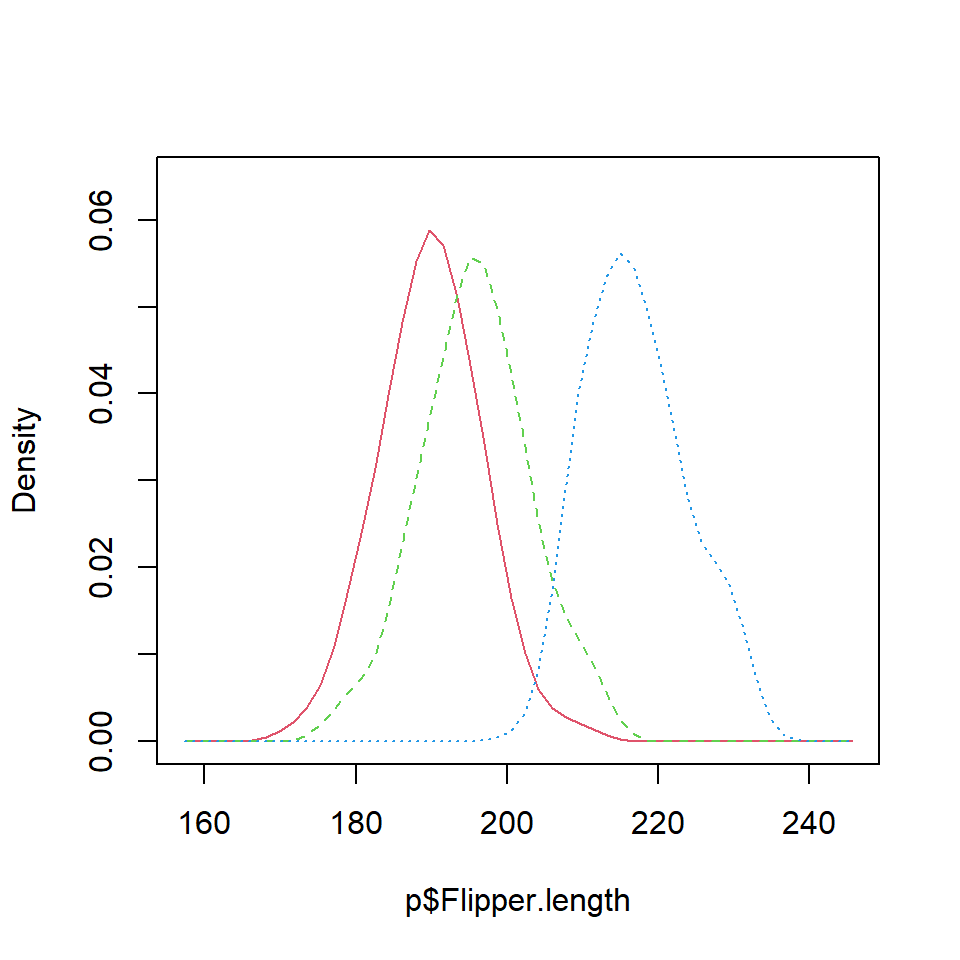
Density comparison with lines
It is possible to estimate the kernel density for each penguin species with the tapply function. Then, you can add the three densities to the same plot. Note that you can select a different kernel and a smoothing parameter than de defaults.
# install.packages("car")
library(car)

# Densities for each group
dens <- tapply(p$Flipper.length, p$species, density)

# Plot
plot(dens$Adelie, xlim = c(min(p$Flipper.length) - 10,
                           max(p$Flipper.length) + 25),
     main = "Density comparison")
lines(dens$Chinstrap, col = 2)
lines(dens$Gentoo, col = 3)

# Legend
legend("topright", legend = levels(p$species),
       lty = 1, col = 1:3)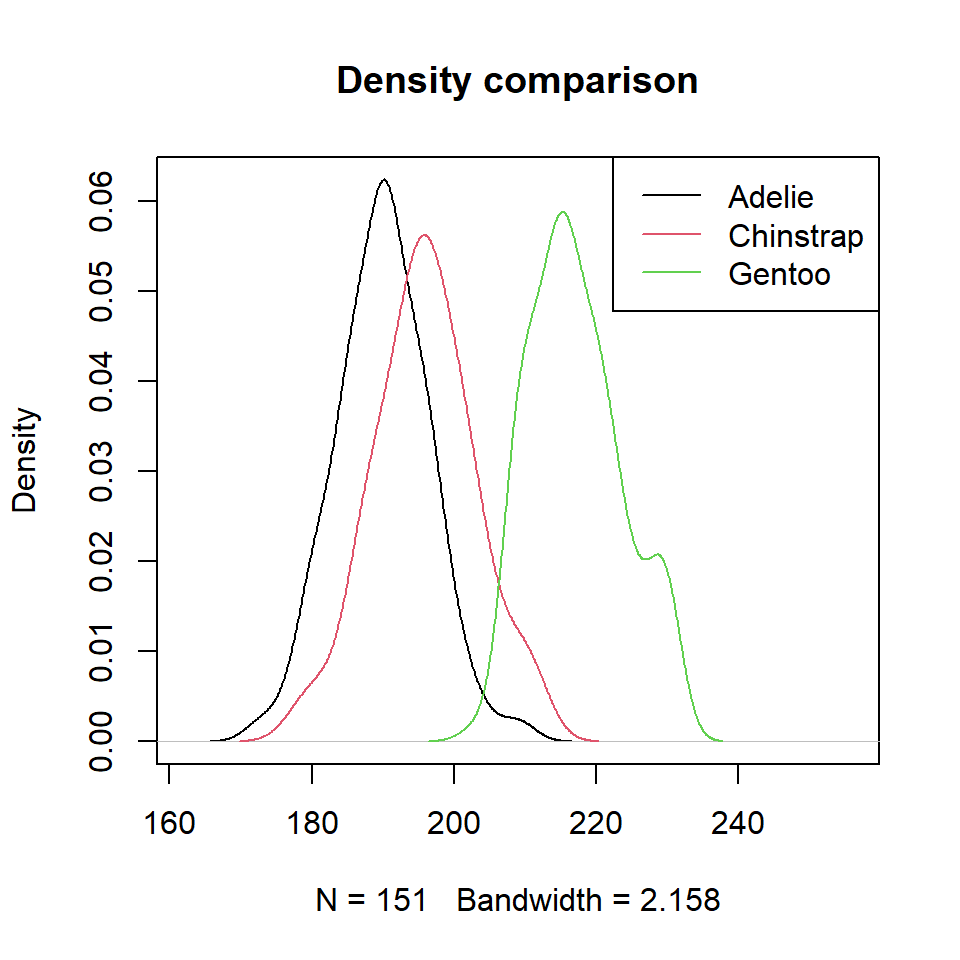
The densityPlot function
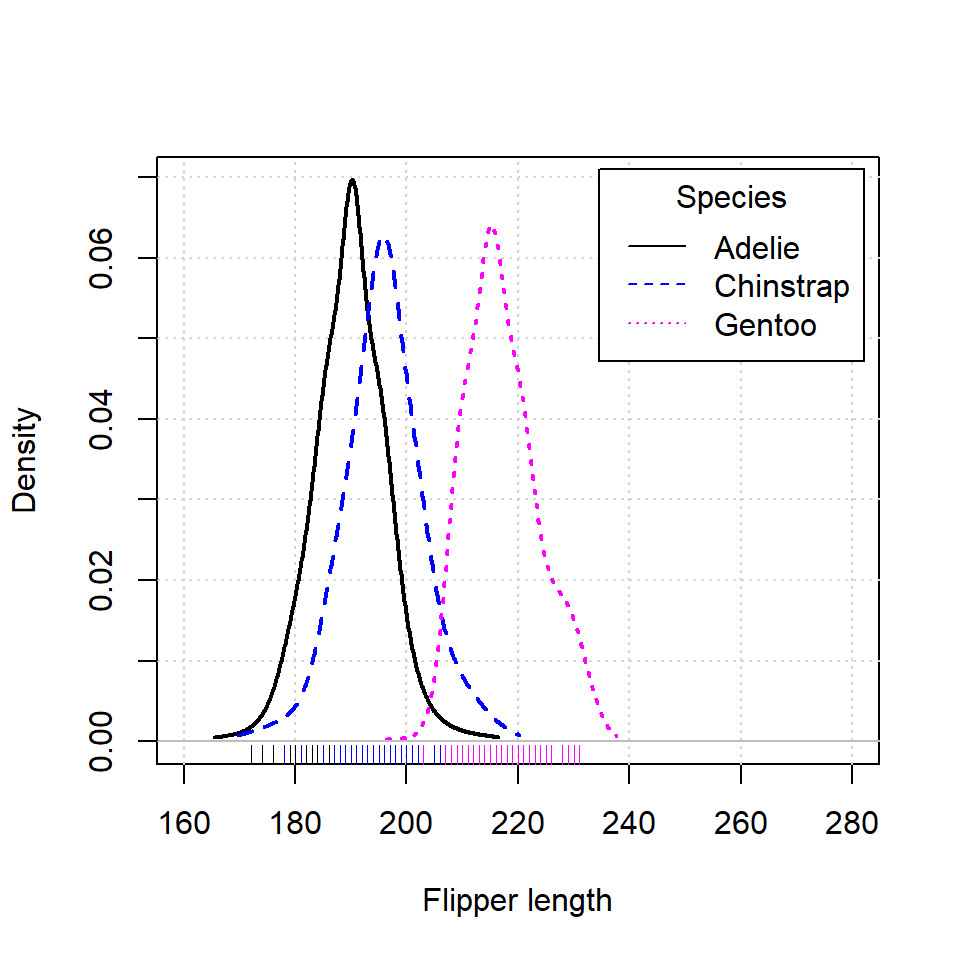
An alternative is using densityPlot from car package. Note that this function uses an adaptive-kernel estimate by default instead of a fixed-bandwidth kernel estimate. If you want the same estimation of the previous section set method = "kernel" as argument.
# install.packages("car")
library(car)

densityPlot(p$Flipper.length ~ p$species,
            legend = list(title = "Species"),
            xlab = "Flipper length",
            xlim = c(160, 280))
The sm.density.compare function
Other option is using the sm.density.compare function from sm library. If you set model = "equal" a permutation test of equality will be computed and boostrap bands will be displayed if the number of groups is two.
# install.packages("sm")
library(sm)

sm.density.compare(x = p$Flipper.length,
                   group = p$species,
                   model = "equal")