Sample data
A raincloud plot combines three layers: a half-violin (density), a boxplot and raw data points. It shows the full distribution without hiding individual observations. We’ll use the iris dataset throughout.
head(iris)
geom_rain()
ggrain provides geom_rain(), which draws all three components in a single call. Map a numeric variable to y and a grouping variable to x.
# install.packages("ggrain")
library(ggrain)

ggplot(iris, aes(x = Species, y = Sepal.Length)) +
  geom_rain()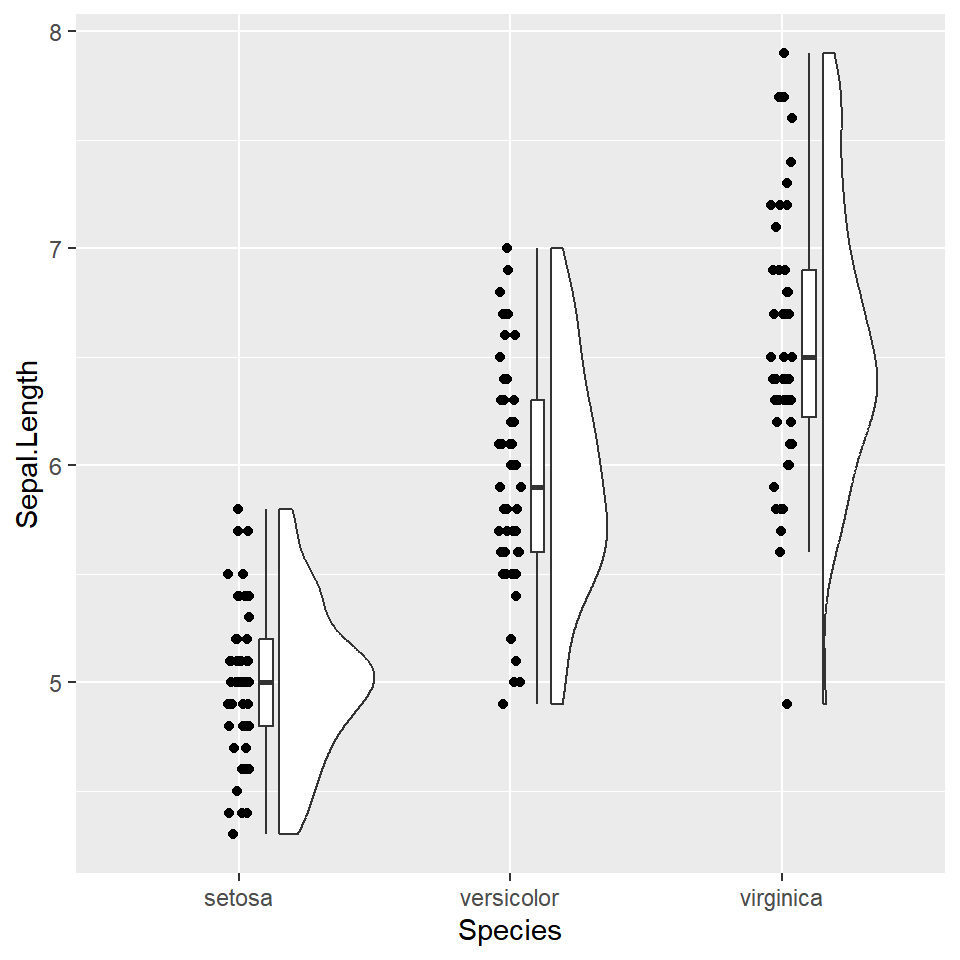
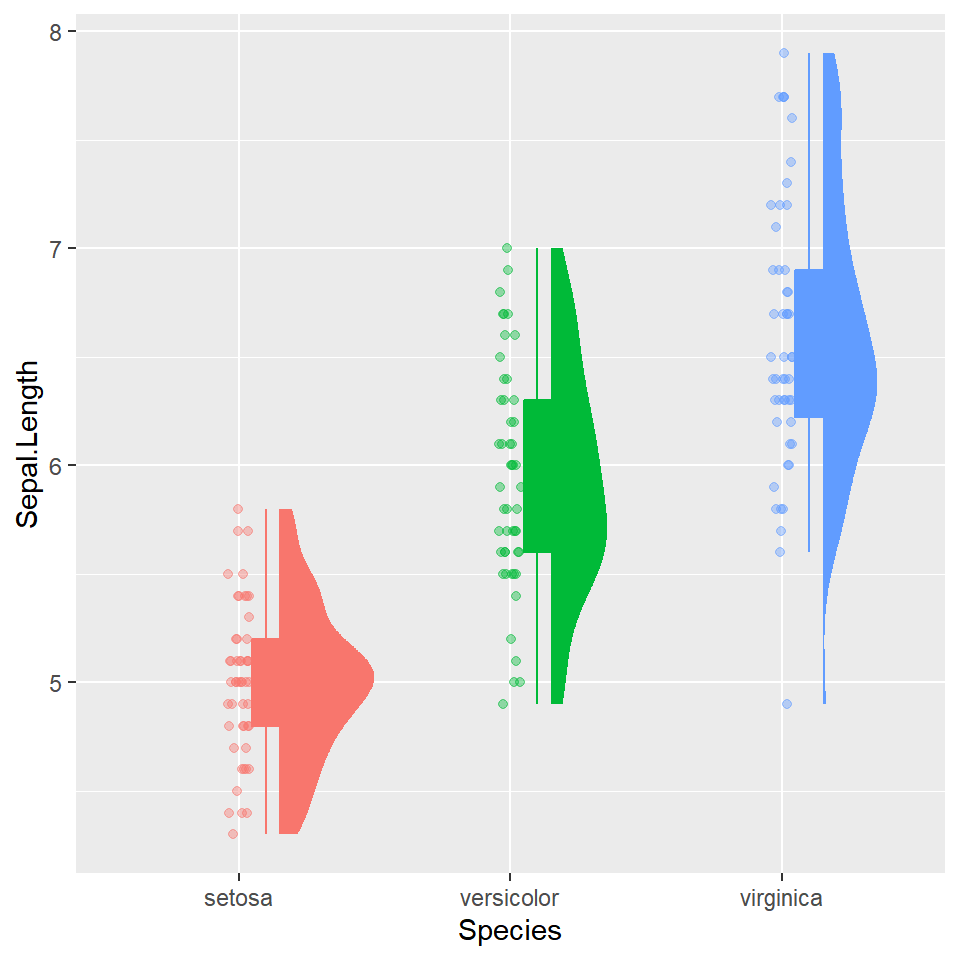
Color by group
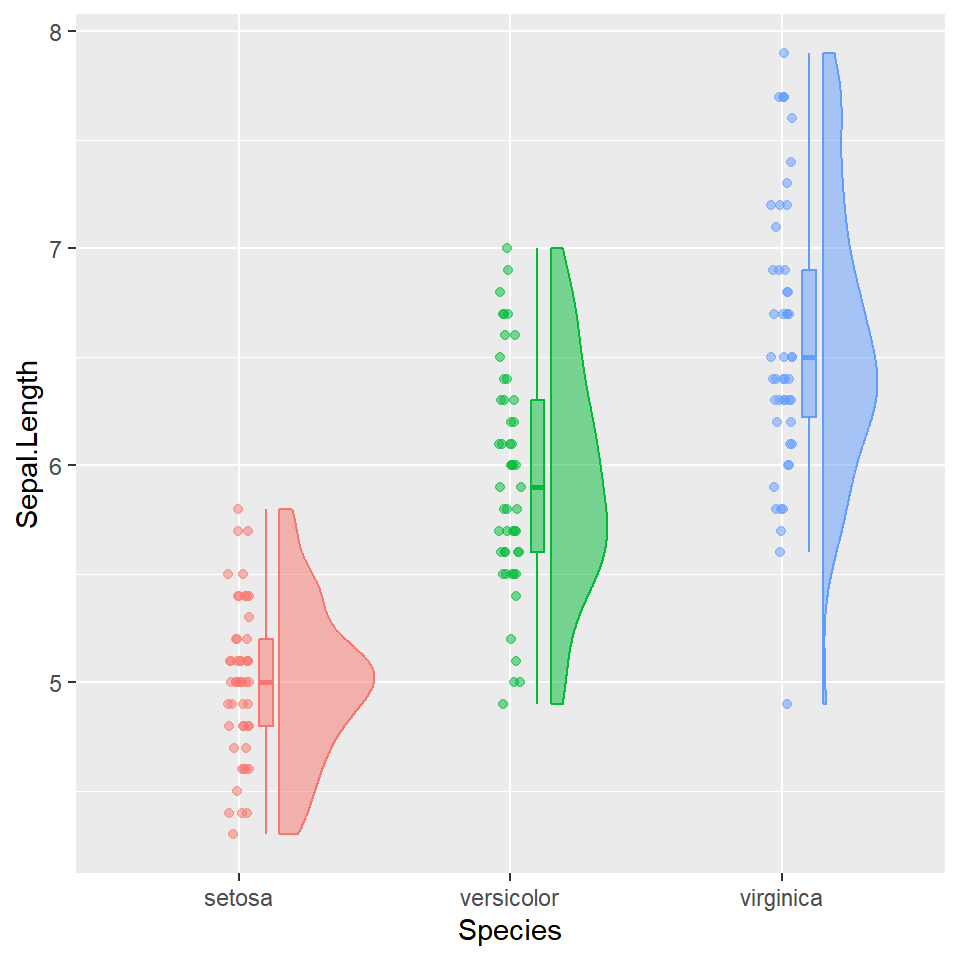
Map the grouping variable to both fill and color in aes(). All three components — violin, box and points — inherit the colors automatically.
# install.packages("ggrain")
library(ggrain)

ggplot(iris, aes(x = Species, y = Sepal.Length,
                 fill = Species, color = Species)) +
  geom_rain(alpha = 0.5) +
  theme(legend.position = "none")
Horizontal
Add coord_flip() to rotate the plot. This works well when group names are long or when you prefer a horizontal layout.
# install.packages("ggrain")
library(ggrain)

ggplot(iris, aes(x = Species, y = Sepal.Length,
                 fill = Species, color = Species)) +
  geom_rain(alpha = 0.5) +
  theme(legend.position = "none") +
  coord_flip()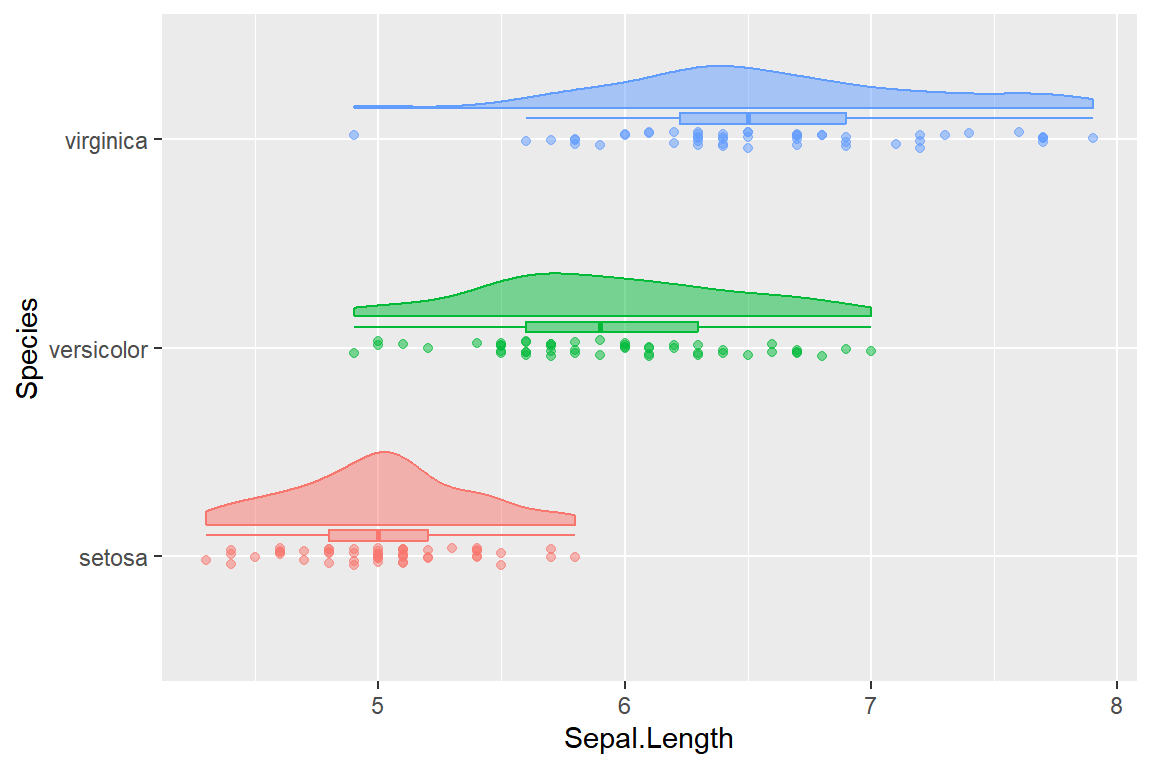
Customizing each component
Pass lists to point.args, violin.args and boxplot.args to control each component independently — size, alpha, width, color and any other ggplot2 aesthetic.
# install.packages("ggrain")
library(ggrain)

ggplot(iris, aes(x = Species, y = Sepal.Length,
                 fill = Species, color = Species)) +
  geom_rain(
    alpha        = 0.5,
    point.args   = list(size = 1.5, alpha = 0.4),
    violin.args  = list(color = NA),
    boxplot.args = list(width = 0.1, outlier.shape = NA)
  ) +
  theme(legend.position = "none")
Manual approach with ggplot2
Without any extra package, combine geom_violin(), geom_boxplot() and geom_jitter() directly. This gives a full violin instead of a half, but covers the same information in the same single plot.
# install.packages("ggplot2")
library(ggplot2)

ggplot(iris, aes(x = Species, y = Sepal.Length, fill = Species)) +
  geom_violin(alpha = 0.5, trim = FALSE) +
  geom_boxplot(width = 0.1, outlier.shape = NA, fill = "white") +
  geom_jitter(width = 0.05, alpha = 0.3, size = 1.2) +
  theme(legend.position = "none")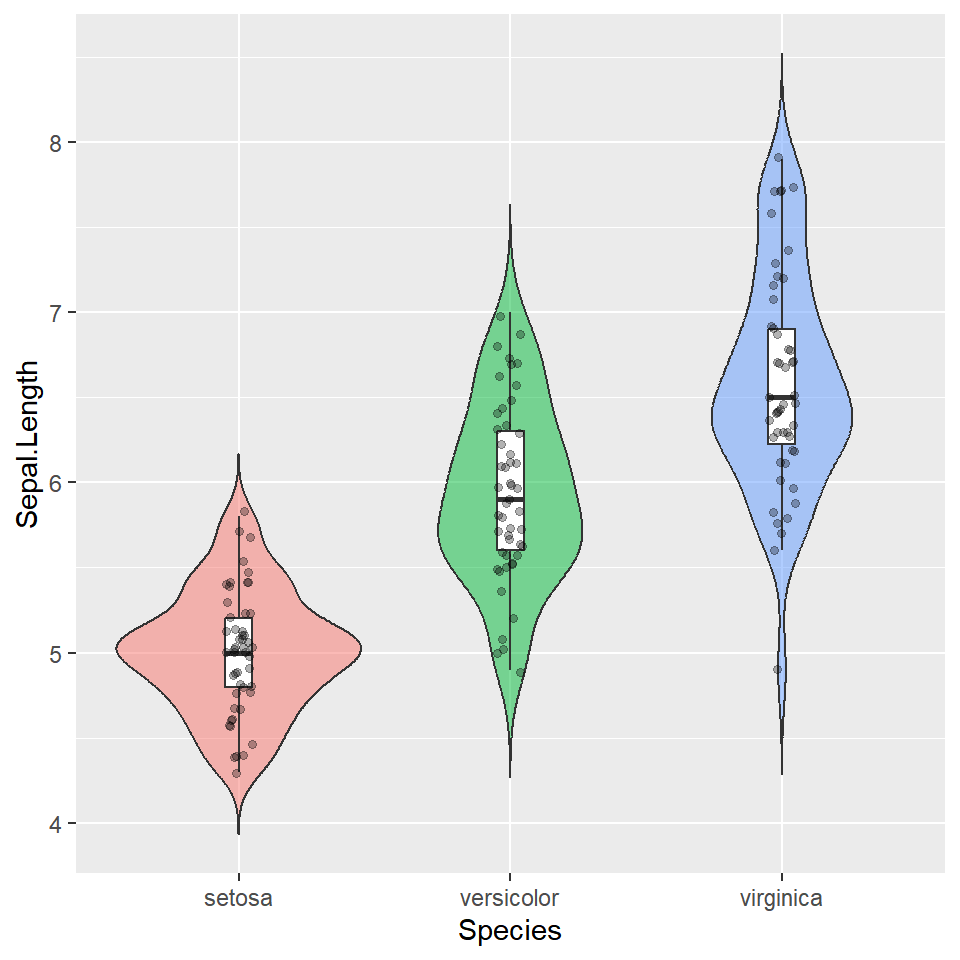

Master Statistics
Learn statistics from the basics to advanced techniques, clearly explained
Go to site