The polygon function
In order to fill an area with a color you can make use of the polygon function. As an example consider the following line that starts and ends in the same X-axis value and use the function to fill the area.
# Data
x <- c(1:7, 7:1)
y <- c(10, 8, 12, 8, 6, 10,
       7, 2, 1, 4, 3, 1, 4, 5)

# Line plot
plot(x, y, type = "l")

# Polygon
polygon(x, y, col = "#65BFFF")

# Points
points(x, y, pch = 19)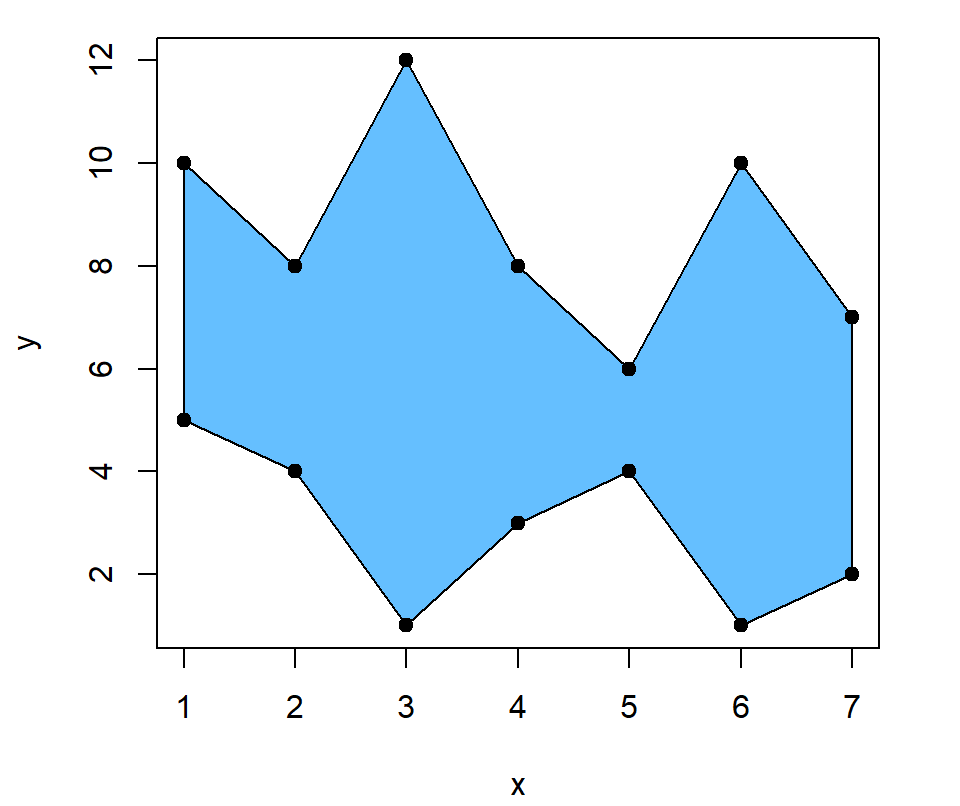
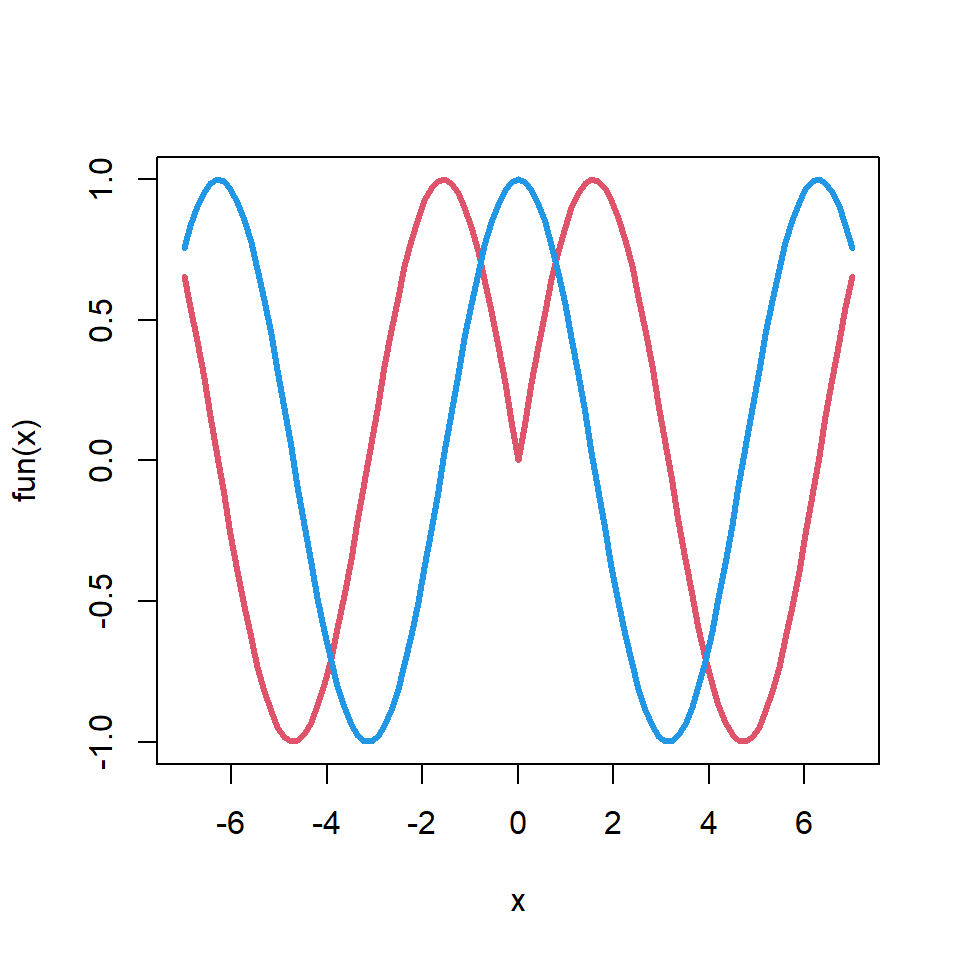
Shade the area between two lines
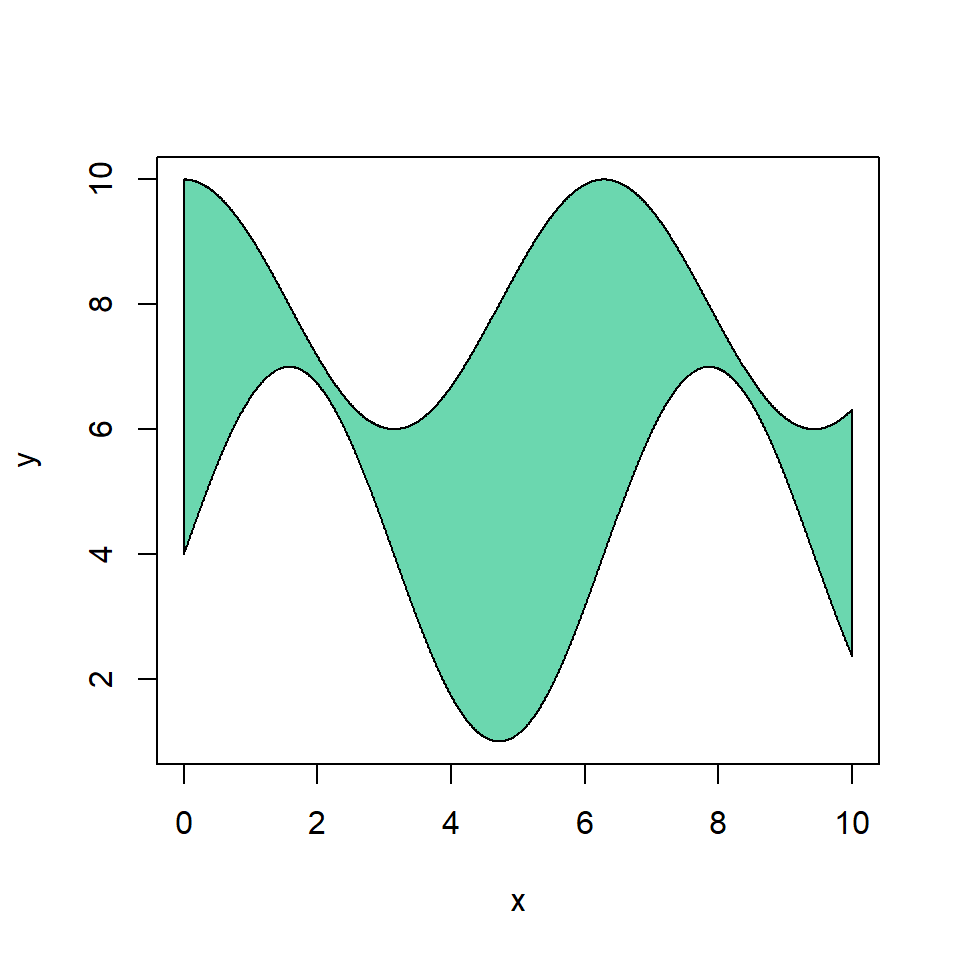
If you have two lines and you want to fill the area between them you will need to create your plot and pass the following to the polygon function:
# Grid of X-axis values
x <- seq(0, 10, 0.01)
# Data
set.seed(1)
y1 <- 2 * cos(x) + 8
y2 <- 3 * sin(x) + 4
# Lines
plot(x, y1, type = "l",
ylim = c(1, 10), ylab = "y")
lines(x, y2, type = "l", col = 2)
# Fill area between lines
polygon(c(x, rev(x)), c(y2, rev(y1)),
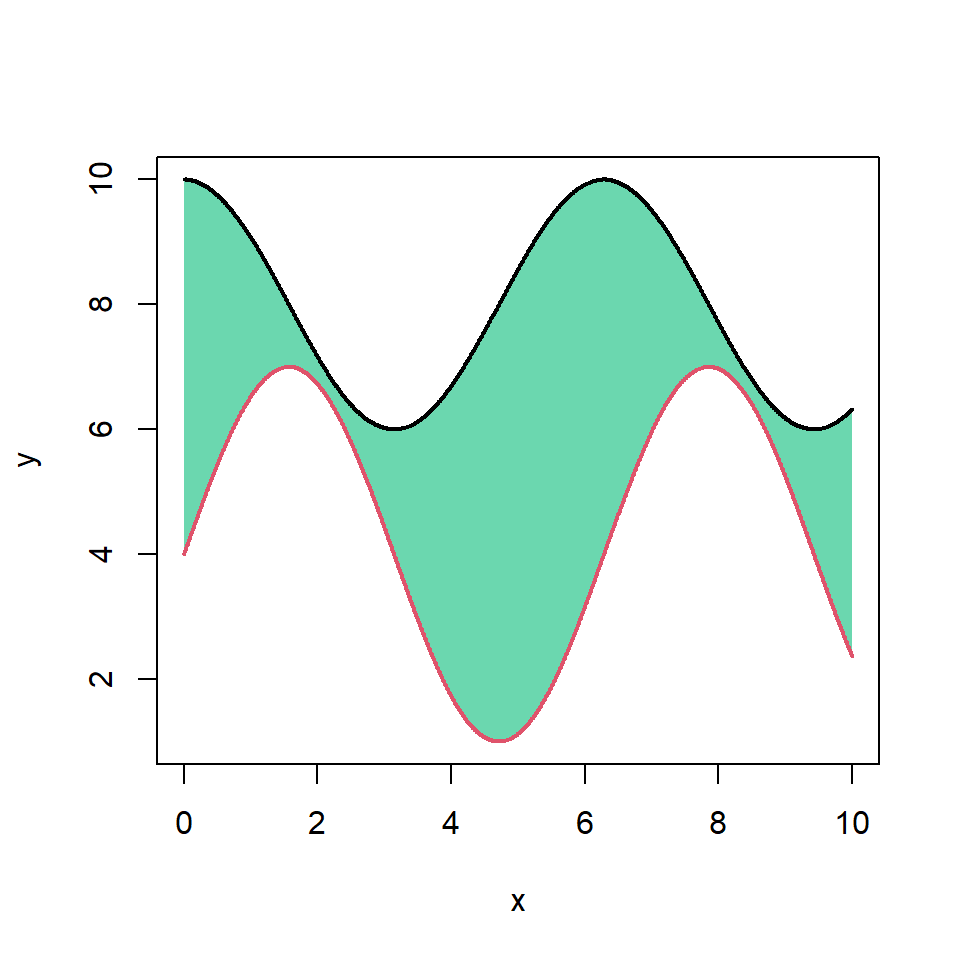
col = "#6BD7AF")However, you might have noticed that the styling of the lines has been overridden by the borders of the polygon. To solve this issue you can add the lines again once you create the area and set lty = 0 to remove the border of the polygon.
# Grid of X-axis values
x <- seq(0, 10, 0.01)

# Data
set.seed(1)
y1 <- 2 * cos(x) + 8
y2 <- 3 * sin(x) + 4

# Lines
plot(x, y1, type = "l",
     ylim = c(1, 10), ylab = "y")
lines(x, y2, type = "l", col = 2)

# Fill area between lines
polygon(c(x, rev(x)), c(y2, rev(y1)),
        col = "#6BD7AF", lty = 0)

# Redraw the lines
lines(x, y1, col = 1, lwd = 2)
lines(x, y2, col = 2, lwd = 2)
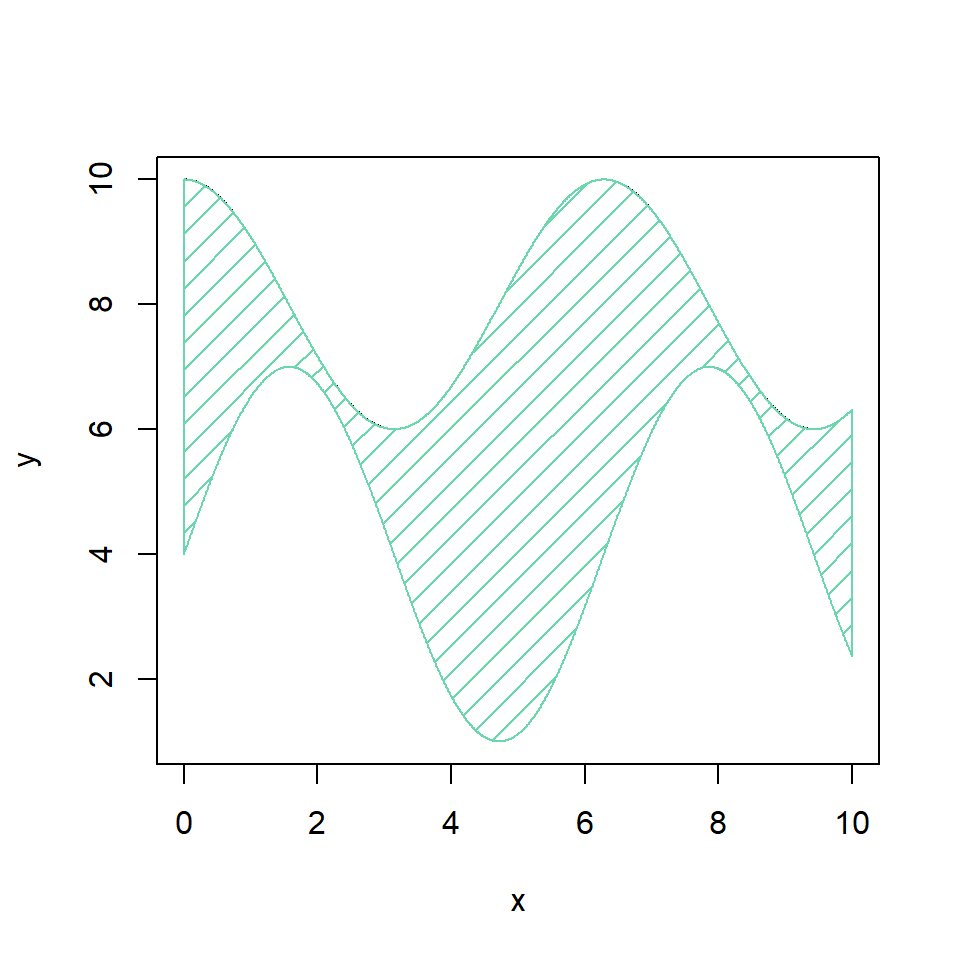
Instead of filling the area with a color you can also add shading lines, specifying its density with density and the angle of the lines with angle. Recall to add the curves again if you want them with a different color.
# Grid of X-axis values
x <- seq(0, 10, 0.01)
# Data
set.seed(1)
y1 <- 2 * cos(x) + 8
y2 <- 3 * sin(x) + 4
# Lines
plot(x, y1, type = "l",
ylim = c(1, 10), ylab = "y")
lines(x, y2, type = "l", col = 2)
# Area with shading lines
polygon(c(x, rev(x)), c(y2, rev(y1)),
col = "#6BD7AF",
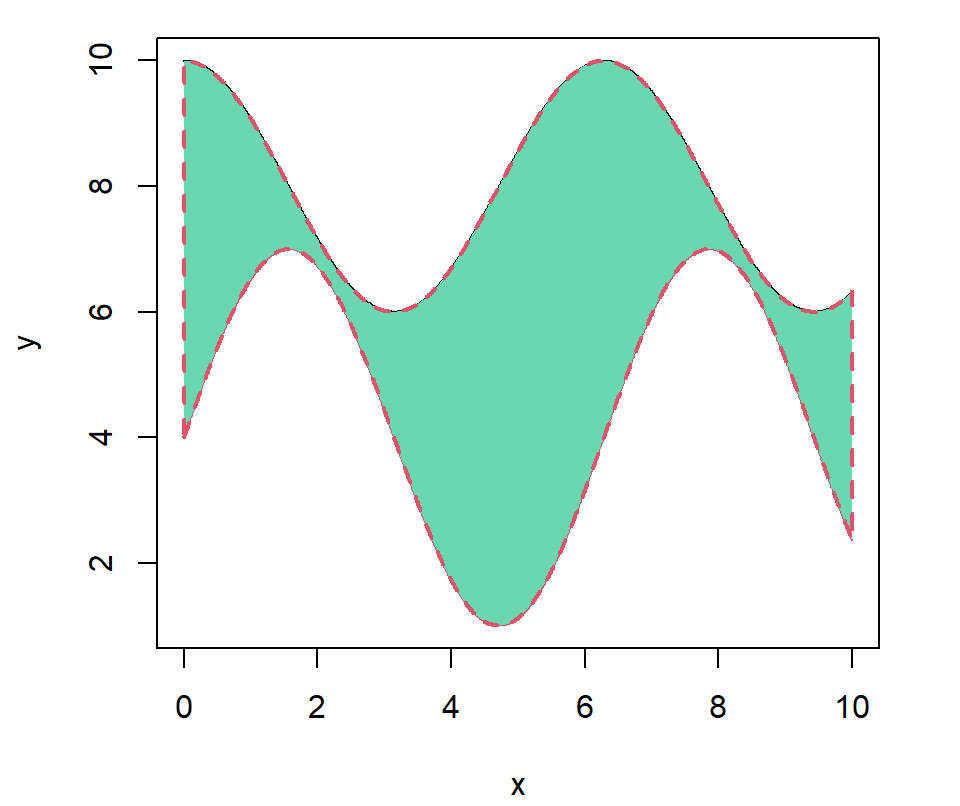
density = 10, angle = 45)You can also customize the color, the line type and the line width of the border of the polygon with border, lty and lwd, respectively.
# Grid of X-axis values
x <- seq(0, 10, 0.01)

# Data
set.seed(1)
y1 <- 2 * cos(x) + 8
y2 <- 3 * sin(x) + 4

# Lines
plot(x, y1, type = "l",
     ylim = c(1, 10), ylab = "y")
lines(x, y2, type = "l", col = 2)

polygon(c(x, rev(x)), c(y2, rev(y1)),
        col = "#6BD7AF", border = 2,
        lwd = 2, lty = 2)
Shade a specific area between the lines
Other option is shading an area for a range of X-axis values. For that purpose you can use the following code and change the xmin and xmax variables to fit your needs (obviously xmin must be lower than xmax).
# Grid of X-axis values
x <- seq(0, 10, 0.01)

# Data
set.seed(1)
y1 <- 2 * cos(x) + 8
y2 <- 3 * sin(x) + 4

# Lines
plot(x, y1, type = "l",
     ylim = c(1, 10), ylab = "y")
lines(x, y2, type = "l", col = 2)

# Min and max X values
xmin <- 2
xmax <- 8

polygon(c(x[x >= xmin & x <= xmax],
          rev(x[x >= xmin & x <= xmax])),
        c(y2[x >= xmin & x <= xmax],
          rev(y1[x >= xmin & x <= xmax])),
        col = "#6BD7AF")

lines(x, y2, col = 2)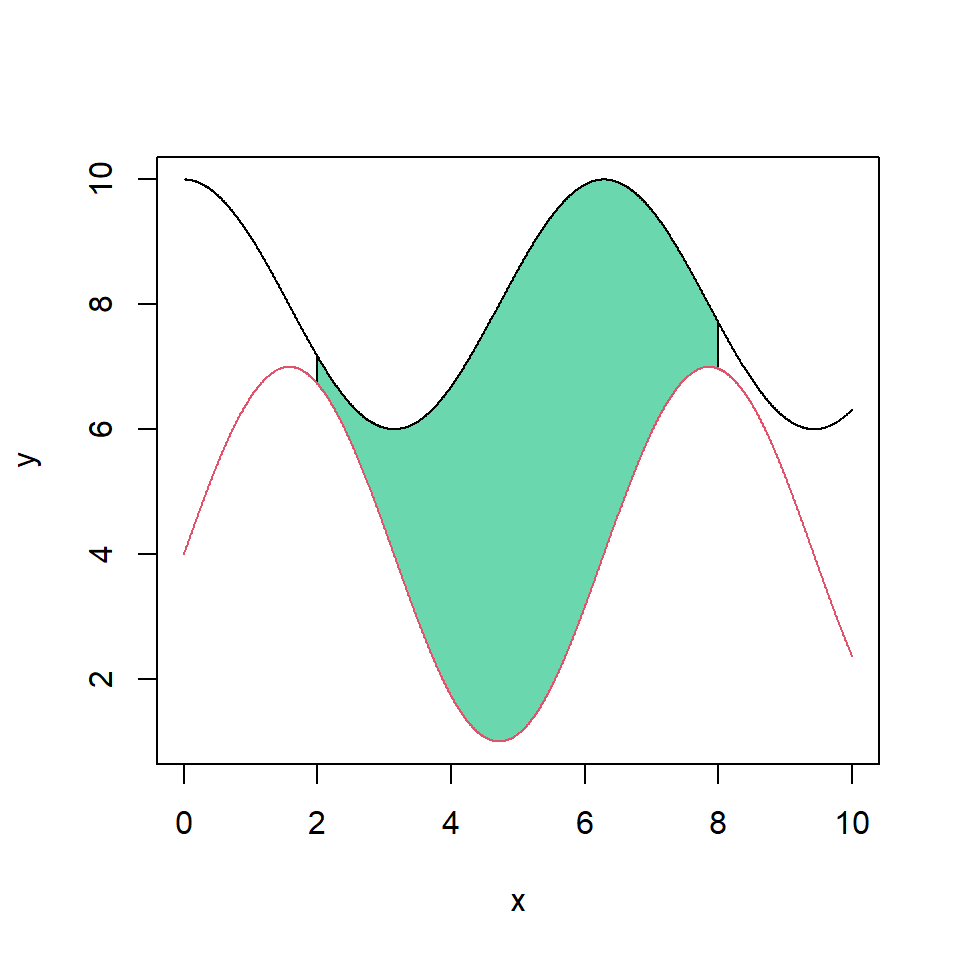
Shade the area between the curves with a continuous palette
Finally, if you want to fill the area with a continuous color palette you can loop through the grid of axis values and modify the border color on each iteration. Note that the grid of values must be dense to create the gradient effect.

# Grid of X-axis values
x <- seq(0, 10, 0.01)

# Data
set.seed(1)
y1 <- 2 * cos(x) + 8
y2 <- 3 * sin(x) + 4

# Lines
plot(x, y1, type = "l",
     ylim = c(1, 10), ylab = "y")
lines(x, y2, type = "l")

# Fill with palette
l <- length(x)
color <- hcl.colors(l, "TealGrn") # Palette
for (i in 1:l) {
    polygon(c(x[i], rev(x[i])),
            c(y2[i], rev(y1[i])),
            border = color[i], col = NA)
}

# Override the lines
lines(x, y1)
lines(x, y2)
Master Statistics
Learn statistics from the basics to advanced techniques, clearly explained
Go to site