Sample data set
Consider the following data frame that contains the price of three european stock indices.
df <- as.data.frame(EuStockMarkets[, 1:3])Area chart of a single line
In order to create an area chart with a column of the input data frame you can pass the dates (if available) or an index to x and the variable of interest to y and then use geom_area.
# install.packages("ggplot2")
library(ggplot2)

# Area chart
ggplot(df, aes(x = seq_along(SMI), y = SMI)) +
  geom_area()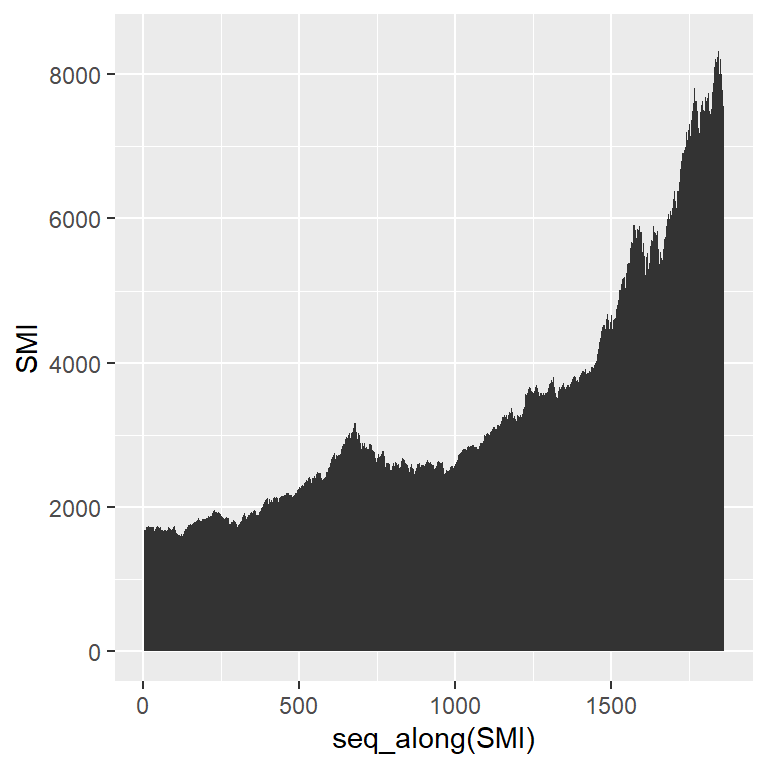
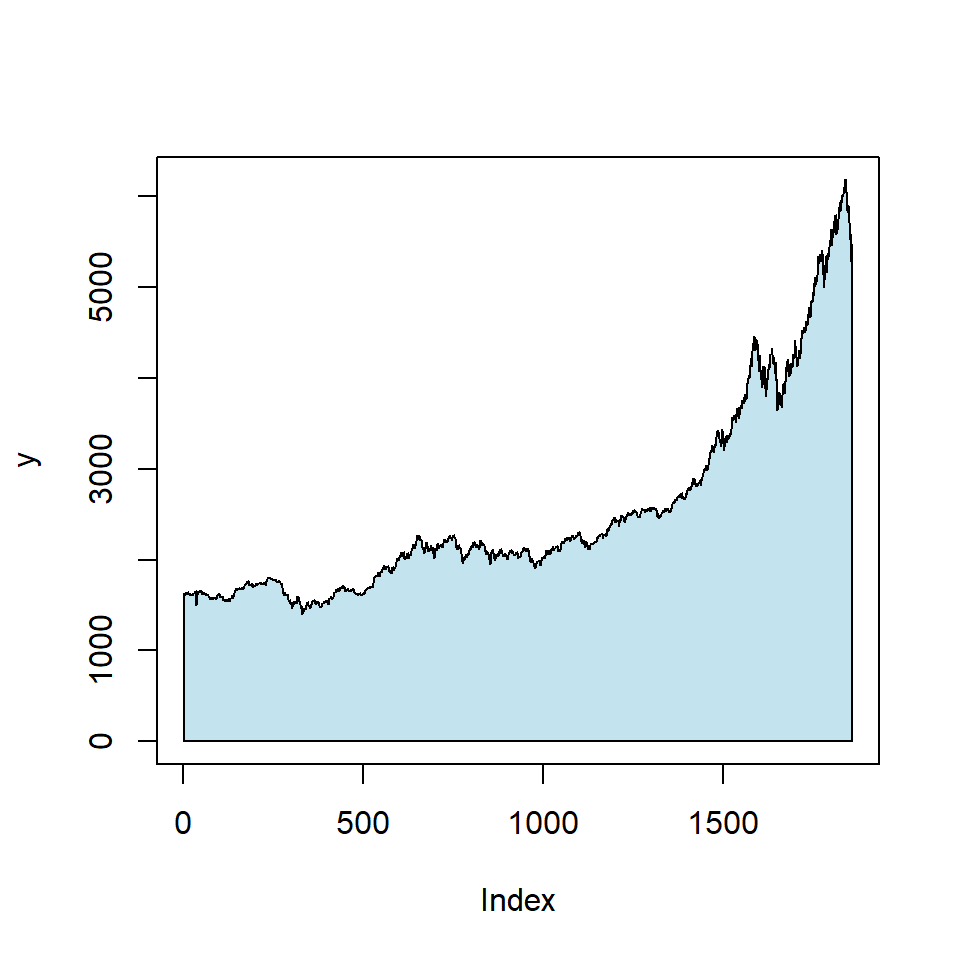
Fill the area
By default the area will be filled with a very dark gray color. However, you can change it passing a color to the fill argument.
# install.packages("ggplot2")
library(ggplot2)

# Area chart
ggplot(df, aes(x = seq_along(SMI), y = SMI)) +
  geom_area(fill = 4)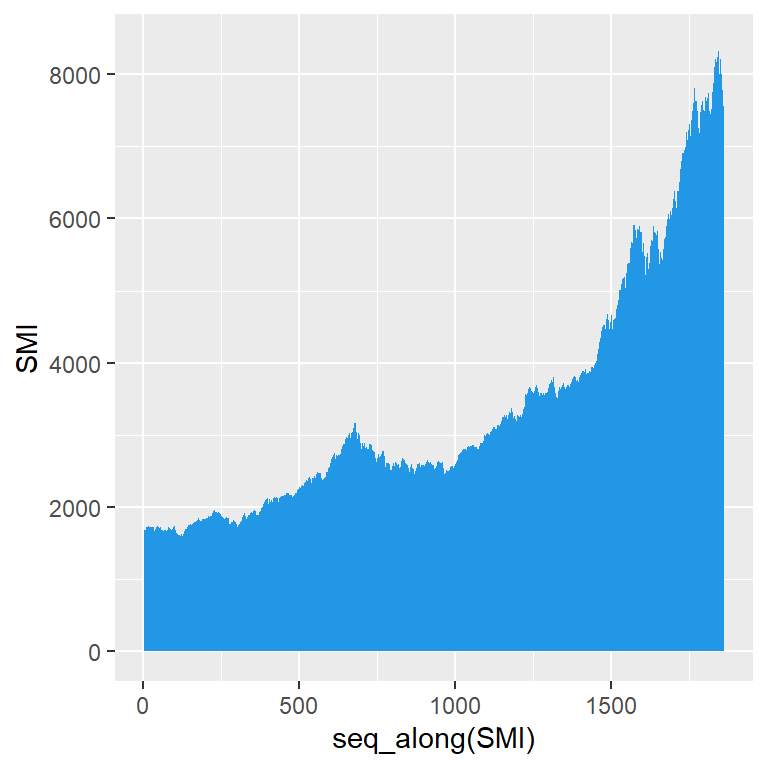
Transparency of the area
You can also change the transparency of the area with the alpha argument of the function.
# install.packages("ggplot2")
library(ggplot2)

# Area chart
ggplot(df, aes(x = seq_along(SMI), y = SMI)) +
  geom_area(fill = 4,
            alpha = 0.5)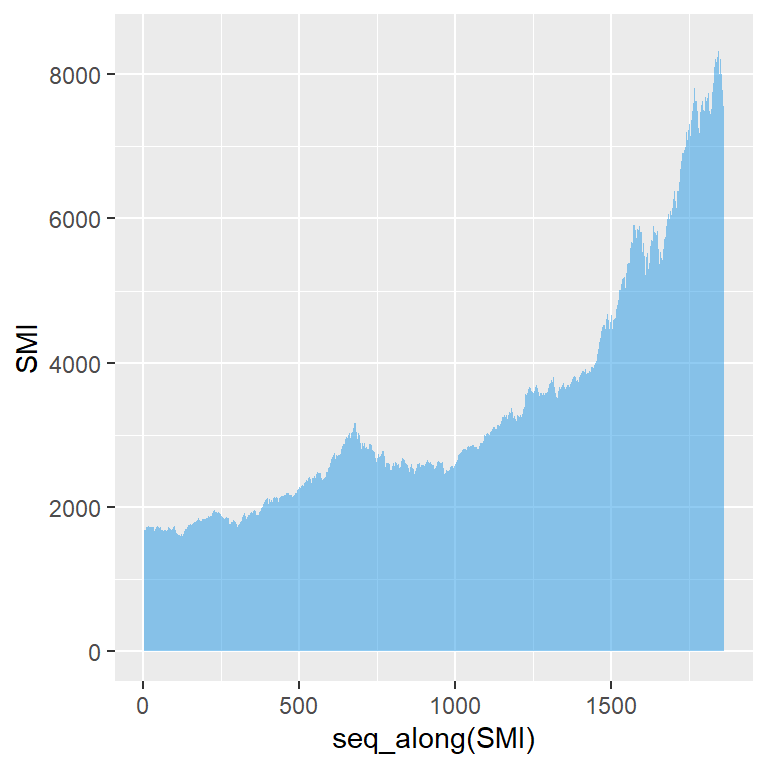
Line customization
The upper line of the area can be customized with several arguments, such as color, lwd or linetype.
# install.packages("ggplot2")
library(ggplot2)

# Area chart
ggplot(df, aes(x = seq_along(SMI), y = SMI)) +
  geom_area(fill = 4,
            alpha = 0.5,
            color = 1,    # Line color
            lwd = 0.5,    # Line width
            linetype = 1) # Line type
Area chart of several lines
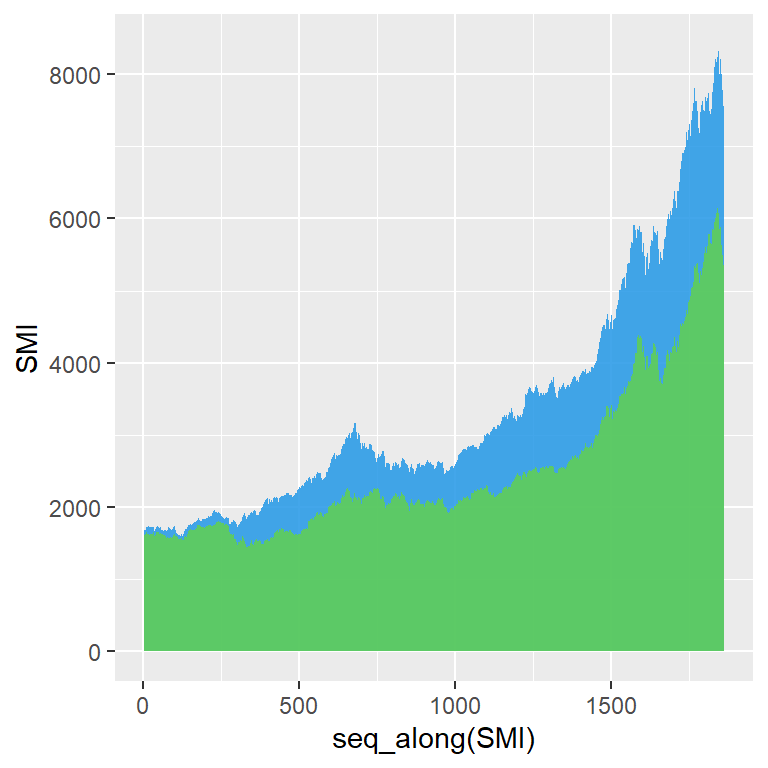
In case you want to add more variables you will need to specify the aesthetics inside each geom_area for each variable. Note that if the number of areas to add is more than two or three you should consider creating a stacked area chart.
# install.packages("ggplot2")
library(ggplot2)

# Area chart
ggplot(df) +
  geom_area(aes(x = seq_along(SMI), y = SMI),
            fill = 4, alpha = 0.85) +
  geom_area(aes(x = seq_along(DAX), y = DAX),
            fill = 3, alpha = 0.85)
Master Statistics
Learn statistics from the basics to advanced techniques, clearly explained
Go to site