Sample data set
The data set used in the following examples is a subset of the longley data set, where the x variable represents the year and the y the measure of several variables for each year.
# Sample data set
df <- longley

# X-axis variable
x <- df$Year

# Variables to be stacked
y <- df[, c(1, 2, 3, 4, 5, 7)]
Percentage stacked area chart
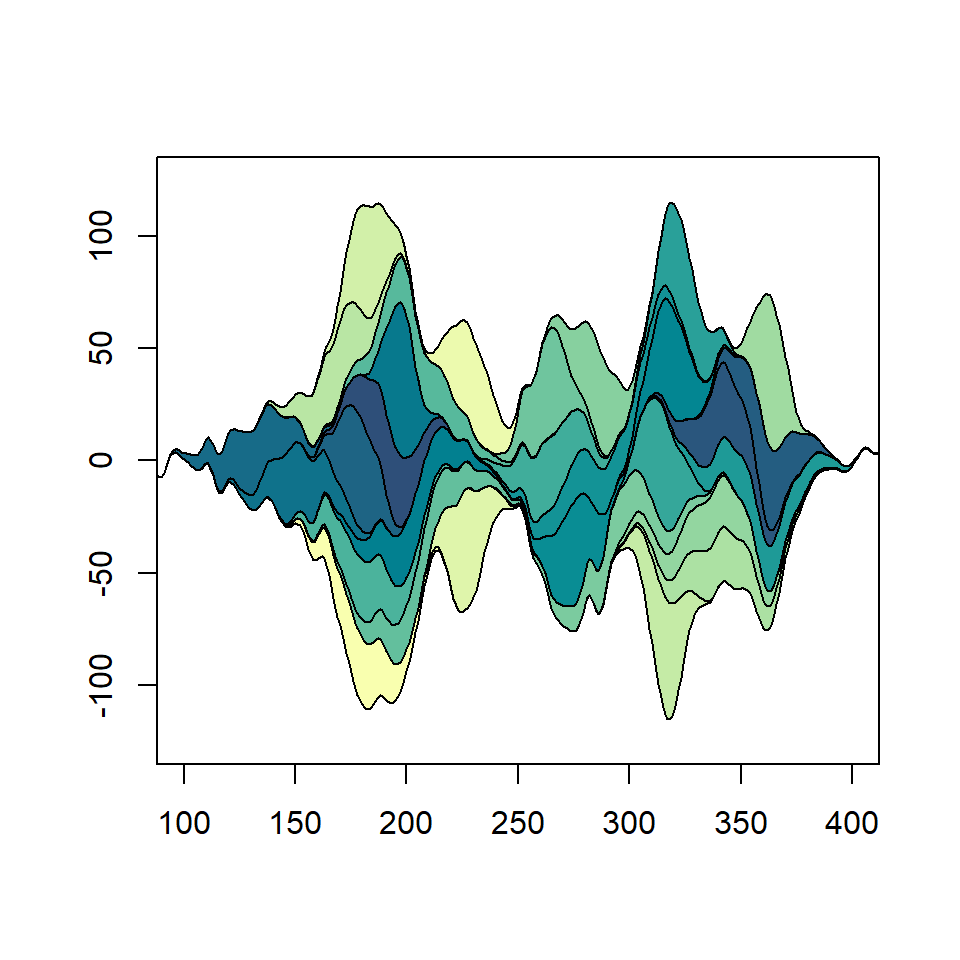
In order to create a percentage stacked area plot in R (also known as 100% stacked area chart) you can make use of the areaplot function of the package of the same name. You just need to pass your data an set prop = TRUE.
# install.packages("areaplot")
library(areaplot)

# Percentage stacked area chart
areaplot(x, y, prop = TRUE)

# Equivalent to:
areaplot(. ~ Year, data = df, prop = TRUE)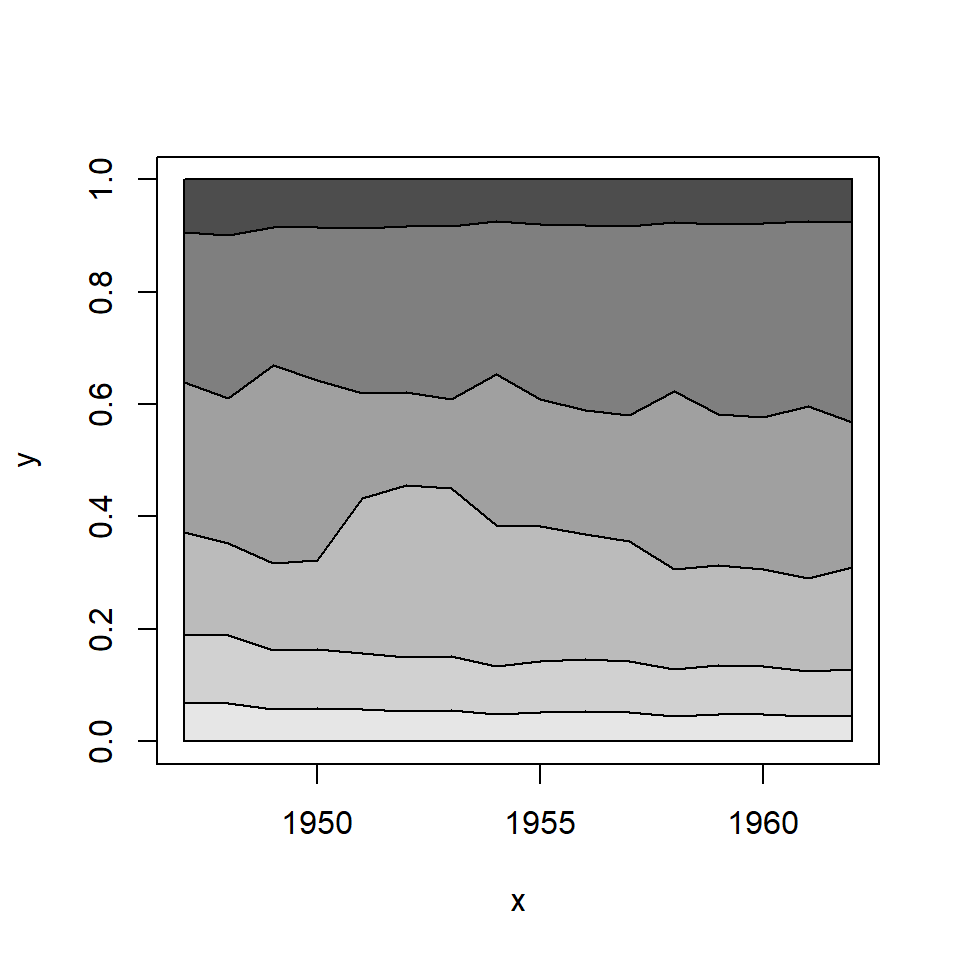
Color customization
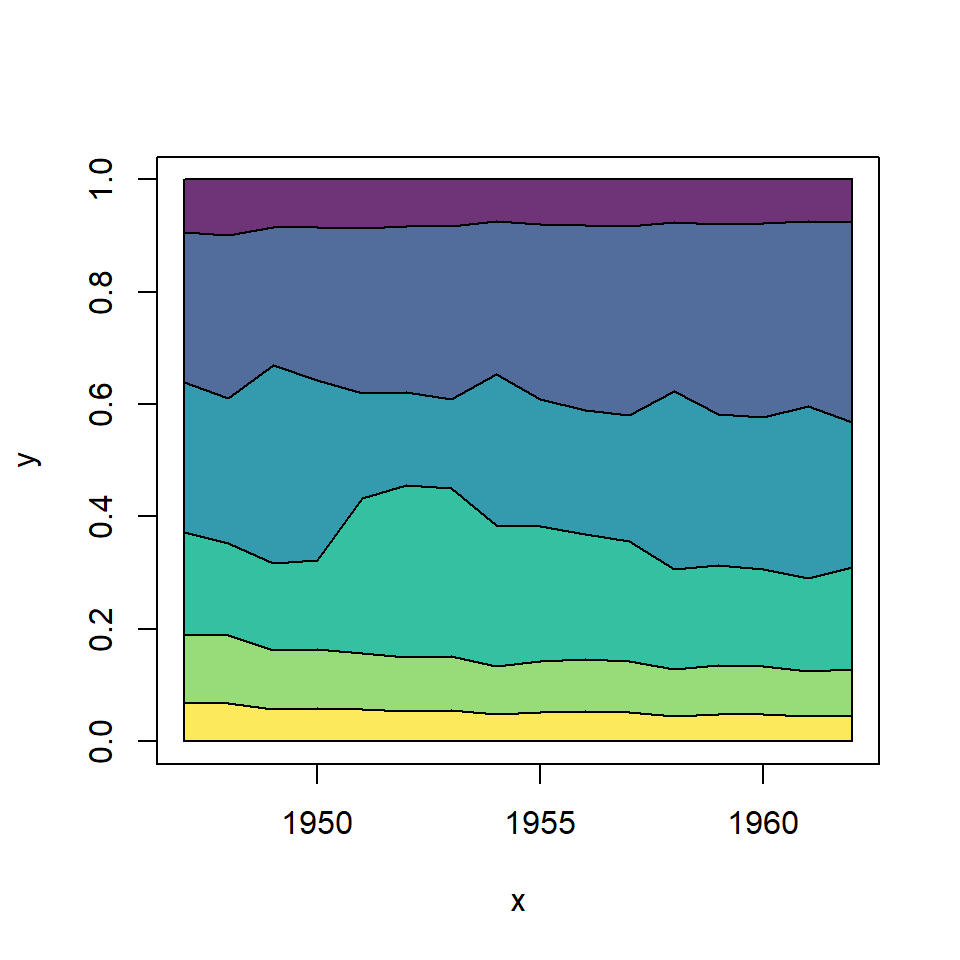
You can pass a vector of colors to the col argument to customize the default gray scale. In the following example we are creating a vector of colors of the viridis color palette with a 0.8 level of transparency.
# install.packages("areaplot")
library(areaplot)

# Colors
cols <- hcl.colors(6, palette = "viridis", alpha = 0.8)

# Stacked area chart with custom colors
areaplot(x, y, prop = TRUE,
         col = cols)
The function allows passing additional arguments to the polygon function (used by the package). This allows customizing the border, line width and line type of the stacked areas.
# install.packages("areaplot")
library(areaplot)

# Colors
cols <- hcl.colors(6, palette = "ag_Sunset")

# Stacked area chart with custom borders
areaplot(x, y, prop = TRUE, col = cols,
         border = "white",
         lwd = 1,
         lty = 1)
Adding a legend
The function also provides a way to add an automatic legend setting legend = TRUE. Additional arguments of the legend function can be passed through args.legend as a list.
# install.packages("areaplot")
library(areaplot)

# Colors
cols <- hcl.colors(6, palette = "PinkYl")

areaplot(x, y, prop = TRUE, col = cols,
         legend = TRUE,
         args.legend = list(x = "topleft", cex = 0.65,
                            bg = "white", bty = "o"))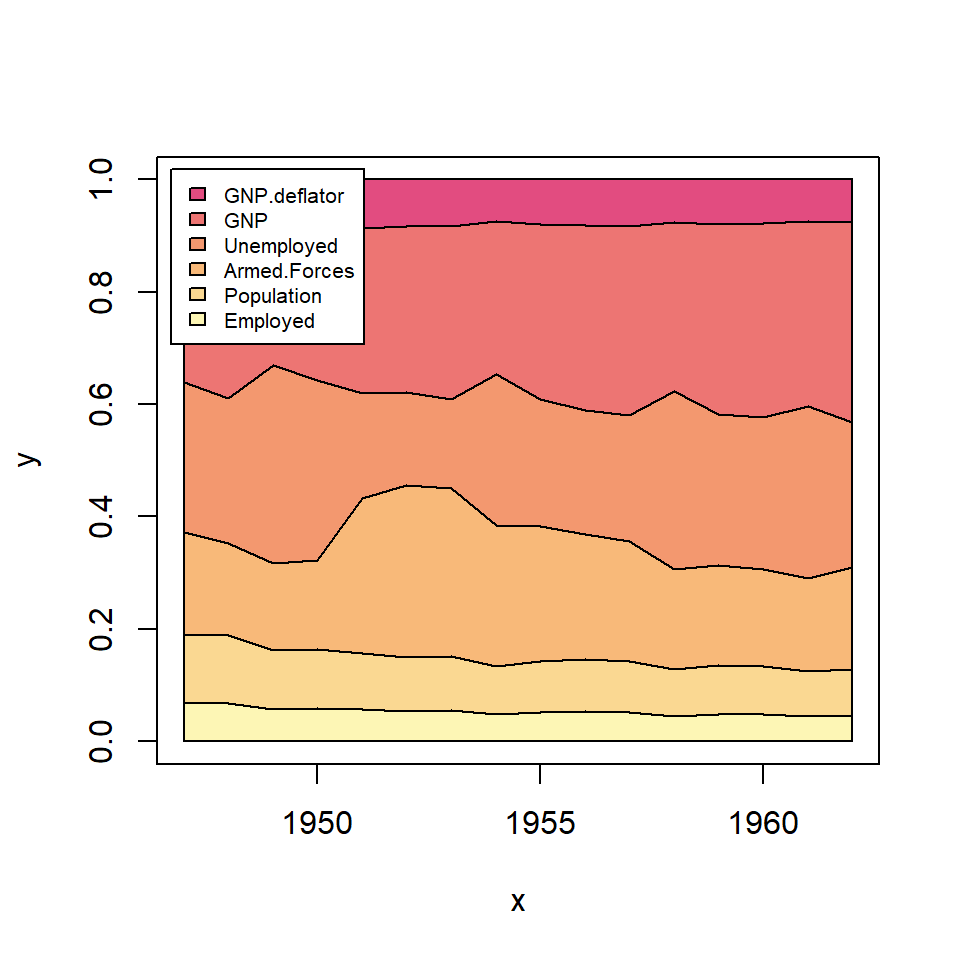

Master Statistics
Learn statistics from the basics to advanced techniques, clearly explained
Go to site