Basic line charts with geom_line
Given a data frame with a numerical variable x and a numerical variable y representing the value for each observation it is possible to create a line chart in ggplot with geom_line as follows.
# install.packages("ggplot2")
library(ggplot2)

# Data
set.seed(1)
x <- 1:20
y <- x ^ 2 + runif(20, 0, 100)
df <- data.frame(x = x, y = y)

ggplot(df, aes(x = x, y = y)) +
  geom_line()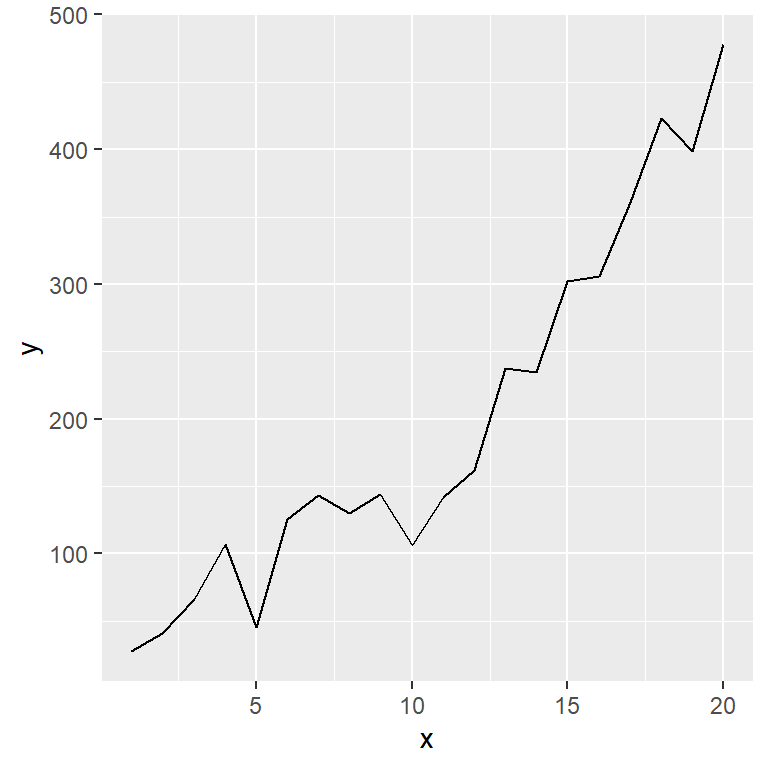
Adding points
If you add geom_point to the plot a point will be added for each observation.
# install.packages("ggplot2")
library(ggplot2)

# Data
set.seed(1)
x <- 1:20
y <- x ^ 2 + runif(20, 0, 100)
df <- data.frame(x = x, y = y)

ggplot(df, aes(x = x, y = y)) +
  geom_line() +
  geom_point()
Line as an arrow
If your data represents a trend or a path you can end the line with an arrow, passing the arrow funtion to the arrow argument. Type ?arrow for additional arguments.
# install.packages("ggplot2")
library(ggplot2)

# Data
set.seed(1)
x <- 1:20
y <- x ^ 2 + runif(20, 0, 100)
df <- data.frame(x = x, y = y)

ggplot(df, aes(x = x, y = y)) +
geom_line(arrow = arrow())![]()
Stairstep plots with geom_step
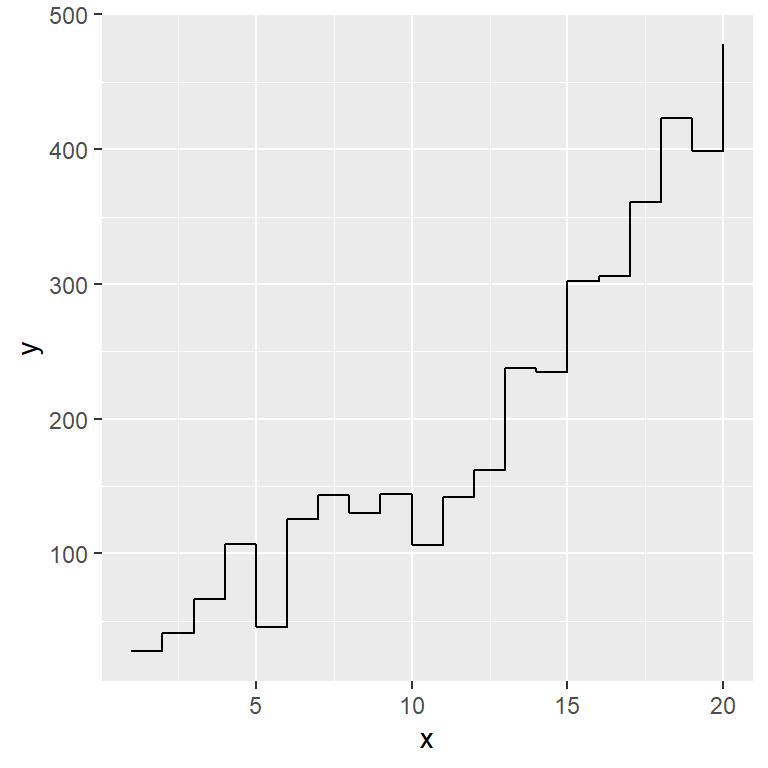
First horizontal
An alternative geom is geom_step, which will create a stairstep plot where the first line is horizontal by default.
# install.packages("ggplot2")
library(ggplot2)

# Data
set.seed(1)
x <- 1:20
y <- x ^ 2 + runif(20, 0, 100)
df <- data.frame(x = x, y = y)

ggplot(df, aes(x = x, y = y)) +
  geom_step()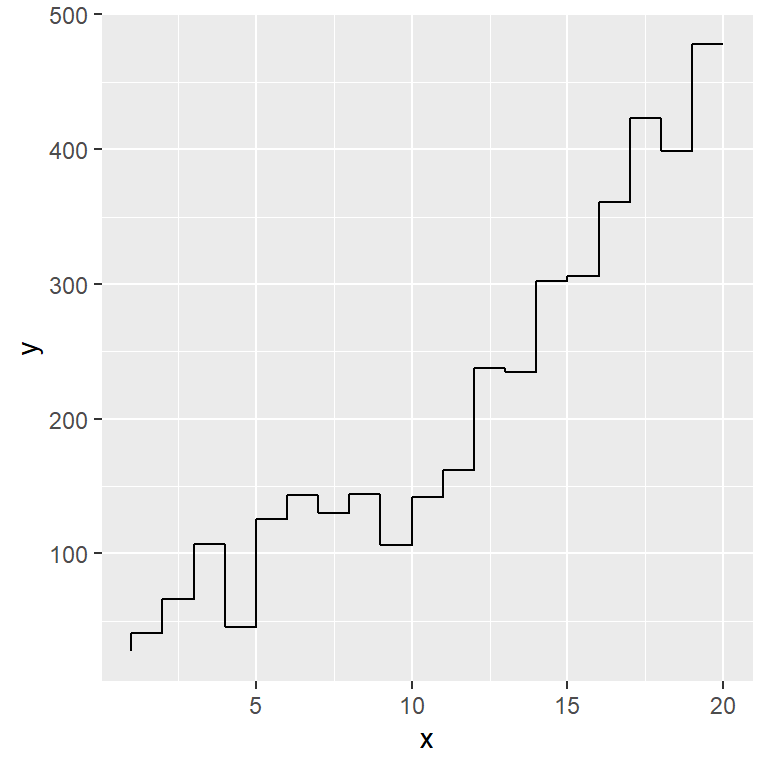
First vertical
To set the first line vertical pass the string "vh" to the direction argument of the geom.
# install.packages("ggplot2")
library(ggplot2)

# Data
set.seed(1)
x <- 1:20
y <- x ^ 2 + runif(20, 0, 100)
df <- data.frame(x = x, y = y)

ggplot(df, aes(x = x, y = y)) +
  geom_step(direction = "vh")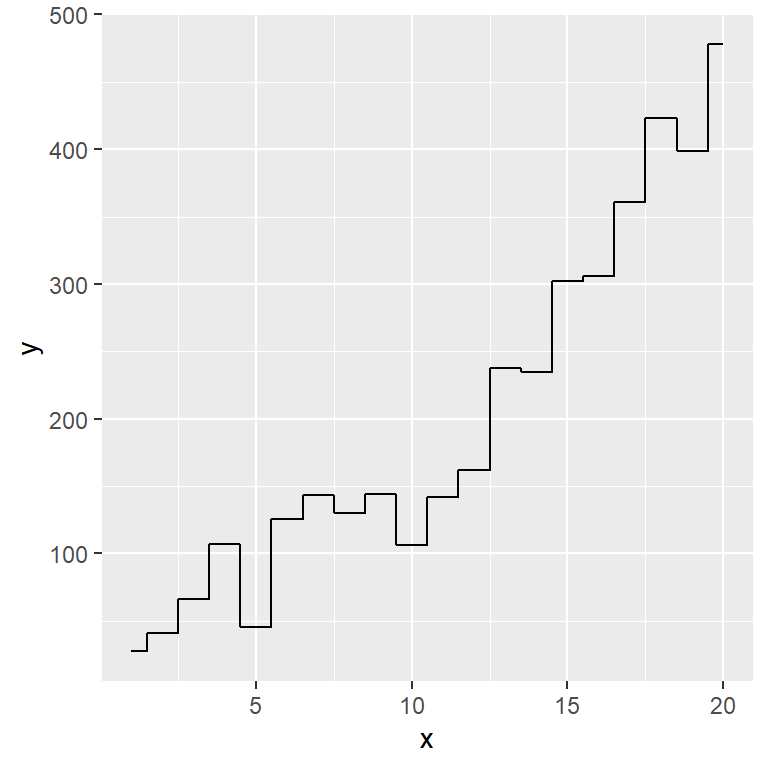
Step half-way between values
Other possible option is setting "mid", for step half-way between adjacent X-axis values.
# install.packages("ggplot2")
library(ggplot2)

# Data
set.seed(1)
x <- 1:20
y <- x ^ 2 + runif(20, 0, 100)
df <- data.frame(x = x, y = y)

ggplot(df, aes(x = x, y = y)) +
  geom_step(direction = "mid")
Line colors and styles
The color, lwd and linetype arguments can be used to modify the color, width and the type of the lines, respectively.
# install.packages("ggplot2")
library(ggplot2)

# Data
set.seed(1)
x <- 1:20
y <- x ^ 2 + runif(20, 0, 100)
df <- data.frame(x = x, y = y)

ggplot(df, aes(x = x, y = y)) +
  geom_line(color = 4,    # Color of the line
            lwd = 1,      # Width of the line
            linetype = 1) # Line type
Note that the line type can be set with numbers (0 to 6), with texts or with string patterns.
# install.packages("ggplot2")
library(ggplot2)

# Data
set.seed(1)
x <- 1:20
y <- x ^ 2 + runif(20, 0, 100)
df <- data.frame(x = x, y = y)

ggplot(df, aes(x = x, y = y)) +
  geom_line(color = 4,
            lwd = 1,
linetype = "dashed") 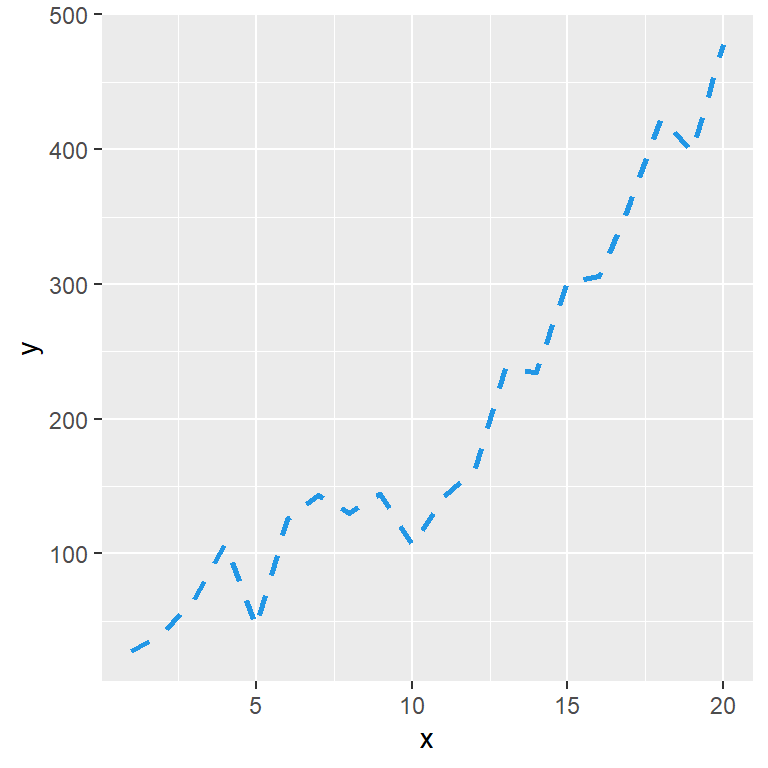

Master Statistics
Learn statistics from the basics to advanced techniques, clearly explained
Go to site