Plotting functions in ggplot2
The geom_function can be used to draw functions in ggplot2. In this scenario you don’t need to pass a data frame to ggplot, but to specify the axis limits with xlim and the function to be plotted.
# install.packages("ggplot2")
library(ggplot2)

ggplot() +
  xlim(c(0, 5)) +
  geom_function(fun = cos)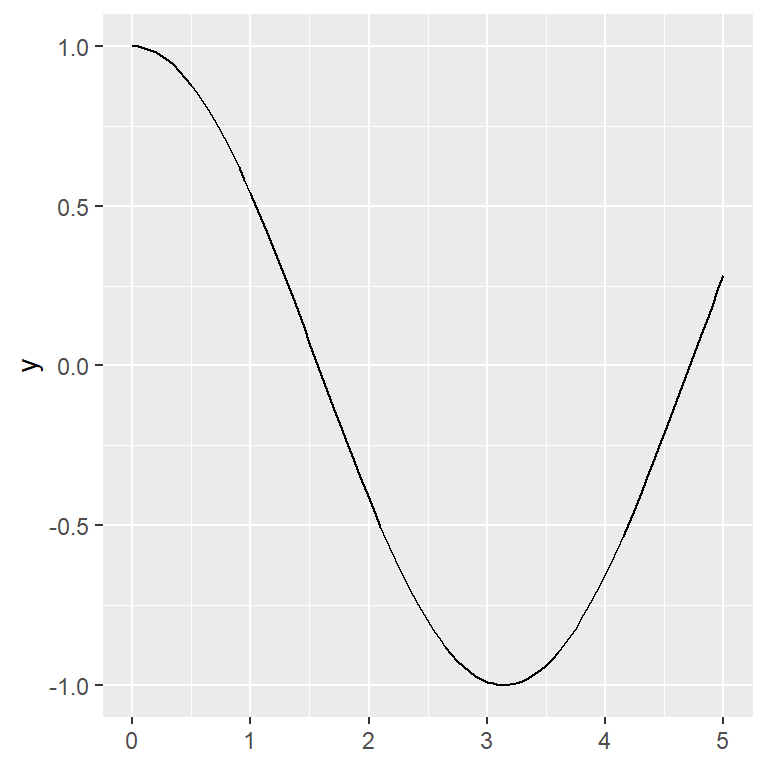
Line customization
The function drawn can be customized with the typical arguments, such as color, lwd and linetype for the color, line width and line type, respectively.
# install.packages("ggplot2")
library(ggplot2)

ggplot() +
  xlim(c(0, 5)) +
  geom_function(fun = cos,
                colour = "red",
                lwd = 1,
                linetype = 1)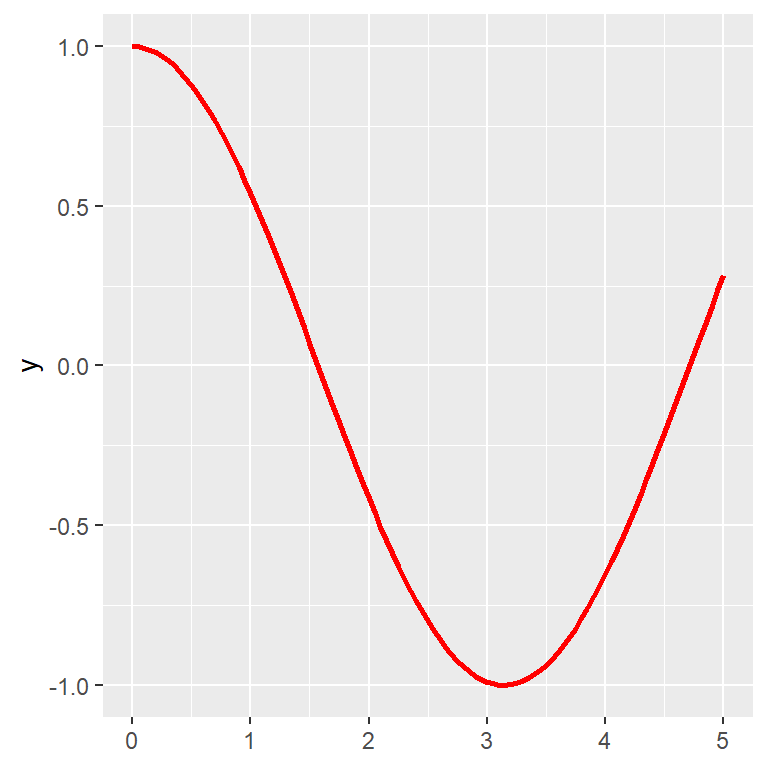
stat_function
You can also use stat_function instead of geom_function. In this scenario you can change the default geom, as shown in the example below.
# install.packages("ggplot2")
library(ggplot2)

ggplot() +
  xlim(c(0, 5)) +
  stat_function(fun = cos,
                geom = "point")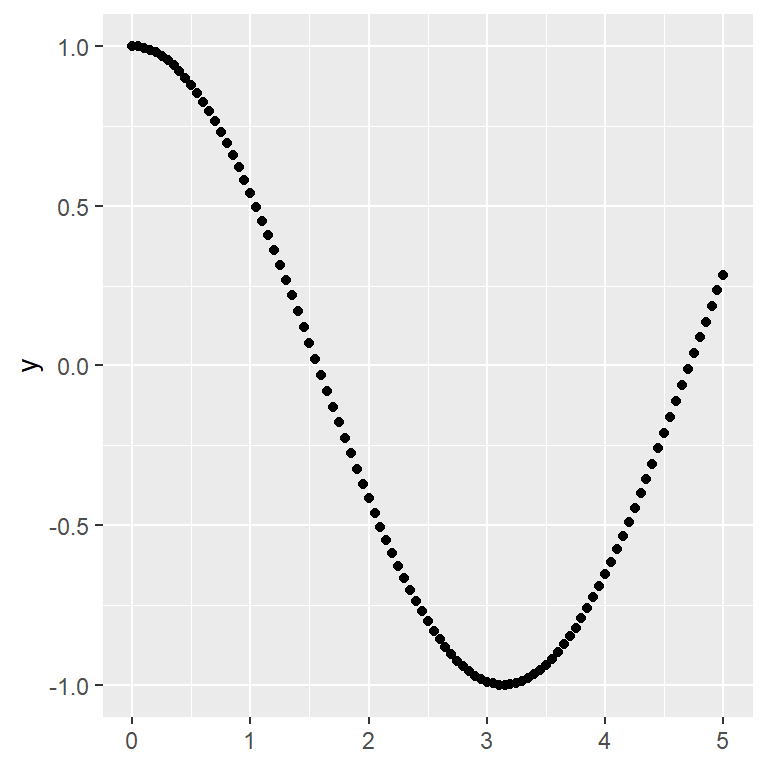
Additional arguments
Note that if the function you are plotting has additional arguments you can pass them through a list with the args argument. In the following example we are plotting a bessel function with besselJ, which requires an argument named nu.
# install.packages("ggplot2")
library(ggplot2)

ggplot() +
  xlim(c(0, 50)) +
  geom_function(fun = besselJ,
                args = list(nu = 2))
Number of points
It should be noted that the number of points used to draw the function might not be enough, as in the previous example. To create a smoother function you can increase the value of the argument n.
# install.packages("ggplot2")
library(ggplot2)

ggplot() +
  xlim(c(0, 50)) +
  geom_function(fun = besselJ,
                n = 400,
                args = list(nu = 2))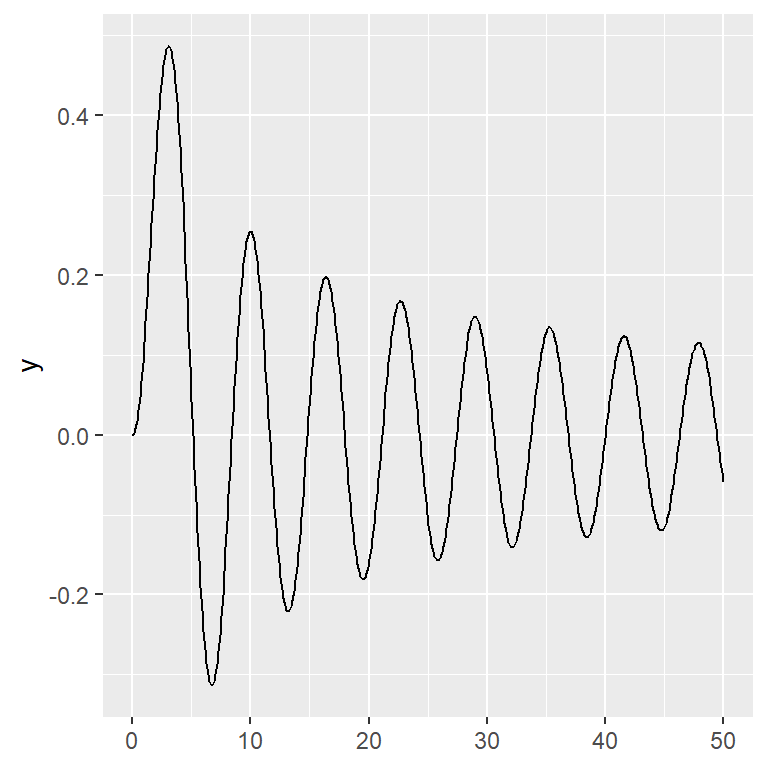
Overlaying several functions
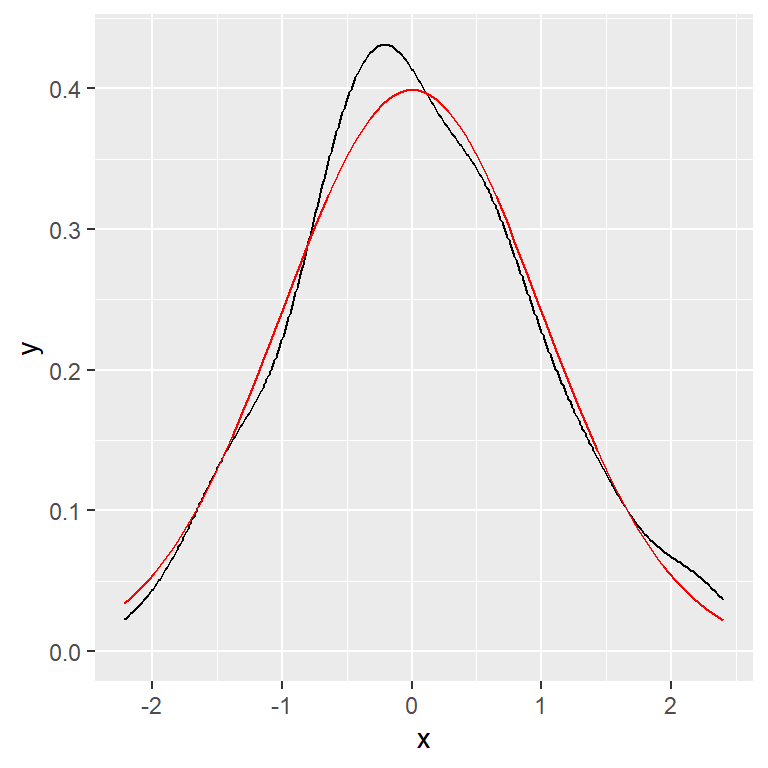
Overlay over existing plot
If you have created a plot you can add a function over it with geom_function. The following example overlays the theoretical normal distribution over a normal distribution generated with 200 samples.
# install.packages("ggplot2")
library(ggplot2)

set.seed(1)
df <- data.frame(x = rnorm(200))

ggplot(df, aes(x = x)) +
  geom_density() +
  geom_function(fun = dnorm, colour = "red")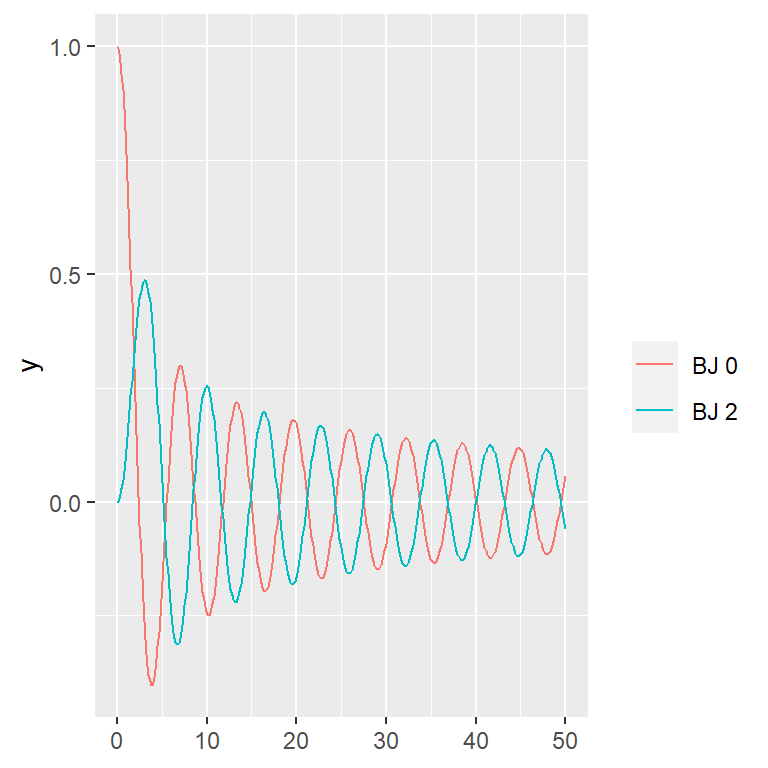
Adding several functions
Finally, it is worth to mention that you can add several functions to the same plot, adding more layers.
# install.packages("ggplot2")
library(ggplot2)

ggplot() +
  xlim(c(0, 50)) +
  geom_function(fun = besselJ, n = 400,
                aes(color = "BJ 0"),
                args = list(nu = 0)) +
  geom_function(fun = besselJ, n = 400,
                aes(color = "BJ 2"),
                args = list(nu = 2)) +
  guides(colour = guide_legend(title = ""))
Master Statistics
Learn statistics from the basics to advanced techniques, clearly explained
Go to site