Sample data
Consider the blockbusters data set from the ggstream package for this guide.
# install.packages("ggstream")
library(ggstream)

blockbusters
Stream plots in ggplot2 with geom_stream
The geom_stream function of the ggstream package allows creating streamplots in ggplot2. Input your data and use the function to create a basic stream graph.
# install.packages("ggstream")
library(ggstream)
# install.packages("ggplot2")
library(ggplot2)

ggplot(blockbusters, aes(x = year, y = box_office, fill = genre)) +
  geom_stream()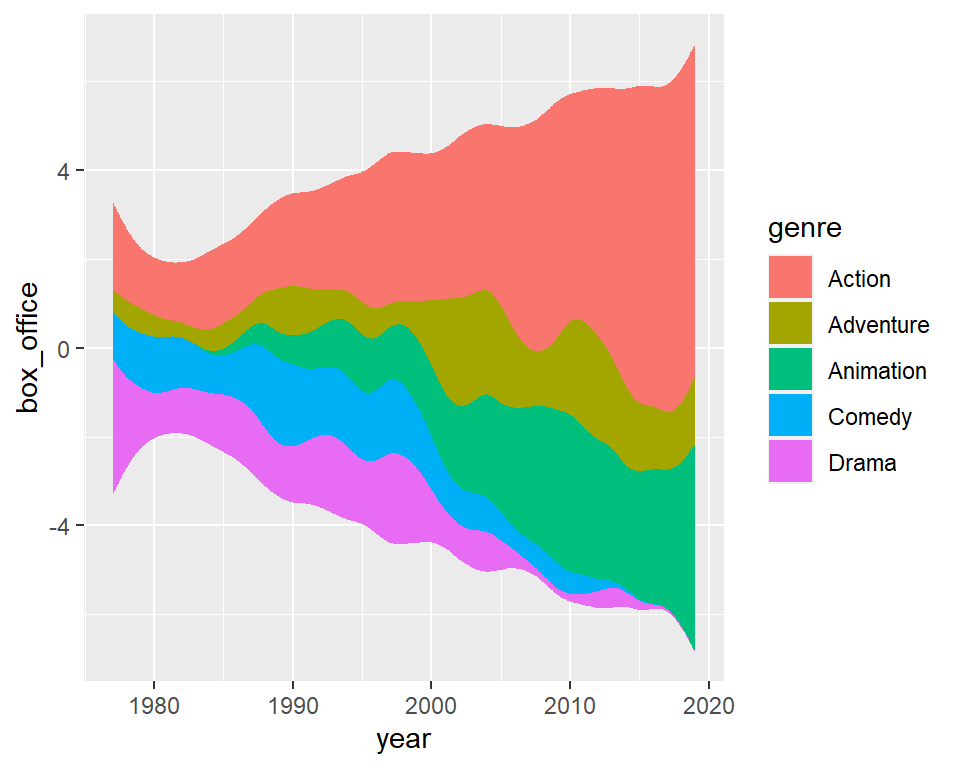
Adding labels to the areas
Note that the package contains an additional function named geom_stream_label that can be used to add labels to each area of the streamgraph.
# install.packages("ggstream")
library(ggstream)
# install.packages("ggplot2")
library(ggplot2)

ggplot(blockbusters, aes(x = year, y = box_office, fill = genre)) +
  geom_stream() +
  geom_stream_label(aes(label = genre))
Stream graphs types
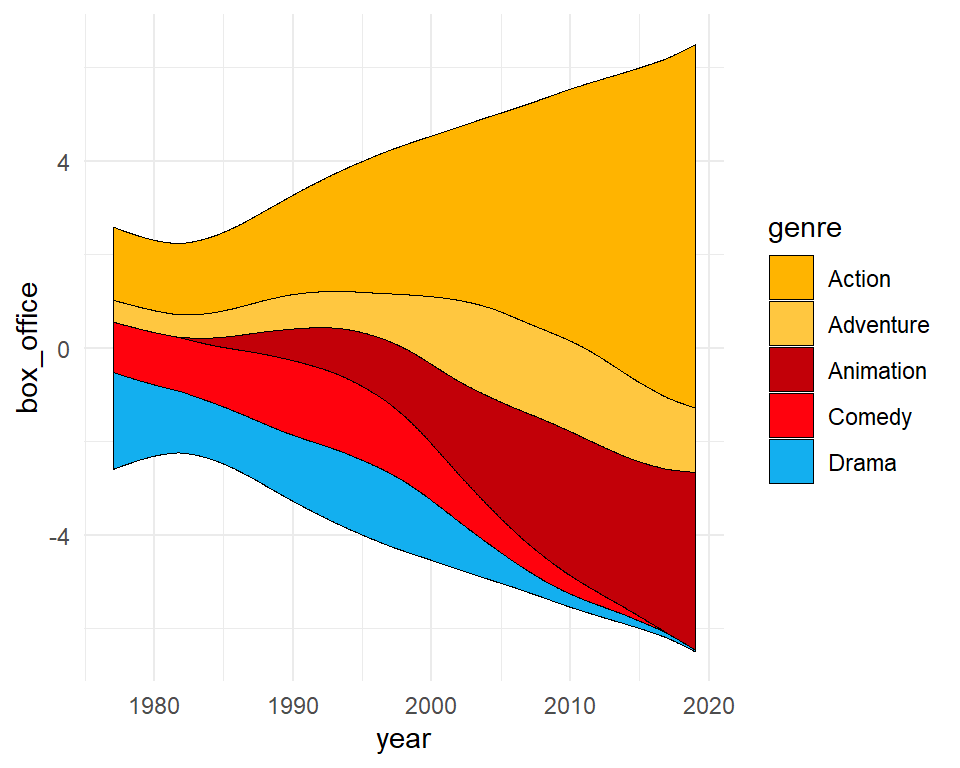
By default, the geom_stream function uses the "mirror" type, which stacks the streams symmetrically around the X-axis. The other alternatives are "ridge", which stacks from the X-axis and "proportional", which makes the streams sum up to 1.
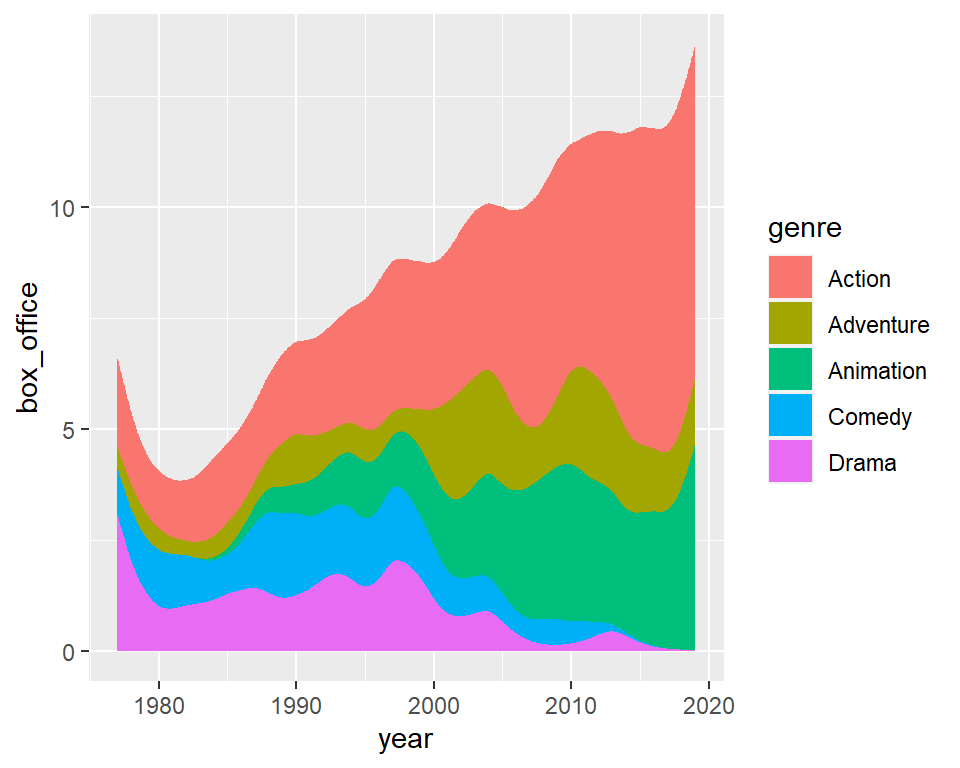
Ridge
# install.packages("ggstream")
library(ggstream)
# install.packages("ggplot2")
library(ggplot2)

ggplot(blockbusters, aes(x = year, y = box_office, fill = genre)) +
  geom_stream(type = "ridge")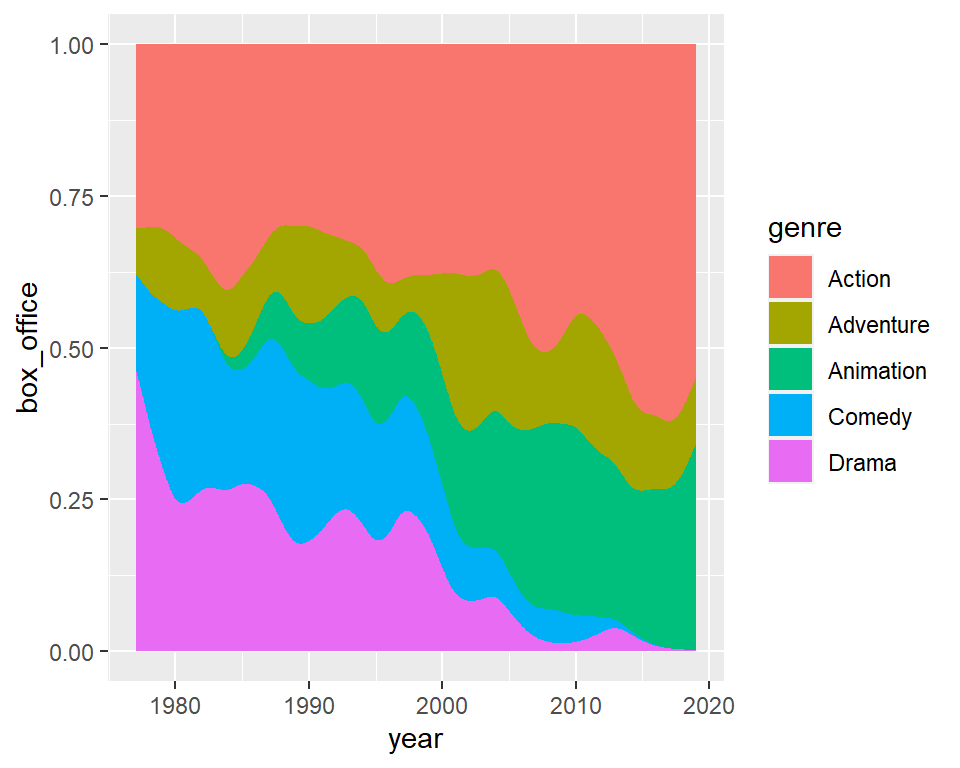
Proportional
# install.packages("ggstream")
library(ggstream)
# install.packages("ggplot2")
library(ggplot2)

ggplot(blockbusters, aes(x = year, y = box_office, fill = genre)) +
  geom_stream(type = "proportional")
Color customization
Change the fill colors
Is is possible to change the fill colors of the streamgraph with scale_fill_manual or an equivalent function.
# install.packages("ggstream")
library(ggstream)
# install.packages("ggplot2")
library(ggplot2)

cols <- c("#FFB400", "#FFC740", "#C20008", "#FF020D", "#13AFEF")

ggplot(blockbusters, aes(x = year, y = box_office, fill = genre)) +
  geom_stream() +
  scale_fill_manual(values = cols)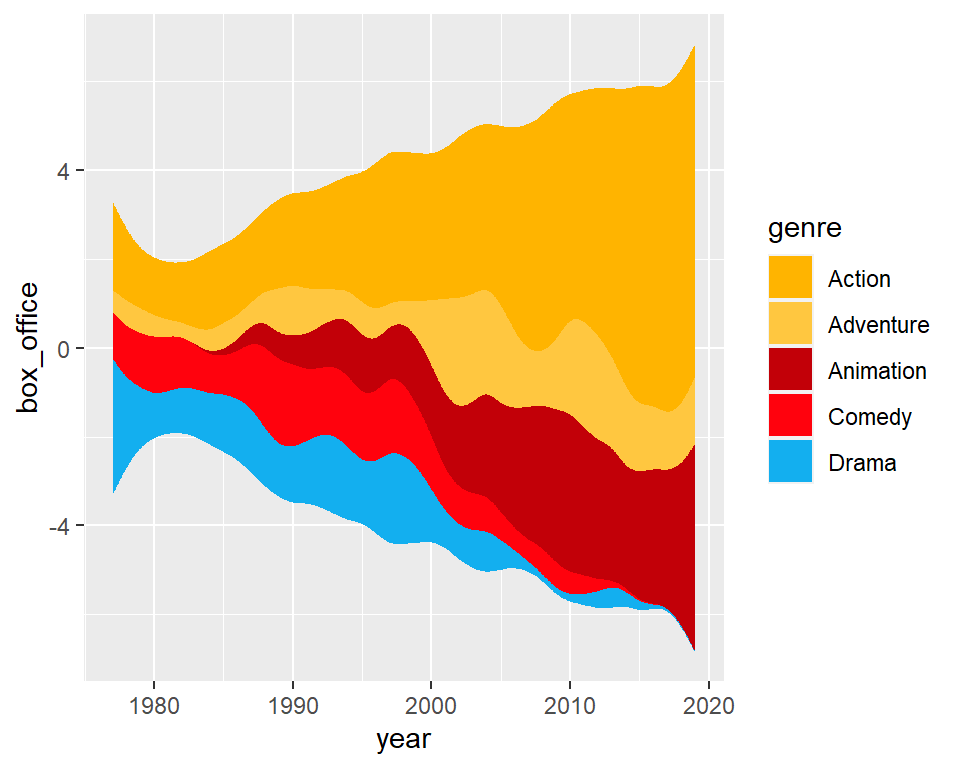
Change the color of the borders
By default the areas have no border but you can add a border color with the color argument of the geom_stream function and modify its width with lwd.
# install.packages("ggstream")
library(ggstream)
# install.packages("ggplot2")
library(ggplot2)

cols <- c("#FFB400", "#FFC740", "#C20008", "#FF020D", "#13AFEF")

ggplot(blockbusters, aes(x = year, y = box_office, fill = genre)) +
  geom_stream(color = 1, lwd = 0.25) +
  scale_fill_manual(values = cols)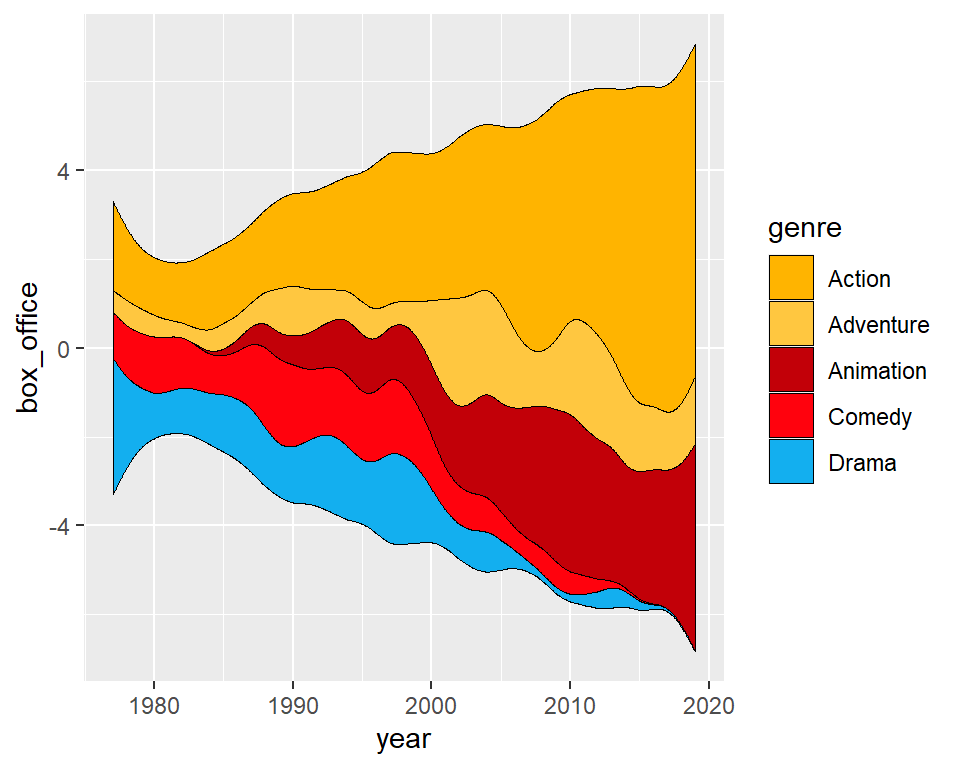
Change the theme
Note that you can also change the theme to modify the appearance of the chart.
# install.packages("ggstream")
library(ggstream)
# install.packages("ggplot2")
library(ggplot2)

cols <- c("#FFB400", "#FFC740", "#C20008", "#FF020D", "#13AFEF")

ggplot(blockbusters, aes(x = year, y = box_office, fill = genre)) +
  geom_stream(color = 1, lwd = 0.25) +
  scale_fill_manual(values = cols) +
  theme_minimal()
Advanced arguments
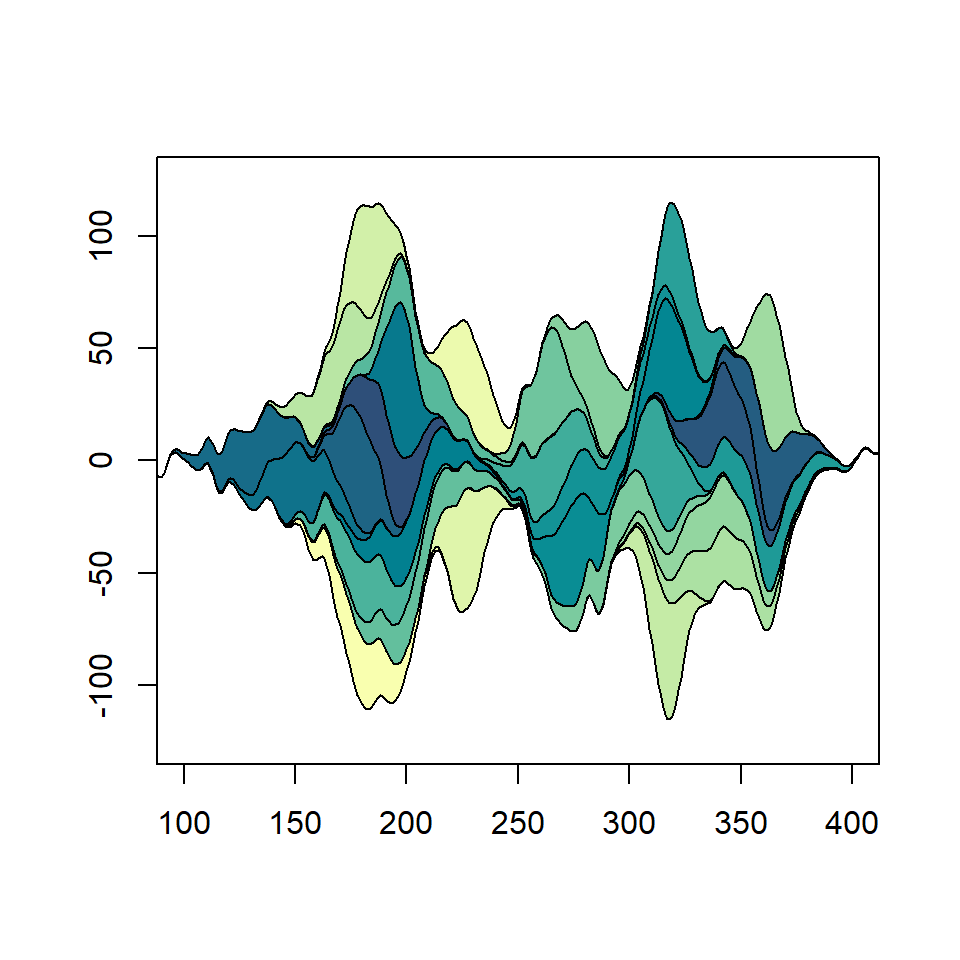
In order to create a streamplot there are underlying non-parametric computations which need a bandwidth (defaults to 0.75) and a grid of values on the X-axis (defaults to 1000). You can change these default values with bw and n_grid.
Note that you can also use an extra range in the estimation with extra_span, that defaults to 0.01 (1%) and specify if the true range of the data should be used on the visualization or the estimation range with true_range.
Bandwidth (bw)
# install.packages("ggstream")
library(ggstream)
# install.packages("ggplot2")
library(ggplot2)

cols <- c("#FFB400", "#FFC740", "#C20008", "#FF020D", "#13AFEF")

ggplot(blockbusters, aes(x = year, y = box_office, fill = genre)) +
  geom_stream(color = 1, lwd = 0.25,
              bw = 1) +
  scale_fill_manual(values = cols) +
  theme_minimal()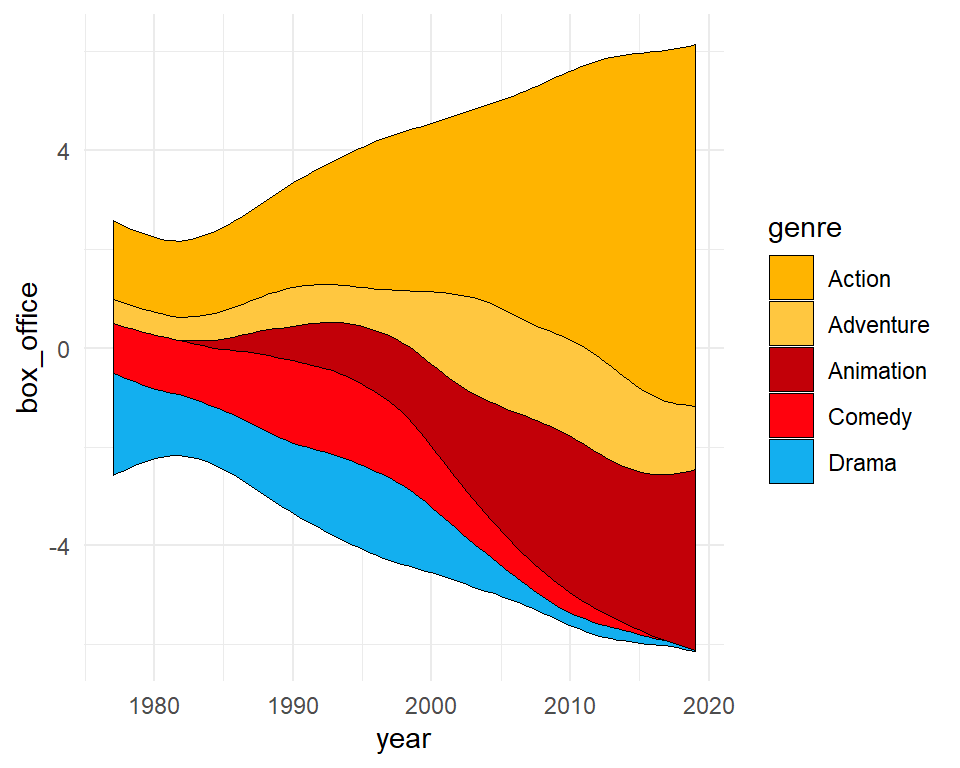
Grid (n_grid)
# install.packages("ggstream")
library(ggstream)
# install.packages("ggplot2")
library(ggplot2)

cols <- c("#FFB400", "#FFC740", "#C20008", "#FF020D", "#13AFEF")

ggplot(blockbusters, aes(x = year, y = box_office, fill = genre)) +
  geom_stream(color = 1, lwd = 0.25,
              n_grid = 100) +
  scale_fill_manual(values = cols) +
  theme_minimal()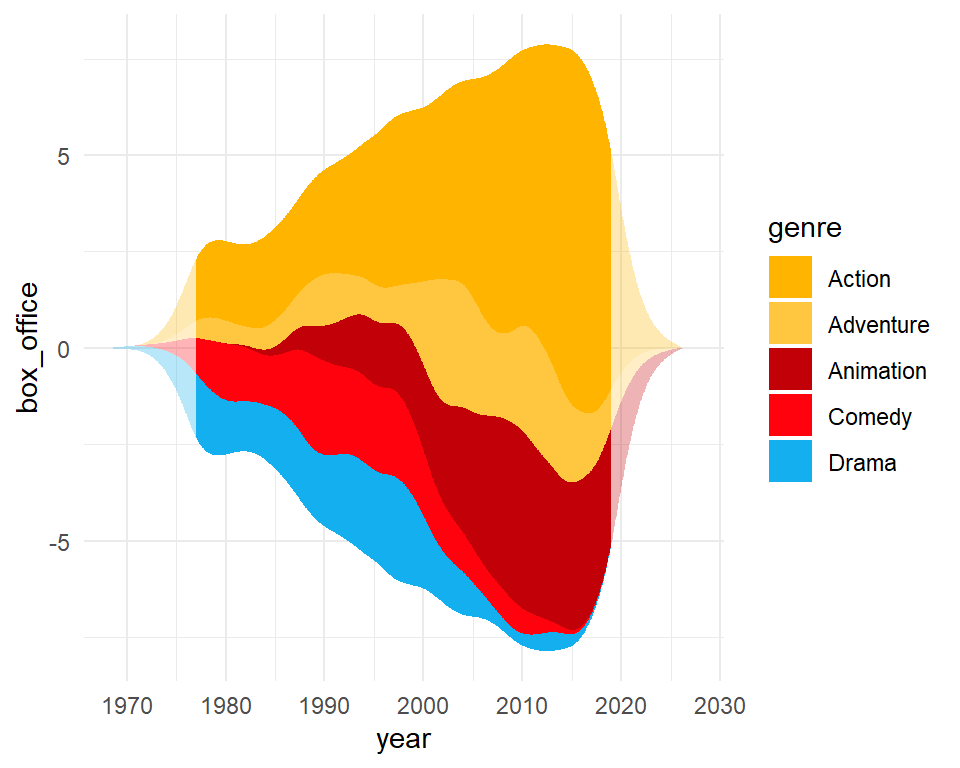
Extra span and true range (extra_span, true_range)
# install.packages("ggstream")
library(ggstream)
# install.packages("ggplot2")
library(ggplot2)

cols <- c("#FFB400", "#FFC740", "#C20008", "#FF020D", "#13AFEF")

ggplot(blockbusters, aes(x = year, y = box_office, fill = genre)) +
  geom_stream(extra_span = 0.2) +
  geom_stream(extra_span = 0.2, true_range = "none",
              alpha = 0.3) +
  scale_fill_manual(values = cols) +
  theme_minimal()
Legend customization
As in other ggplot2 charts you can change the title, the key labels and change the position or remove the legend, as shown in the examples below.
Change the title
# install.packages("ggstream")
library(ggstream)
# install.packages("ggplot2")
library(ggplot2)

cols <- c("#FFB400", "#FFC740", "#C20008", "#FF020D", "#13AFEF")

ggplot(blockbusters, aes(x = year, y = box_office, fill = genre)) +
  geom_stream(extra_span = 0.2) +
  geom_stream(extra_span = 0.2, true_range = "none",
              alpha = 0.3) +
  scale_fill_manual(values = cols) +
  theme_minimal() +
  guides(fill = guide_legend(title = "Title"))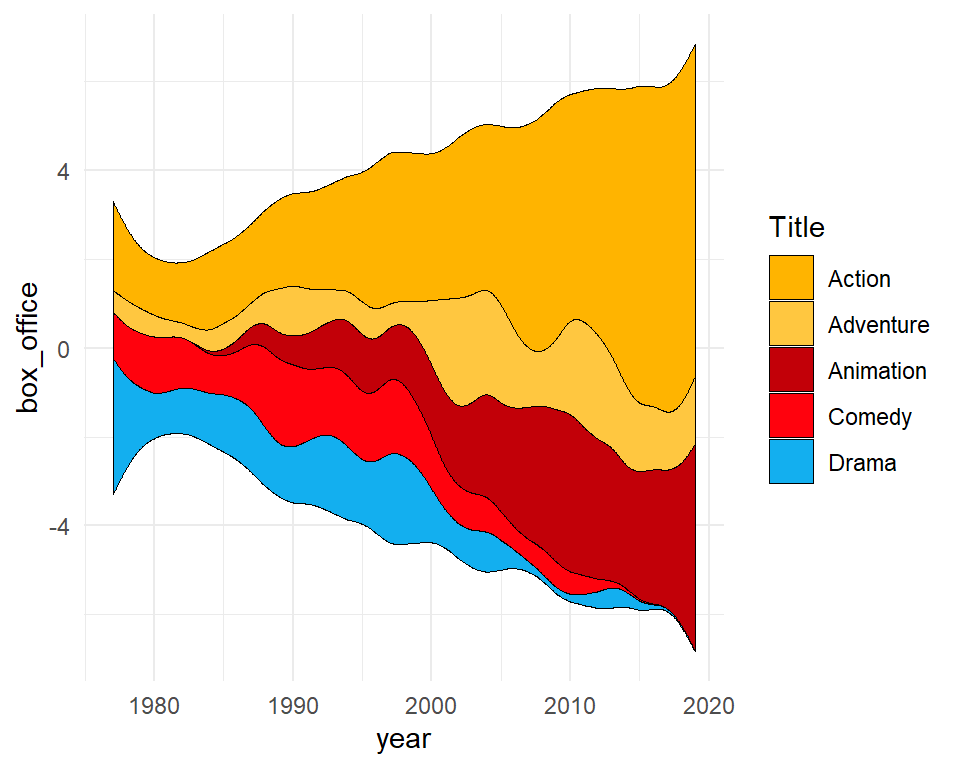
Change the labels
# install.packages("ggstream")
library(ggstream)
# install.packages("ggplot2")
library(ggplot2)

cols <- c("#FFB400", "#FFC740", "#C20008", "#FF020D", "#13AFEF")

ggplot(blockbusters, aes(x = year, y = box_office, fill = genre)) +
  geom_stream(color = 1, lwd = 0.25) +
  scale_fill_manual(values = cols, labels = LETTERS[1:5]) +
  theme_minimal()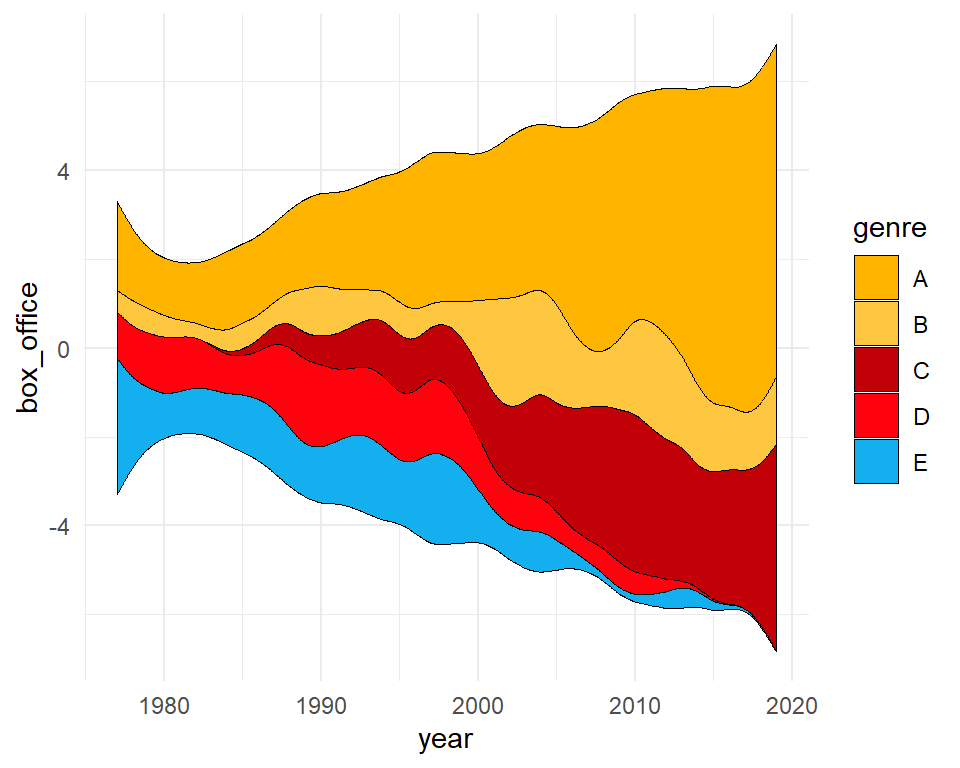
Remove the legend
# install.packages("ggstream")
library(ggstream)
# install.packages("ggplot2")
library(ggplot2)

cols <- c("#FFB400", "#FFC740", "#C20008", "#FF020D", "#13AFEF")

ggplot(blockbusters, aes(x = year, y = box_office, fill = genre)) +
  geom_stream(color = 1, lwd = 0.25) +
  scale_fill_manual(values = cols) +
  theme_minimal() +
  theme(legend.position = "none")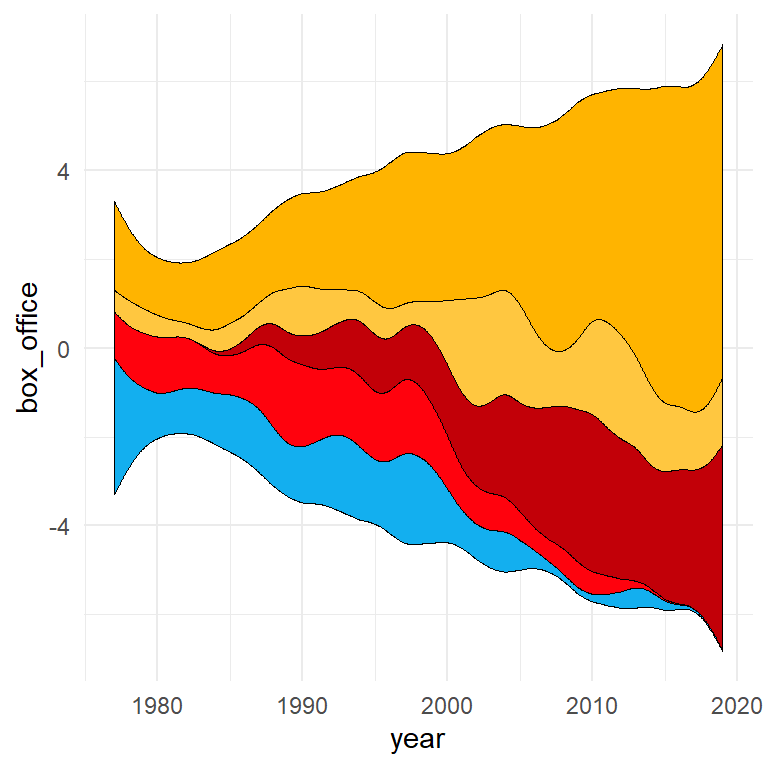

Master Statistics
Learn statistics from the basics to advanced techniques, clearly explained
Go to site