Calendar as a heat map
The calendR package allows creating a yearly or monthly heat map with a calendar to display the evolution a variable over the time. In order to create it pass a vector (containing the variable of interest) of the same length of the number of days of the corresponding year to special.days and set gradient = TRUE.
The color of the lower values can be set with low.col, which defaults to white, and the color of higher values with special.col.
# install.packages(calendR)
library(calendR)

# Data
set.seed(2)
data <- rnorm(365)

# Calendar
calendR(year = 2021,
        special.days = data,
        gradient = TRUE,
        low.col = "#FFFFED",
        special.col = "#FF0000")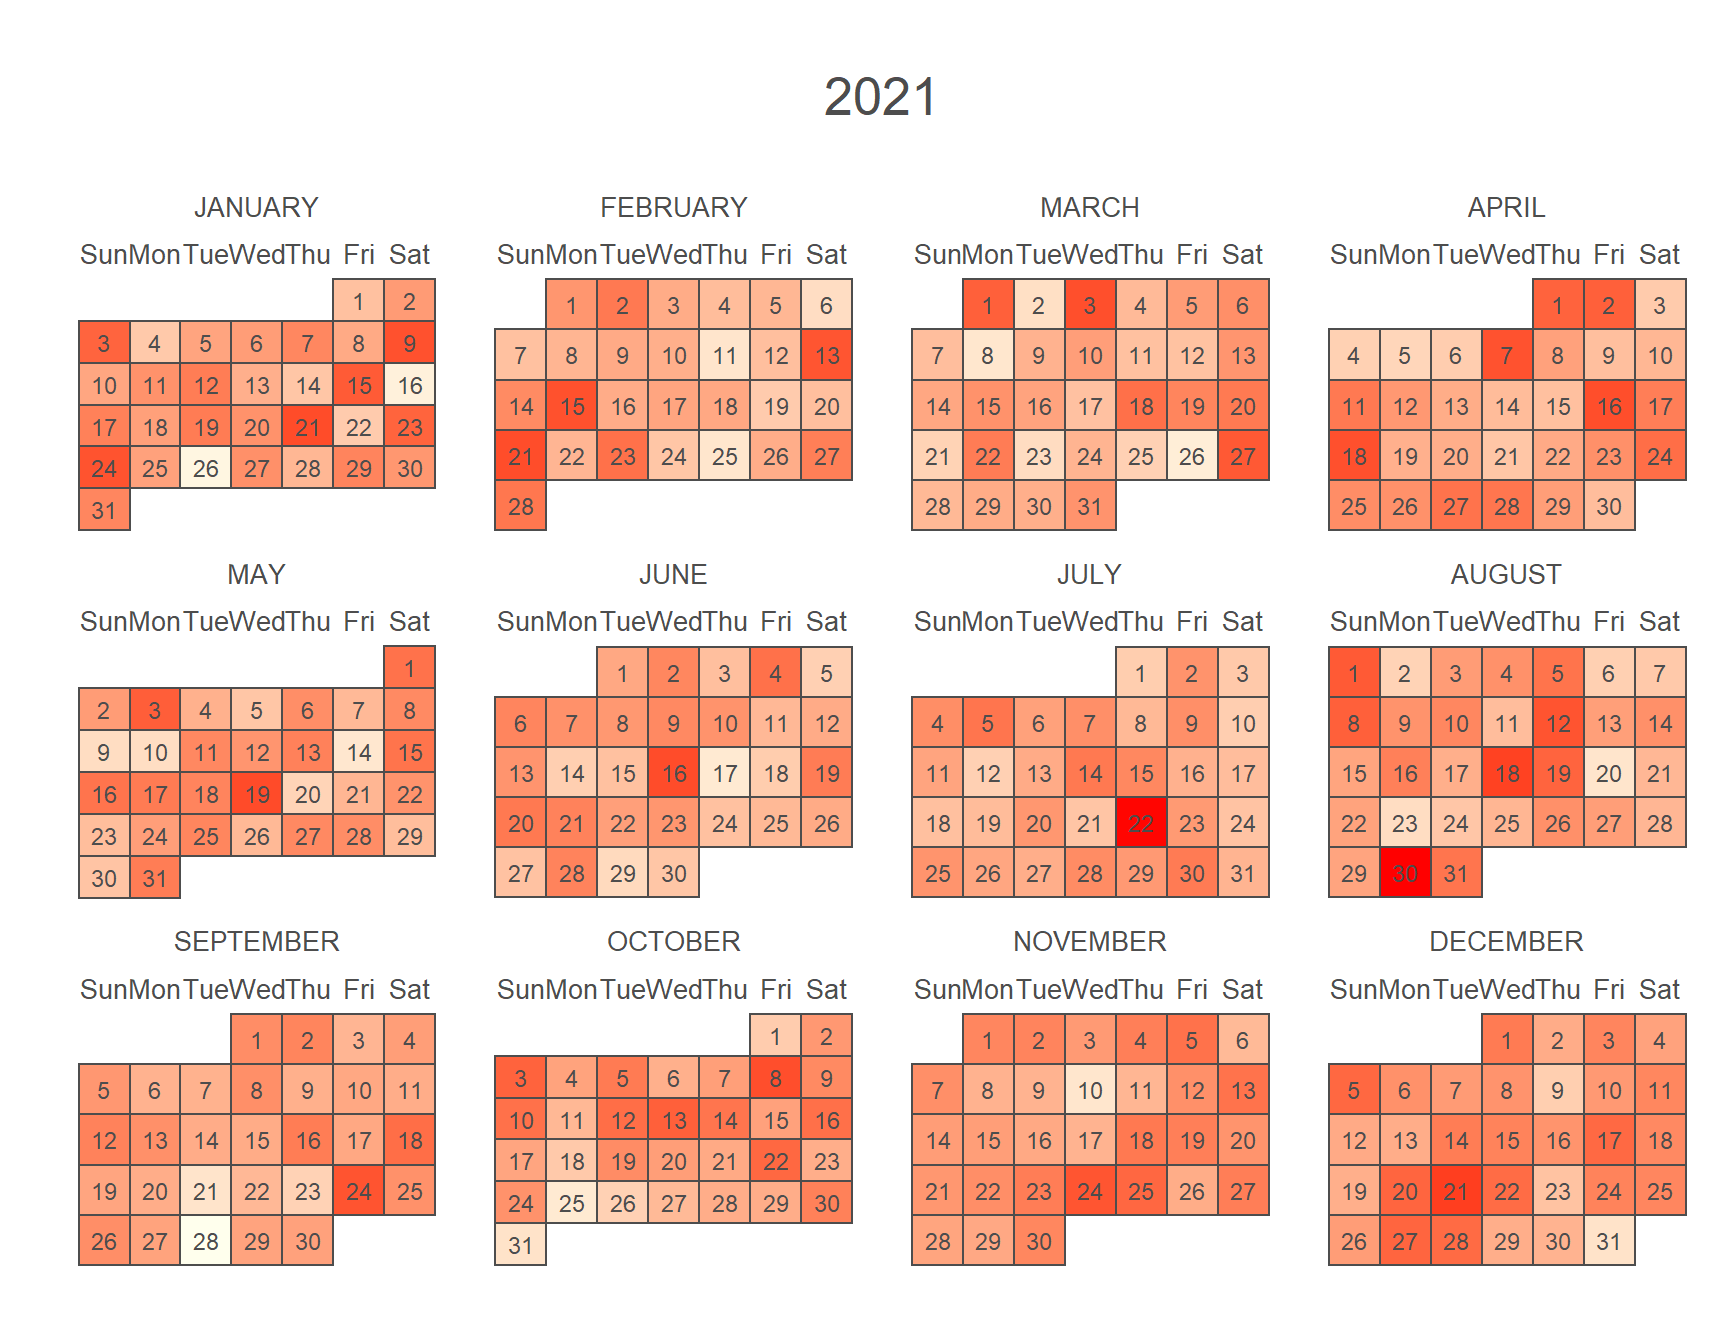
Note that you can also add a legend to the calendar setting its position with legend.pos ("bottom", "left", "top" or "right"). The title of the legend can be set with legend.title.
# install.packages(calendR)
library(calendR)

# Data
set.seed(2)
data <- rnorm(365)

# Calendar
calendR(year = 2021,
        special.days = data,
        gradient = TRUE,
        low.col = "#FCFFDD",
        special.col = "#00AAAE",
        legend.pos = "right",
        legend.title = "Title")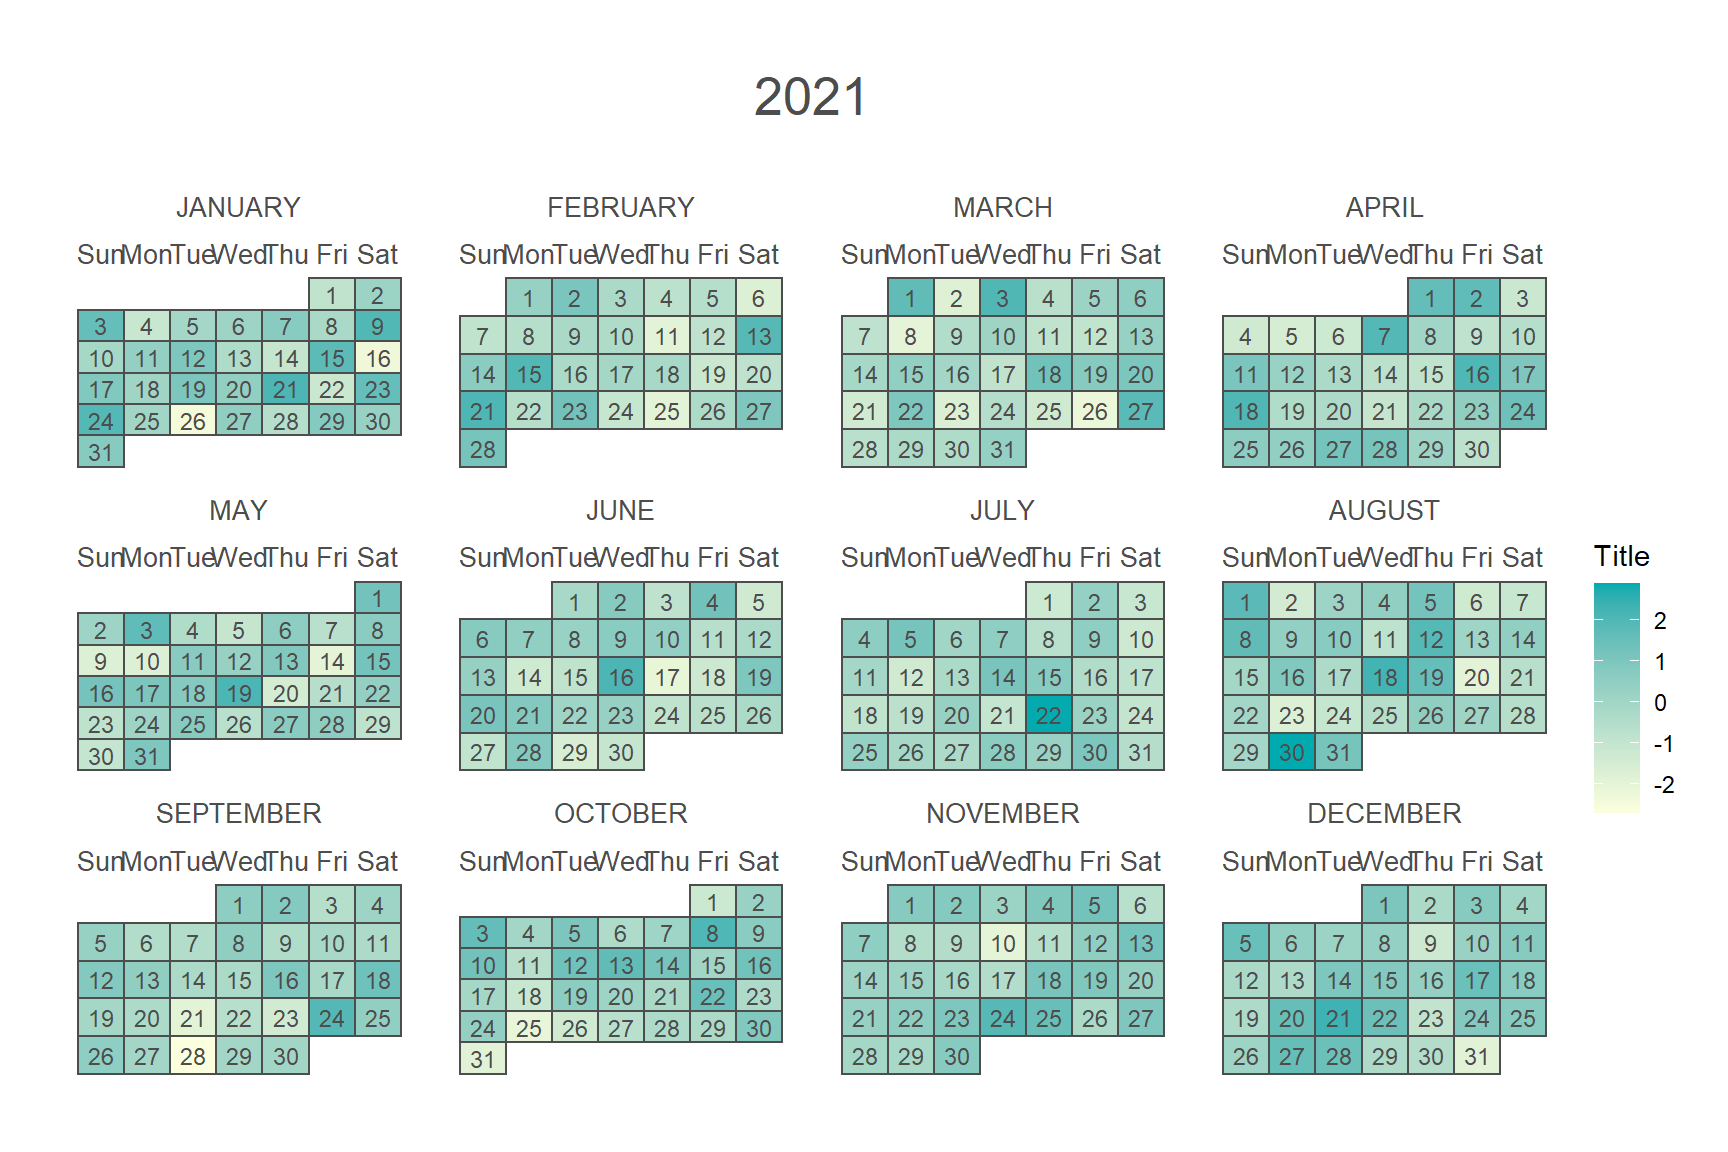
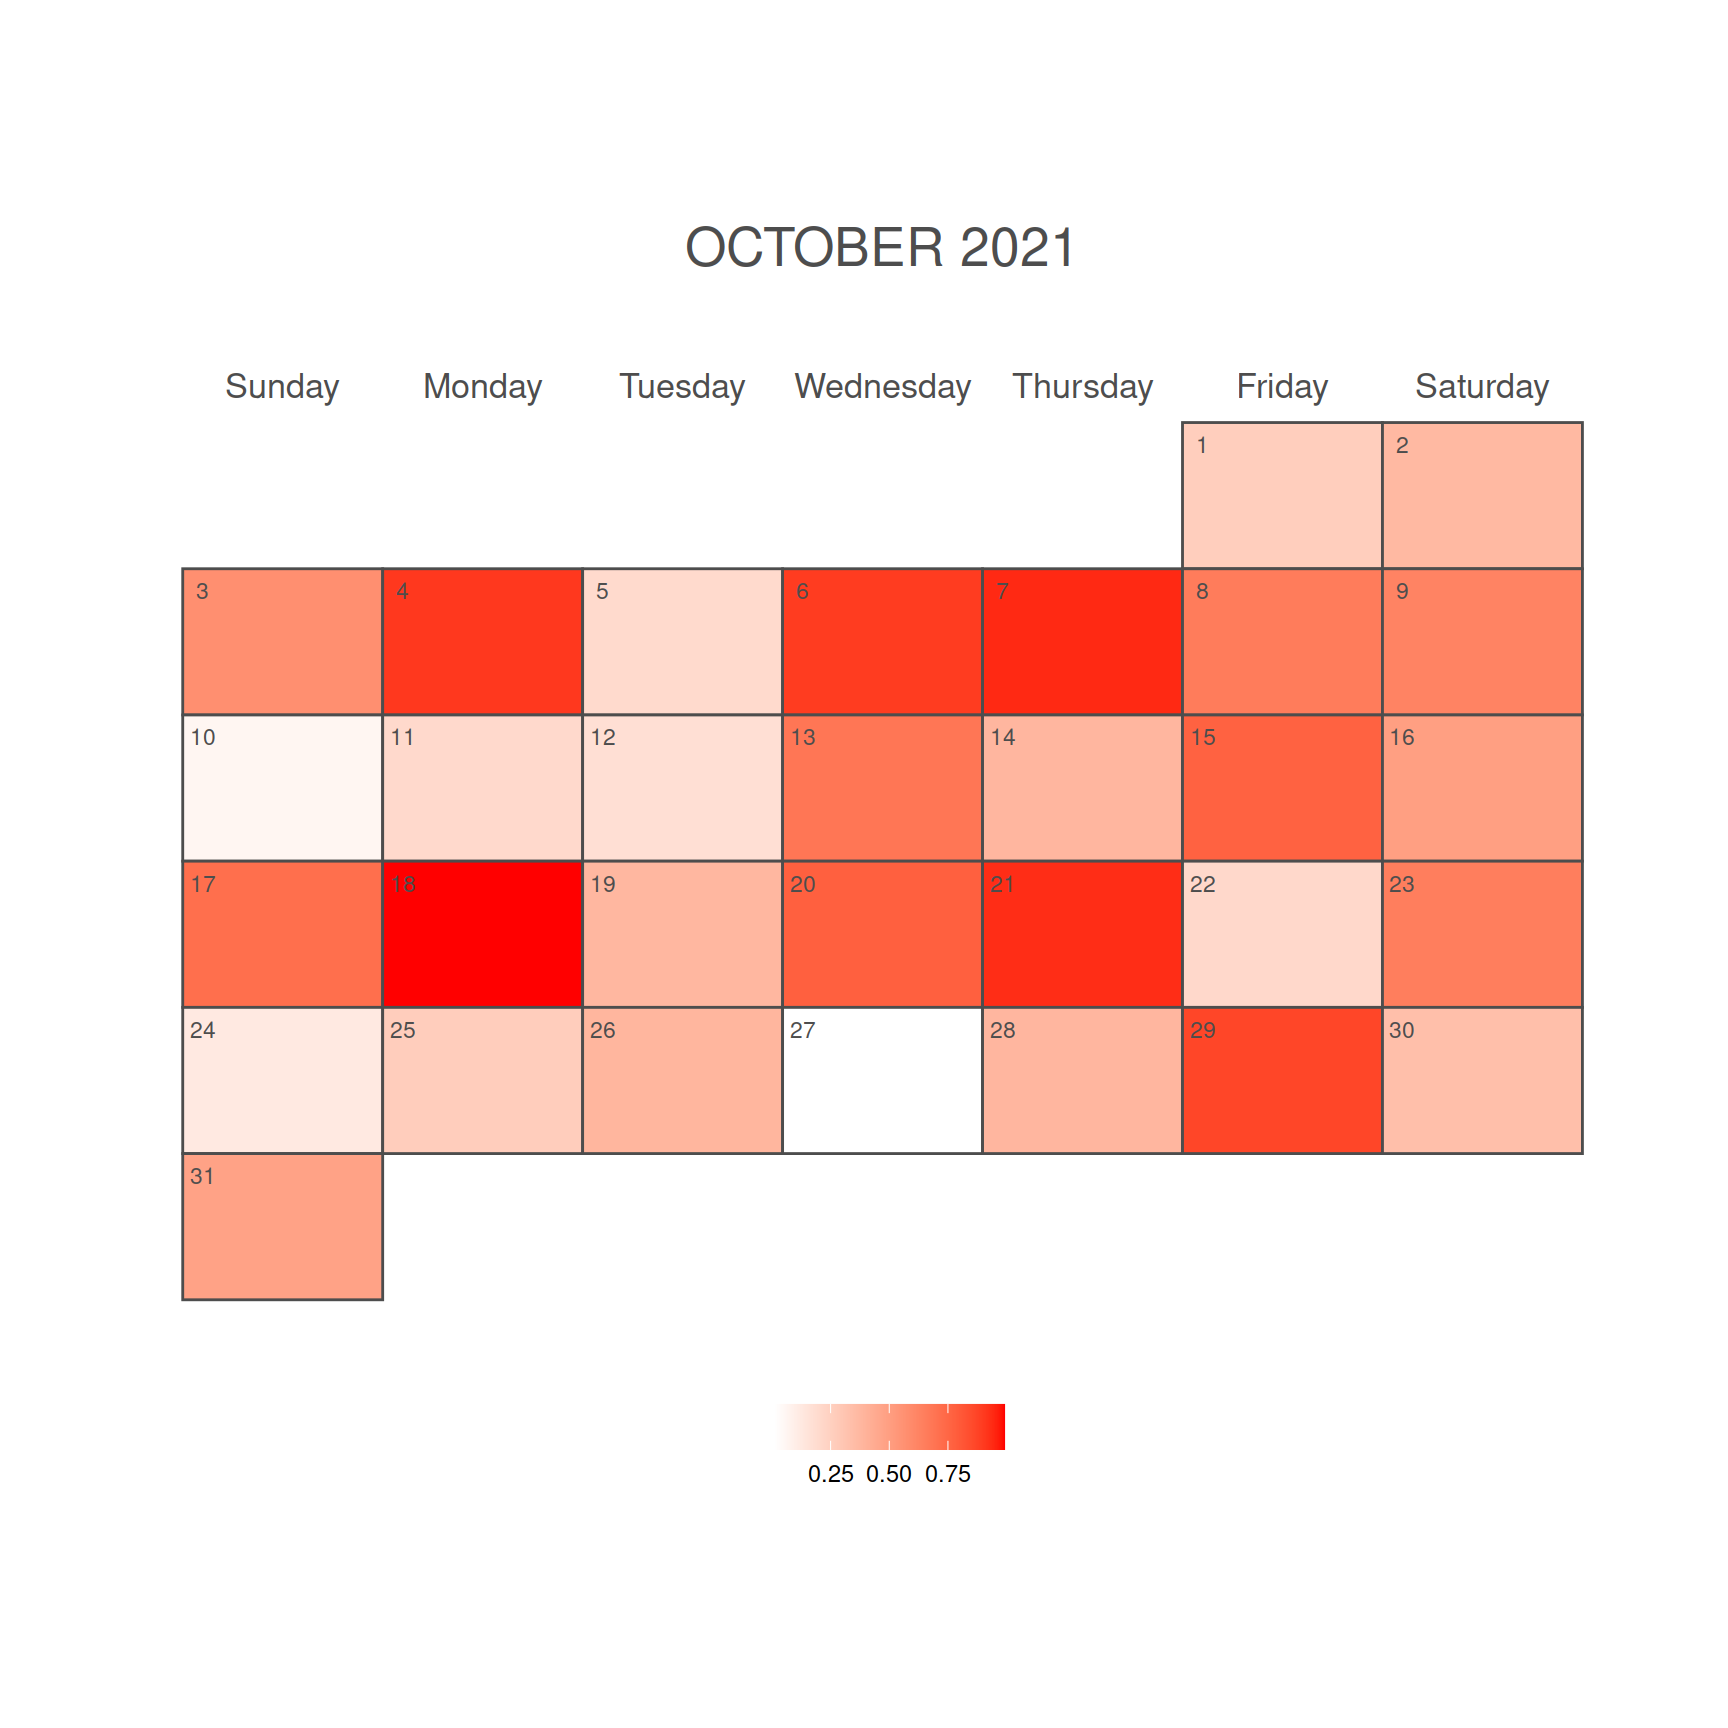
Heat map on certain days
You can also create a heat map for certain days of the year, as in the following example.
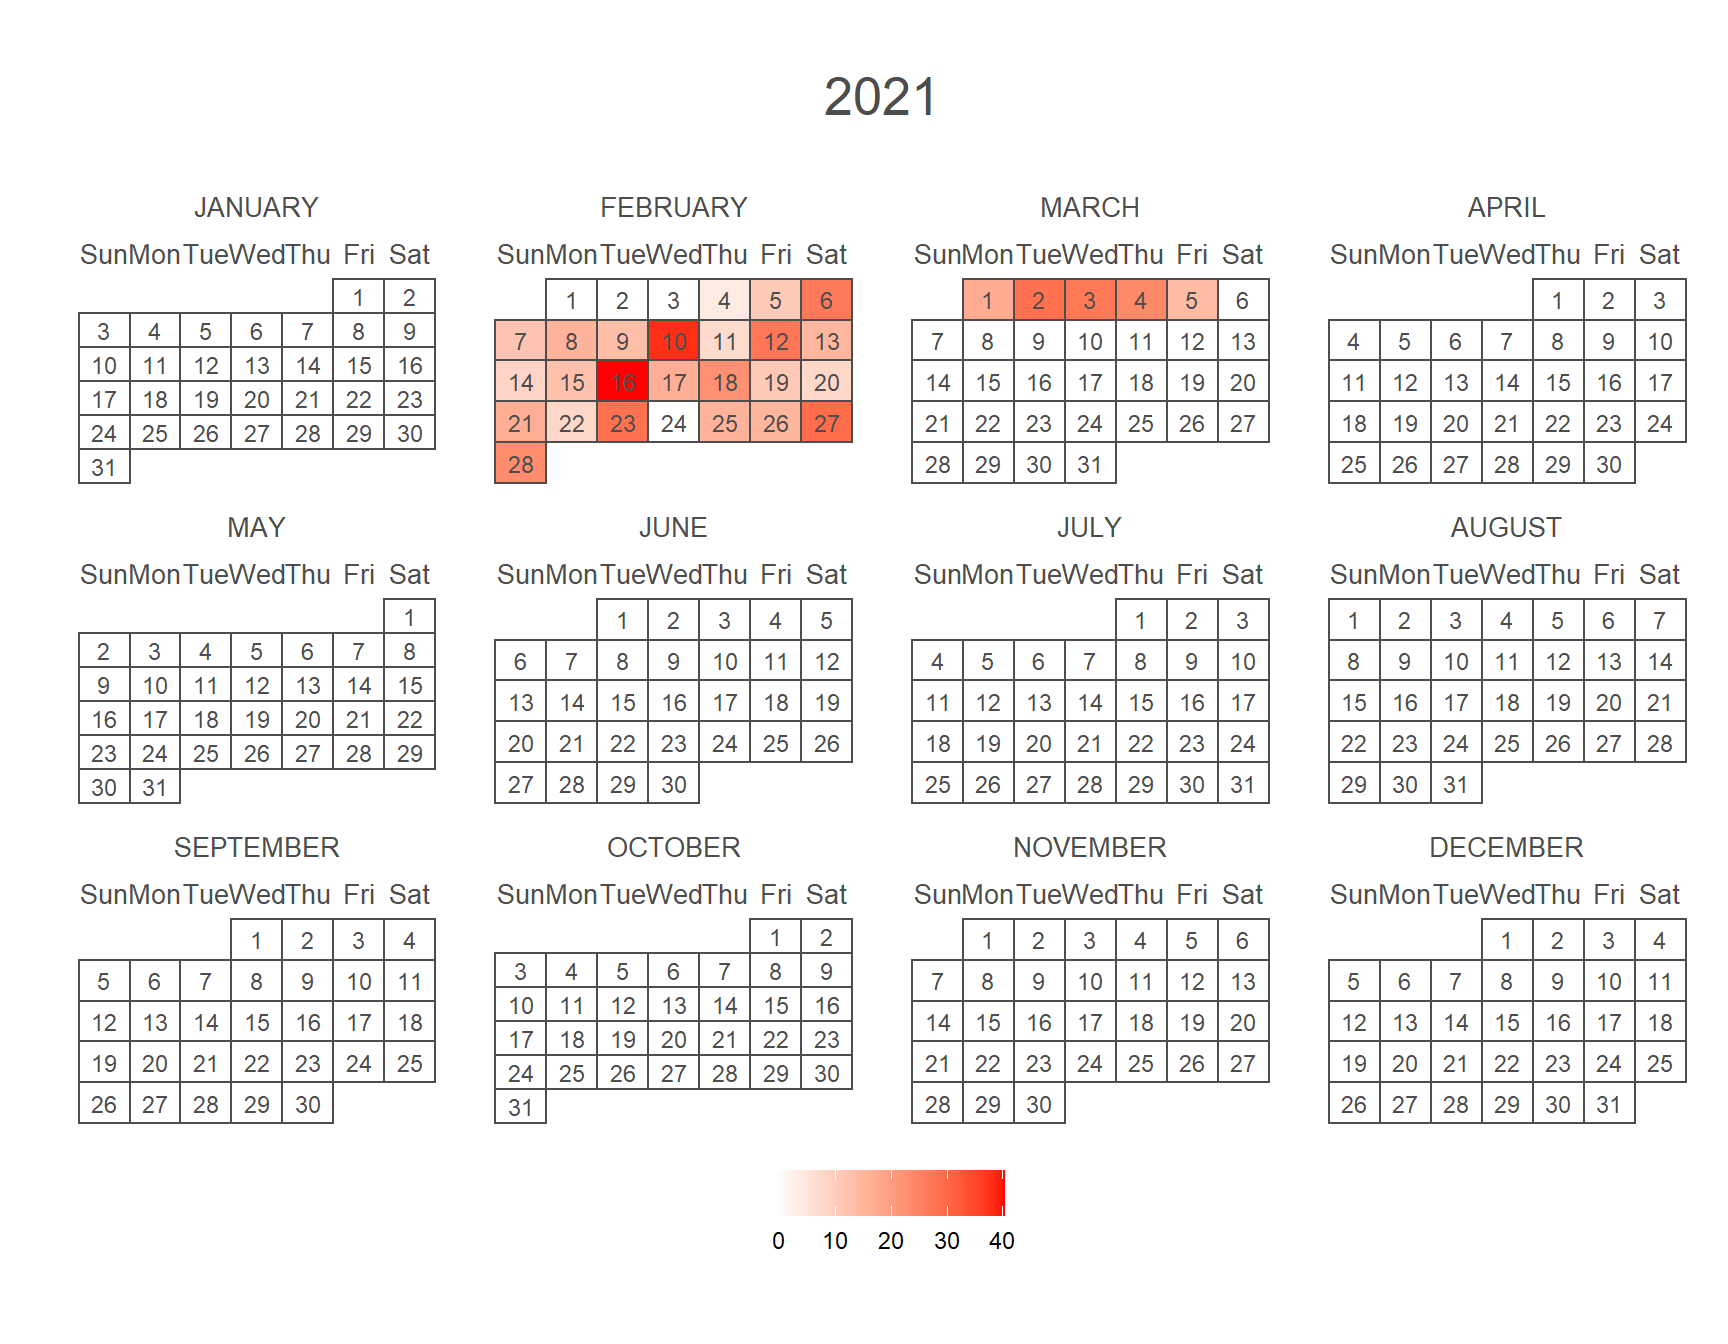
# install.packages(calendR)
library(calendR)

# Data
data <- rnorm(30, 15, 10)

# Create a vector where all the values are a bit
# lower than the lowest value of your data
days <- rep(min(data) - 0.05, 365)

# Fill the days you want with your data
days[30:59] <- data

calendR(year = 2021,
        special.days = days,
        low.col = "white",
        special.col = "#FF0000",
        gradient = TRUE,
        legend.pos = "bottom")
Calendar orientation
Finally, it is worth to mention that you can also modify the orientation of the heat map calendar setting orientation = "p" or orientation = "portrait". This setting will create a calendar with three columns and four rows.
# install.packages(calendR)
library(calendR)

# Data
set.seed(2)
data <- rnorm(365)

# Vertical calendar
calendR(year = 2021,
        special.days = data,
        low.col = "#FCFFDD",
        special.col = "#00AAAE",
        gradient = TRUE,
        legend.pos = "right",
        orientation = "portrait")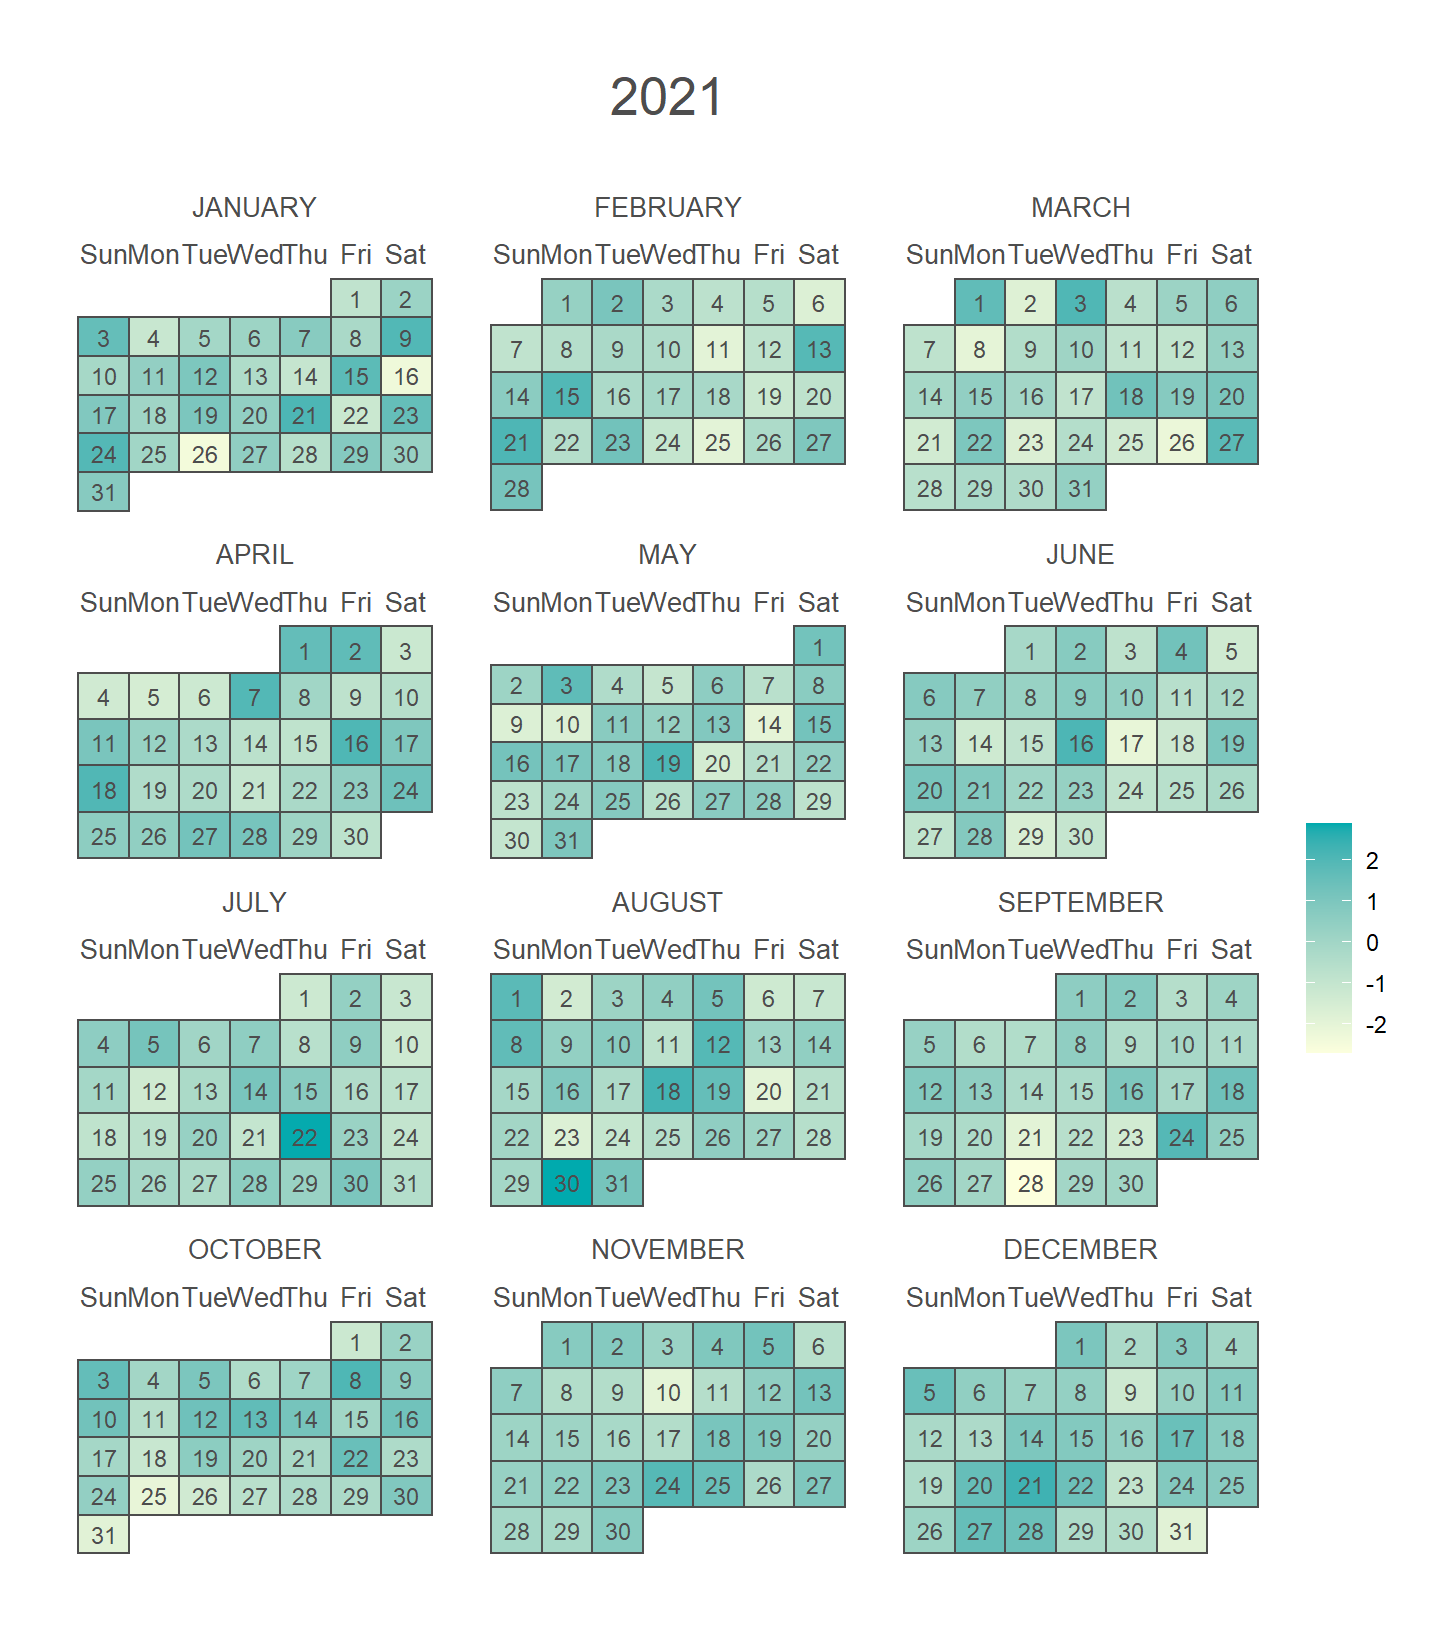

Master Statistics
Learn statistics from the basics to advanced techniques, clearly explained
Go to site