Sample data set
Consider the first two columns of the EuStockMarkets data frame which contains the closing prices for european stock indices.
dat <- as.data.frame(EuStockMarkets[, 1:2])Area chart of a single line
If you want to create an area chart for one of the variables you can make use of the polygon function or the areaplot function of the package of the same name. Note that using areaplot the Y-axis will start at 0.
dat <- as.data.frame(EuStockMarkets[, 1:2])

# First column
y <- dat[, 1]

# Area chart
plot(y, type = "l")

polygon(c(1, seq(y), length(y)), c(0, y, 0),
        col = rgb(0.53, 0.79, 0.88, alpha = 0.5))

# Almost equivalent to:
# install.packages("areaplot")
library(areaplot)

areaplot(y, col = rgb(0.53, 0.79, 0.88, alpha = 0.5))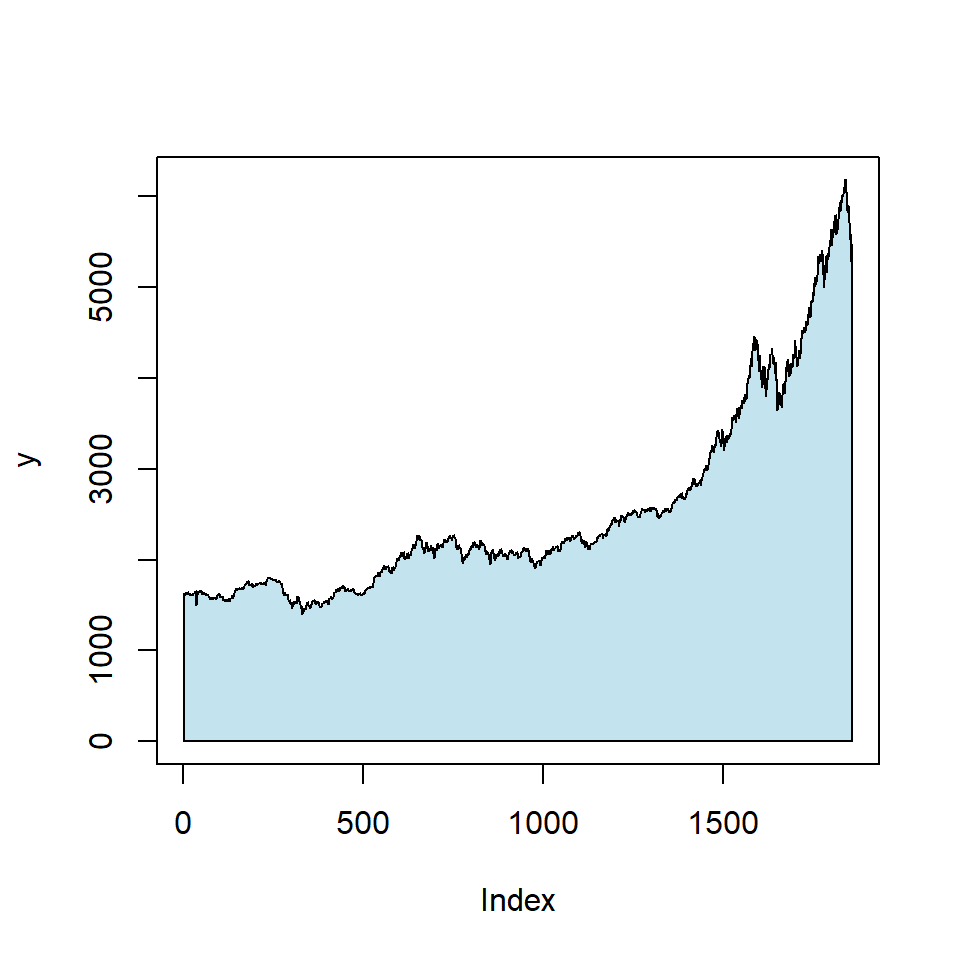
Area chart of several variables
If you want to create an area chart with several variables you can make use of the polygon function as shown below. Note that if one variable is always higher than the other you should plot it first. In addition, if the variables overlap you should use colors with transparency.
dat <- as.data.frame(EuStockMarkets[, 1:2])

# Second variable (because it is higher)
y1 <- dat$SMI

# Plot
plot(y1, type = "l", ylim = c(0, max(dat)))

polygon(c(1, seq(y1), length(y1)), c(0, y1, 0),
        col = "#E0F2F1")

# First variable
y2 <- dat$DAX

# Adding the line
lines(y2, type = "l")
polygon(c(1, seq(y2), length(y2)), c(0, y2, 0),
        col = "#4DB6AC")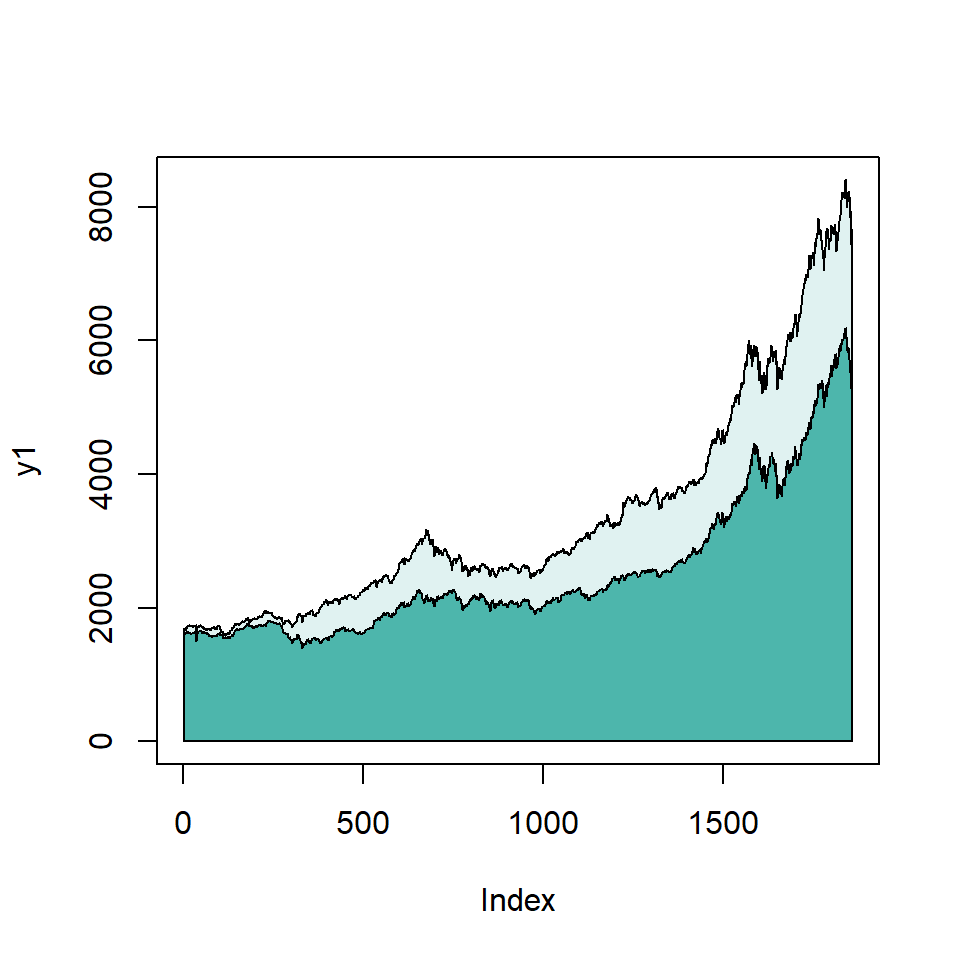
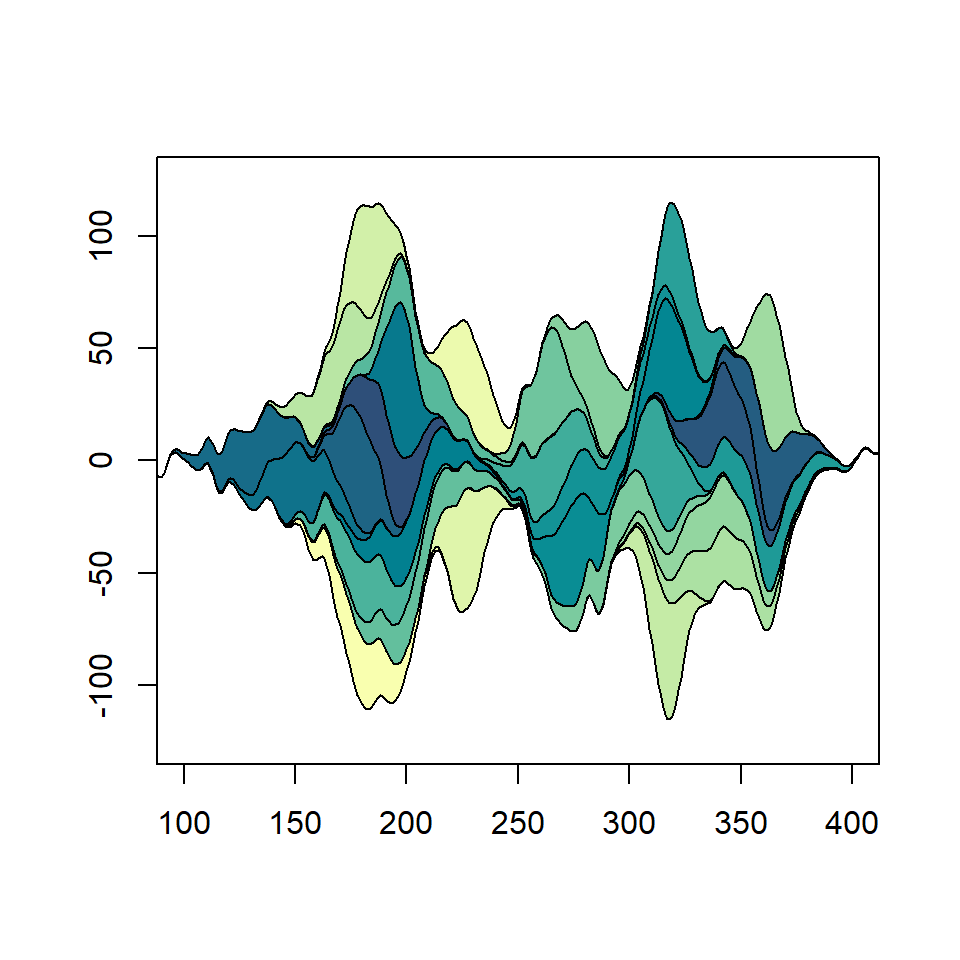
If you want to plot more than two or three variables consider creating a stacked area plot instead.

Master Statistics
Learn statistics from the basics to advanced techniques, clearly explained
Go to site