Monthly calendar as a heat map
The calendR package can be used to create monthly or yearly calendar heat maps. You will need to specify a year, a month, set gradient = TRUE and pass your data. The colors can be set with low.col and special.col (higher color). Note that the data must be of the same length of the number of days of the month.
# install.packages(calendR)
library(calendR)

# Data
set.seed(1)
data <- runif(31)

# Calendar
calendR(year = 2021,
        month = 10,
        special.days = data,
        gradient = TRUE,
        low.col = "white",
        special.col = "#FF4600")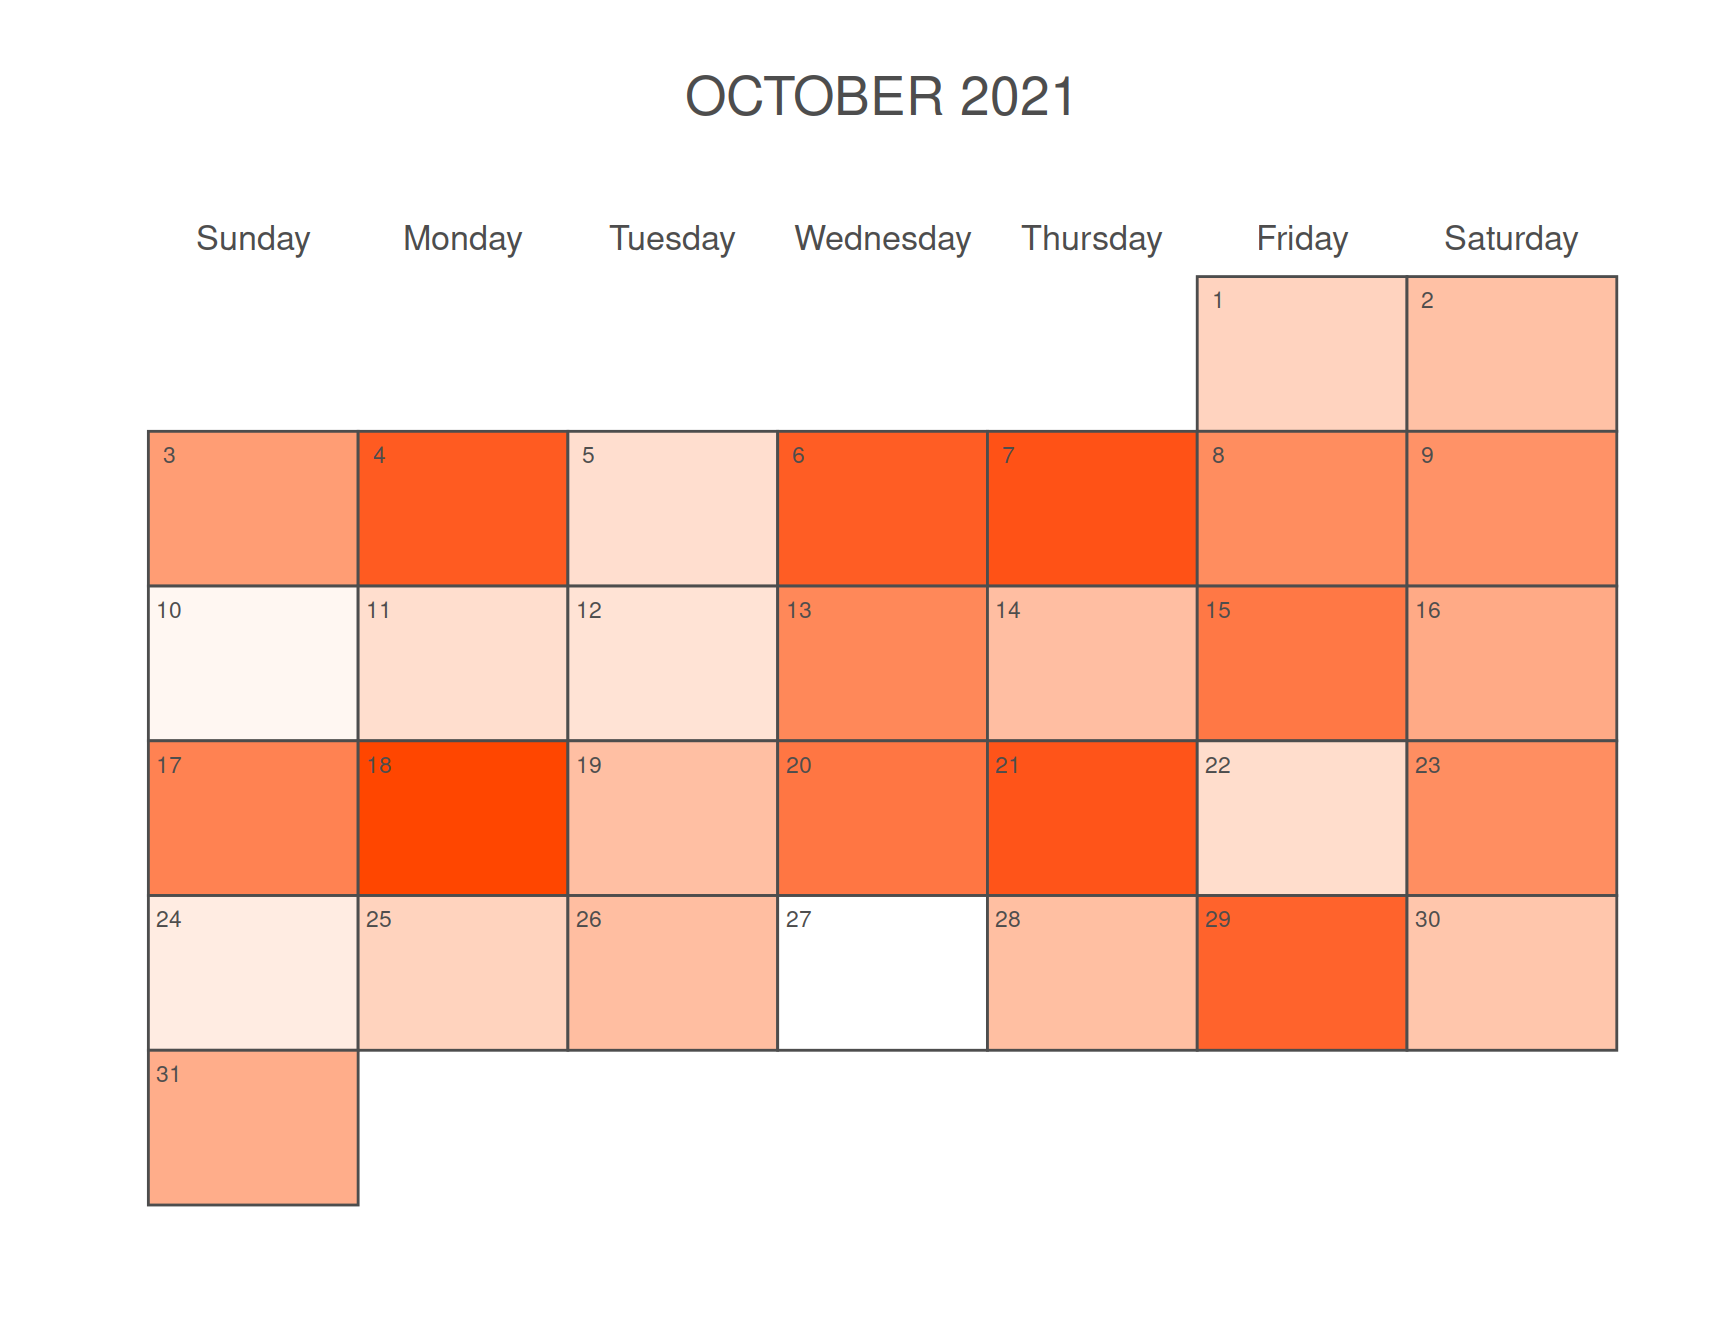
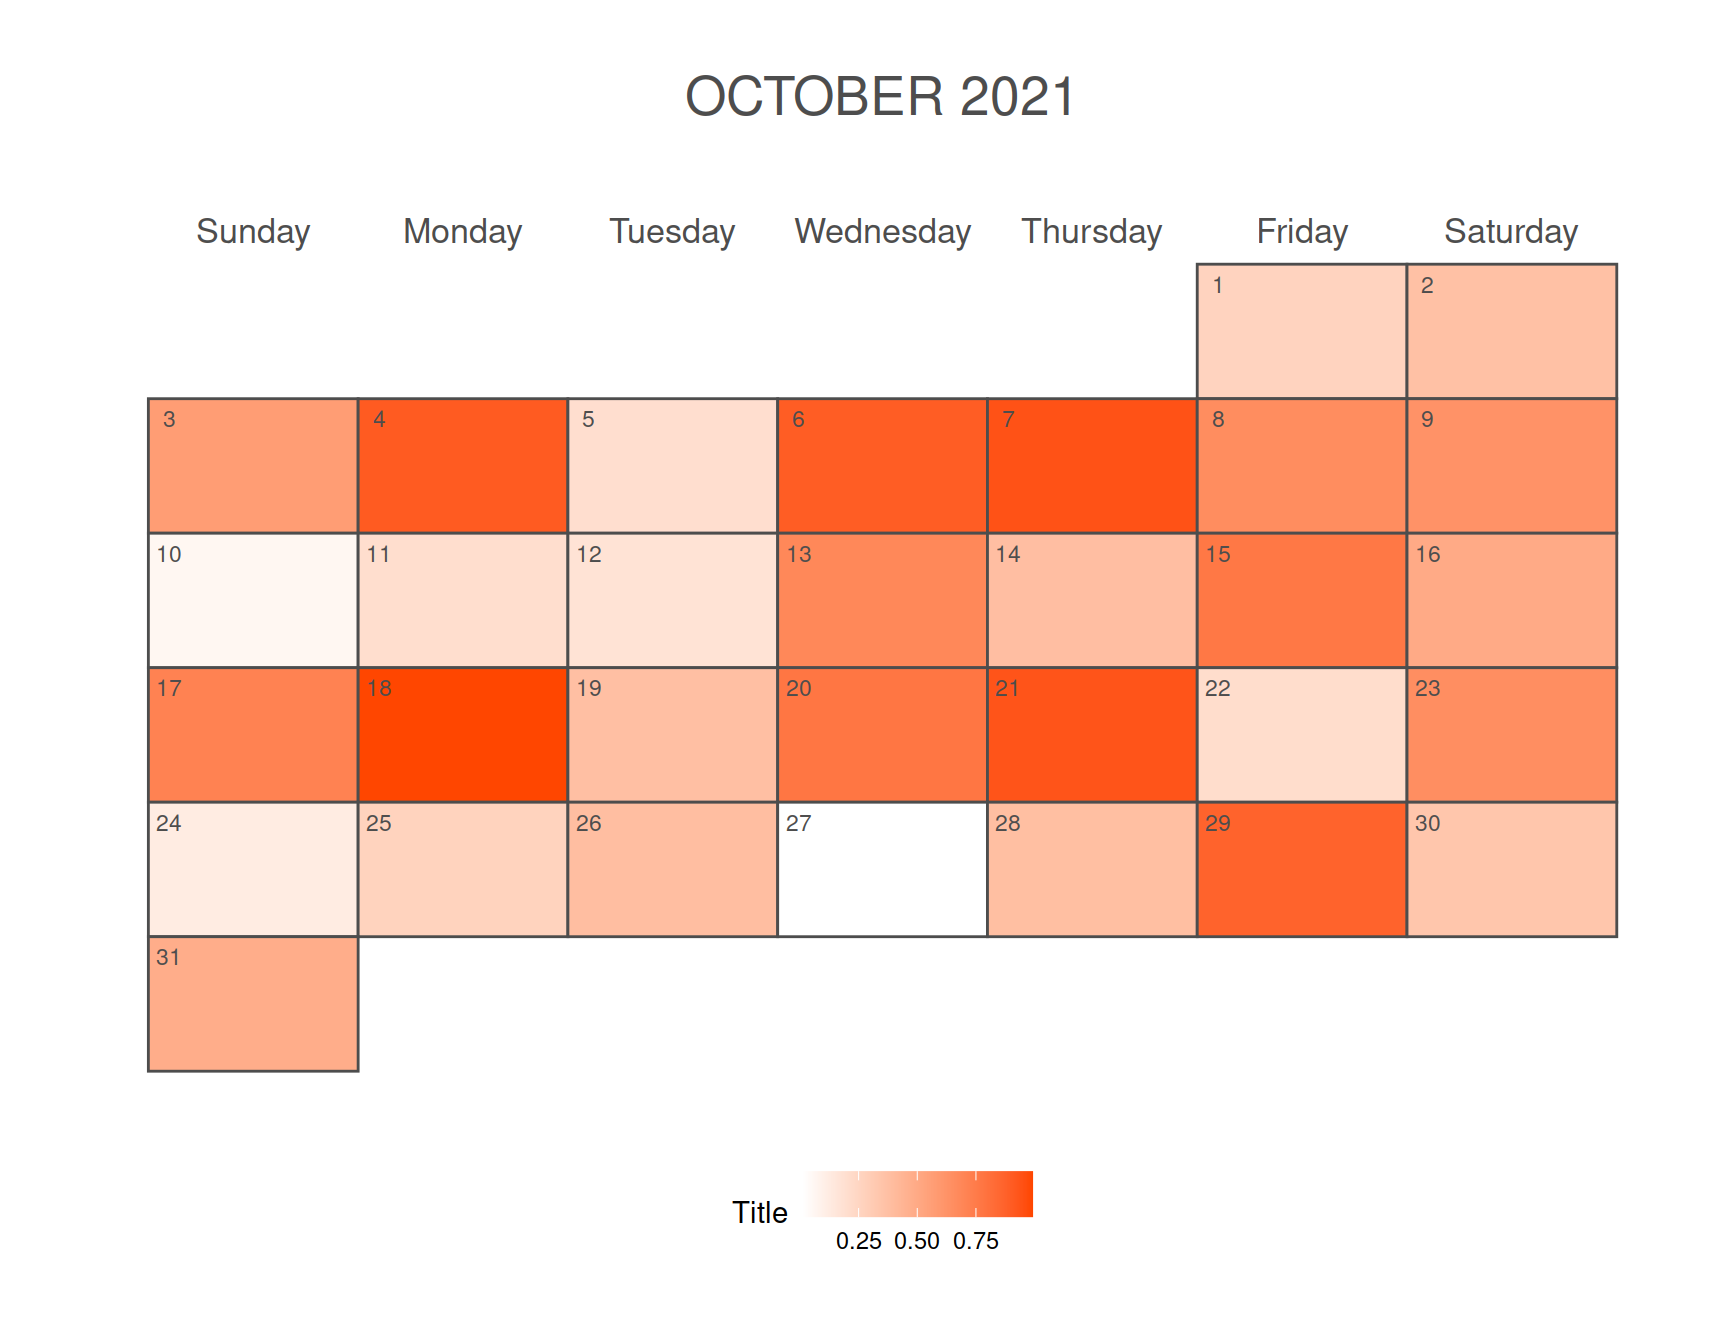
Adding a legend
In case you want to add a legend you can set its position with legend.pos. Possible values are "bottom", "top", "right" and "left". If you want to add a title use legend.title.
# install.packages(calendR)
library(calendR)

# Data
set.seed(1)
data <- runif(31)

# Calendar
calendR(year = 2021,
        month = 10,
        special.days = data,
        gradient = TRUE,
        low.col = "white",
        special.col = "#FF4600",
        legend.pos = "bottom",
        legend.title = "Title")
Heat map on certain days
By default you will need to pass as many values to the function as days in the month. However, if you want to create a heat map for only some days of the month you can follow the code below.
# install.packages(calendR)
library(calendR)

# Data
data <- runif(5)
days <- rep(min(data) - 0.05, 31)

# Fill the days
days[10:14] <- data

# Calendar
calendR(year = 2021,
        month = 10,
        special.days = days,
        gradient = TRUE,
        low.col = "white",
        special.col = "#FF4600",
        legend.pos = "bottom")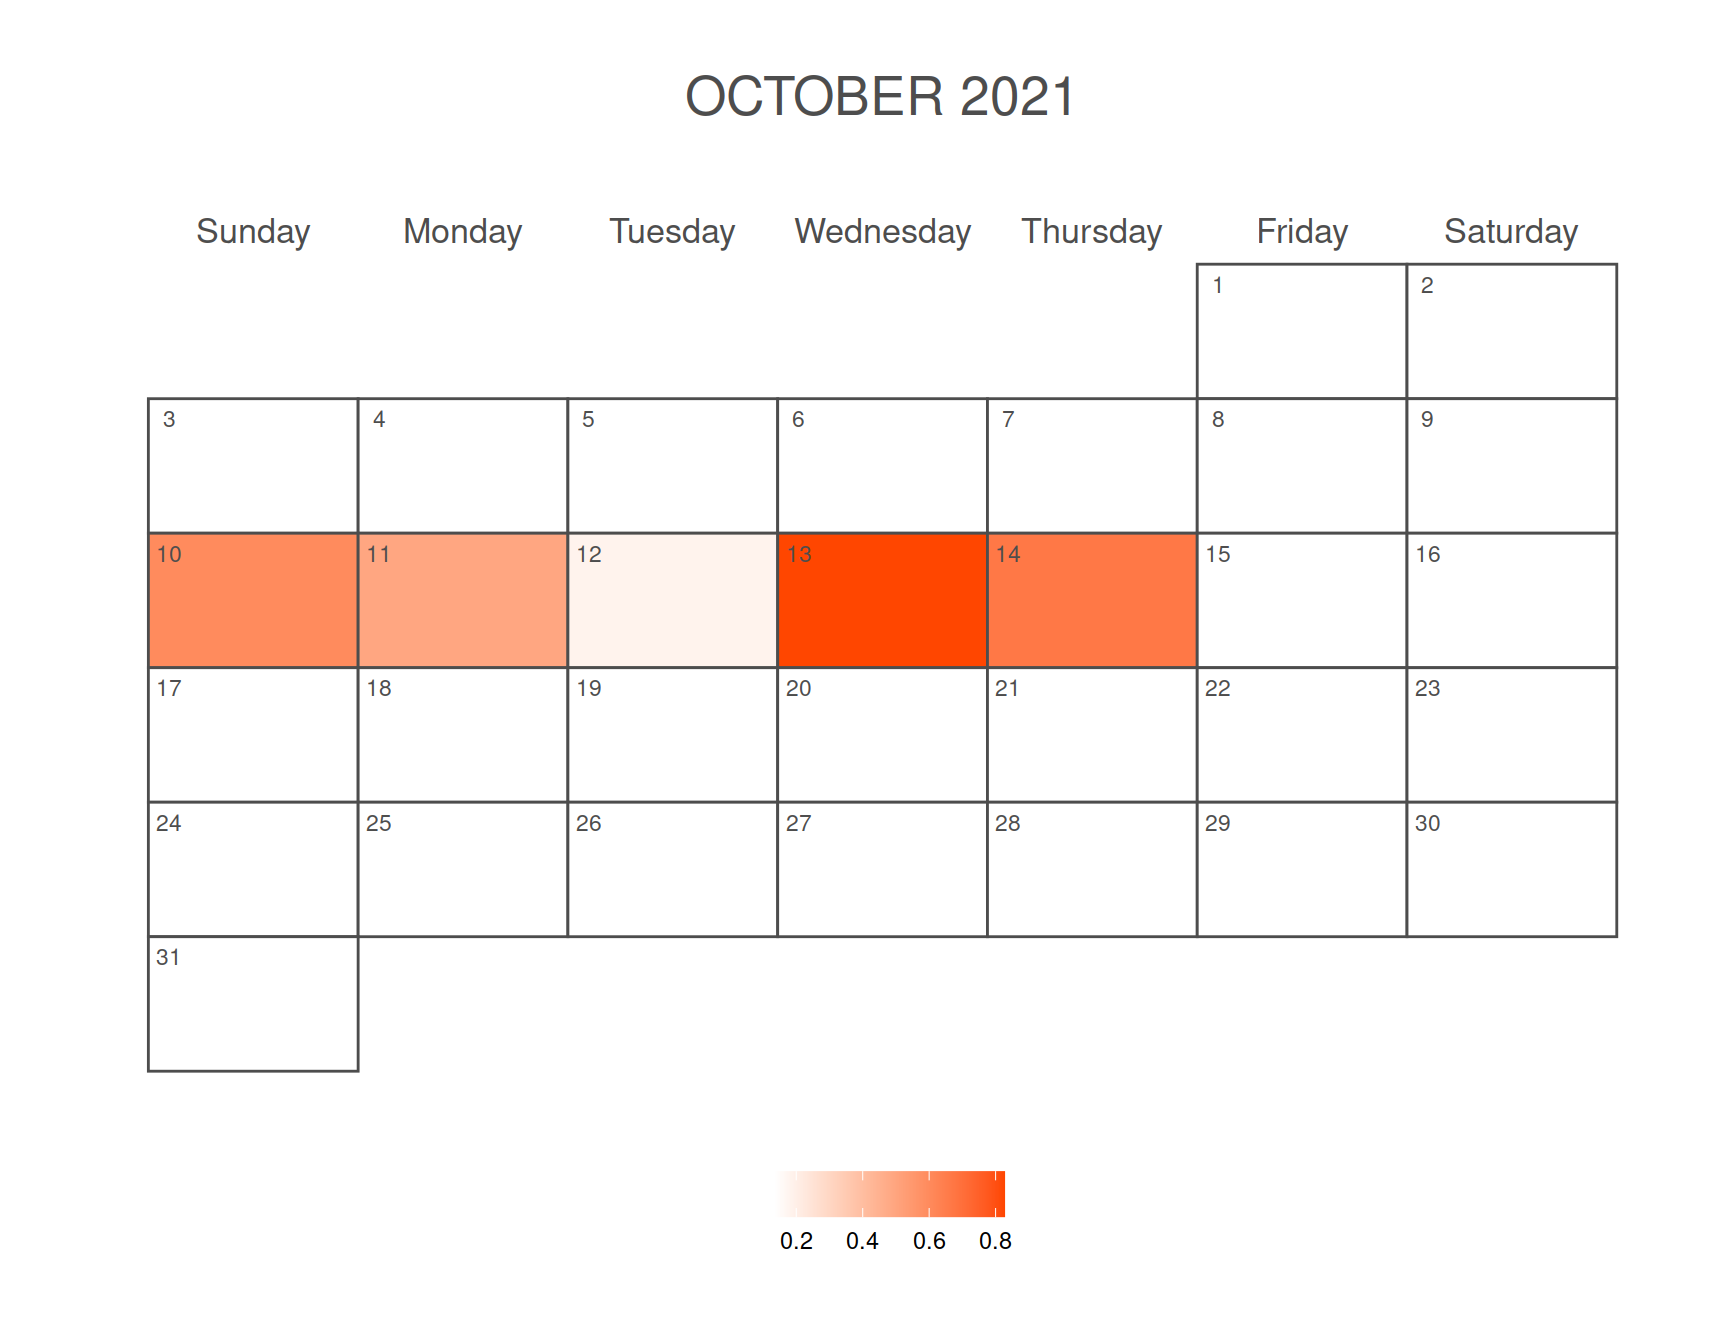

Master Statistics
Learn statistics from the basics to advanced techniques, clearly explained
Go to site