Sample data set
Consider the longley data set, which contains macroeconomic data of several years.
# Sample dataset
df <- longley

# X-axis variable
x <- df$Year

# Variables to be stacked
y <- df[, c(1, 2, 3, 4, 5, 7)]
The areaplot function
The most straightforward way for creating a stacked area chart in base R is using the areaplot package, which contains a function of the same name for this purpose. Check also the percentange stacked area chart for a stacked chart where each serie is displayed as percentage.
You can pass two numerical variables to the function or specify a formula to create the area plot. Note that the default colors are in gray scale.
# install.packages("areaplot")
library(areaplot)

# Stacked area chart
areaplot(x, y,
         main = "Stacked area chart",
         xlab = "Year")

# Equivalent to:
areaplot(.~Year, data = df,
         main = "Stacked area chart",
         xlab = "Year")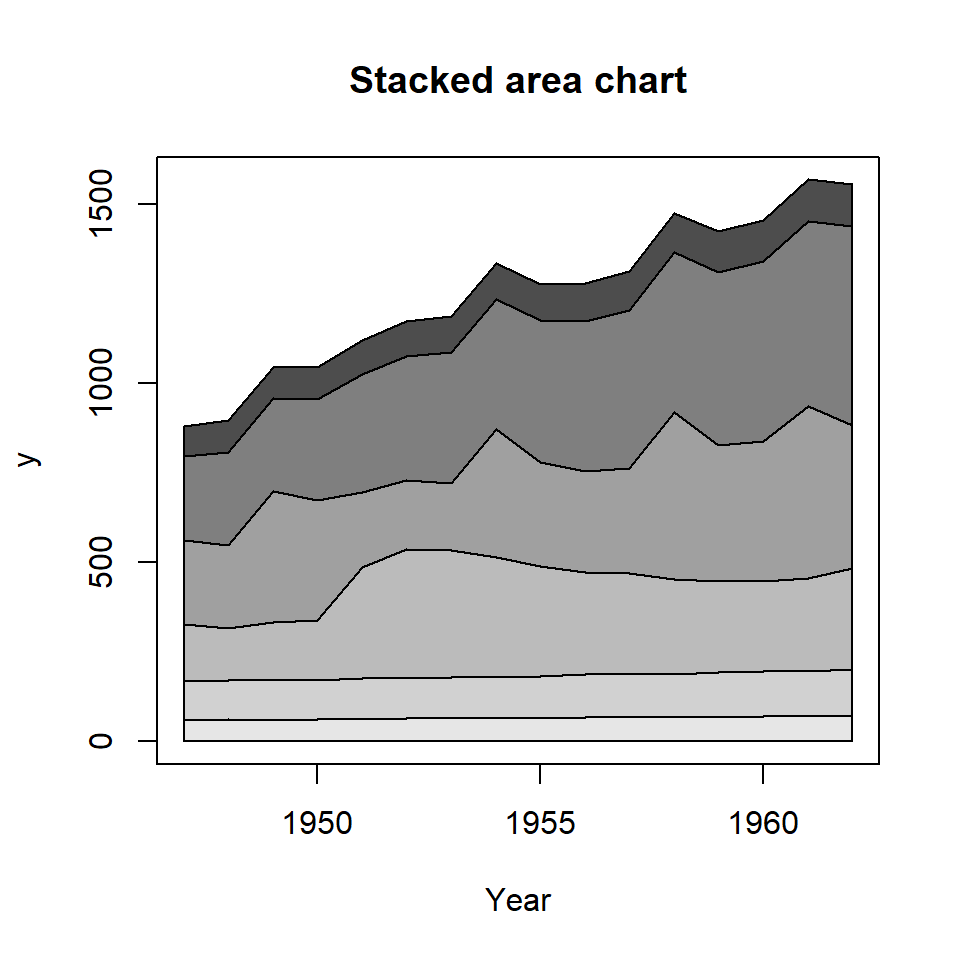
Color customization

The cols argument can be used to customize the color palette used to colorize each area. In the following example we are using the well-known viridis palette with 0.8 transparency.
# install.packages("areaplot")
library(areaplot)

# Colors
cols <- hcl.colors(6, palette = "viridis", alpha = 0.8)

# Stacked area chart with custom colors
areaplot(x, y,
         col = cols)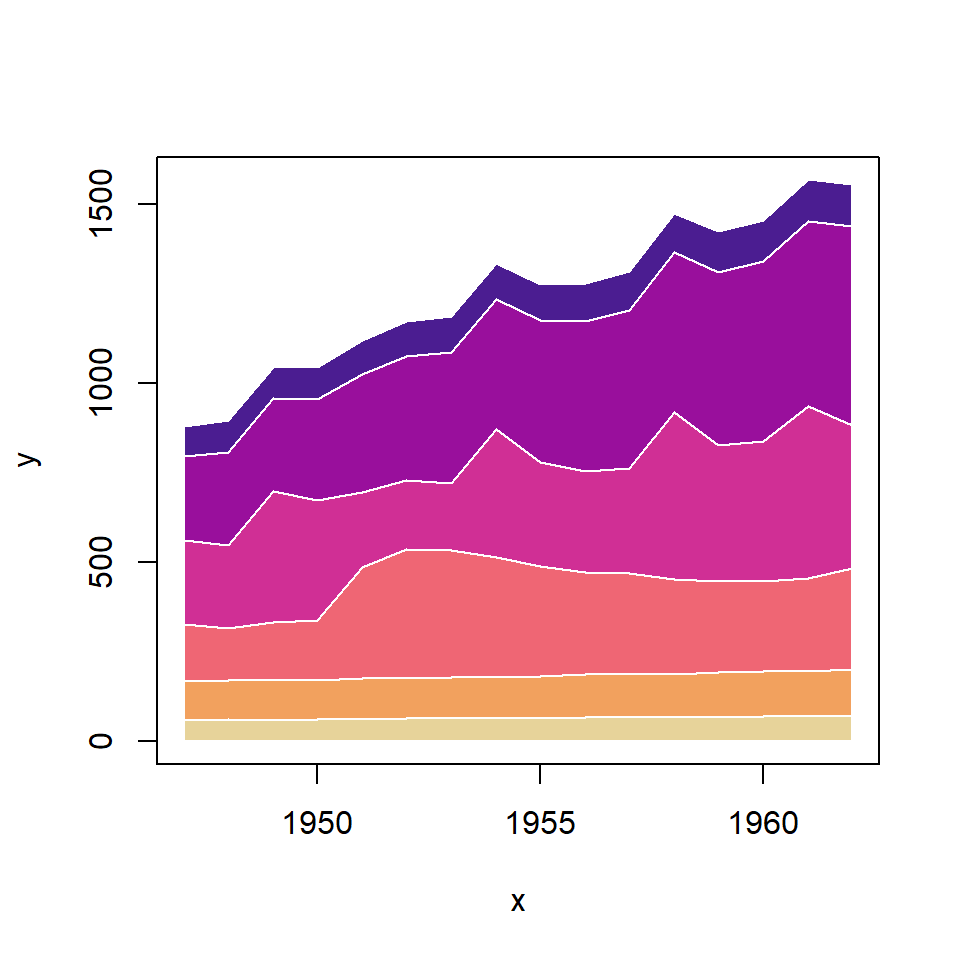
The lines style can be customized making use of additional arguments. For instance, you can customize the border color with border and change the line width and line type with lwd and lty, respectively.
# install.packages("areaplot")
library(areaplot)

# Colors
cols <- hcl.colors(6, palette = "ag_Sunset")

# Stacked area chart with custom borders
areaplot(x, y, col = cols,
         border = "white",
         lwd = 1,
         lty = 1)
Adding a legend
Setting legend = TRUE as an argument of the areaplot function a legend will be created automatically. You can override the default arguments for the legend with args.legend. See the legends article for more details.
# install.packages("areaplot")
library(areaplot)

# Colors
cols <- hcl.colors(6, palette = "PinkYl")

# Area plot with legend
areaplot(x, y, col = cols,
         legend = TRUE,
         args.legend = list(x = "topleft", cex = 0.65))

Master Statistics
Learn statistics from the basics to advanced techniques, clearly explained
Go to site