The curve function
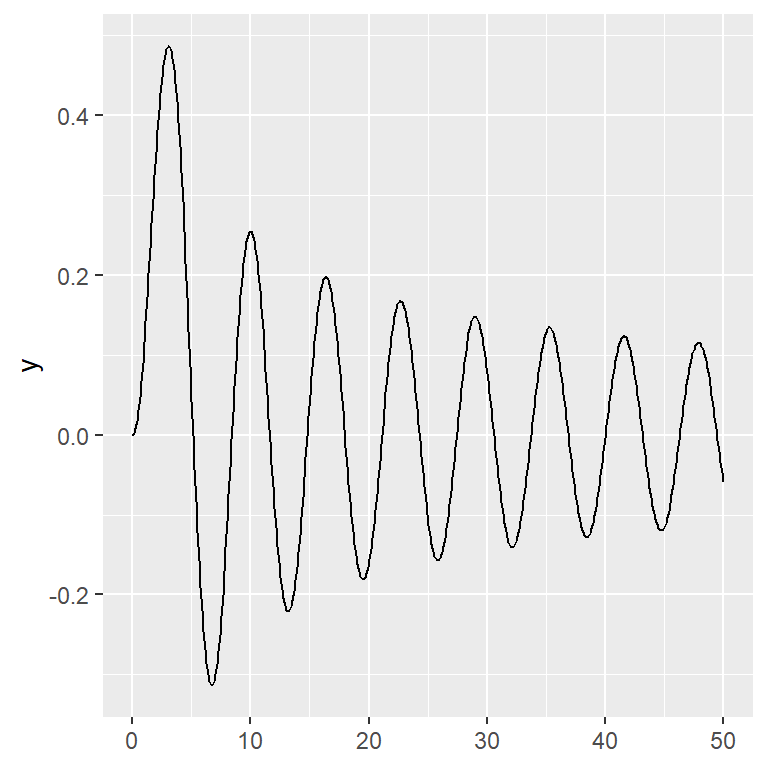
In base R it is possible to draw a function with curve. By default the function will be plotted between 0 and 1 but you can change this range with from and to.
# Function
fun <- function(x) {
  sin(sqrt(x ^ 2))
}

# Plot
curve(fun, from = -7, to = 7)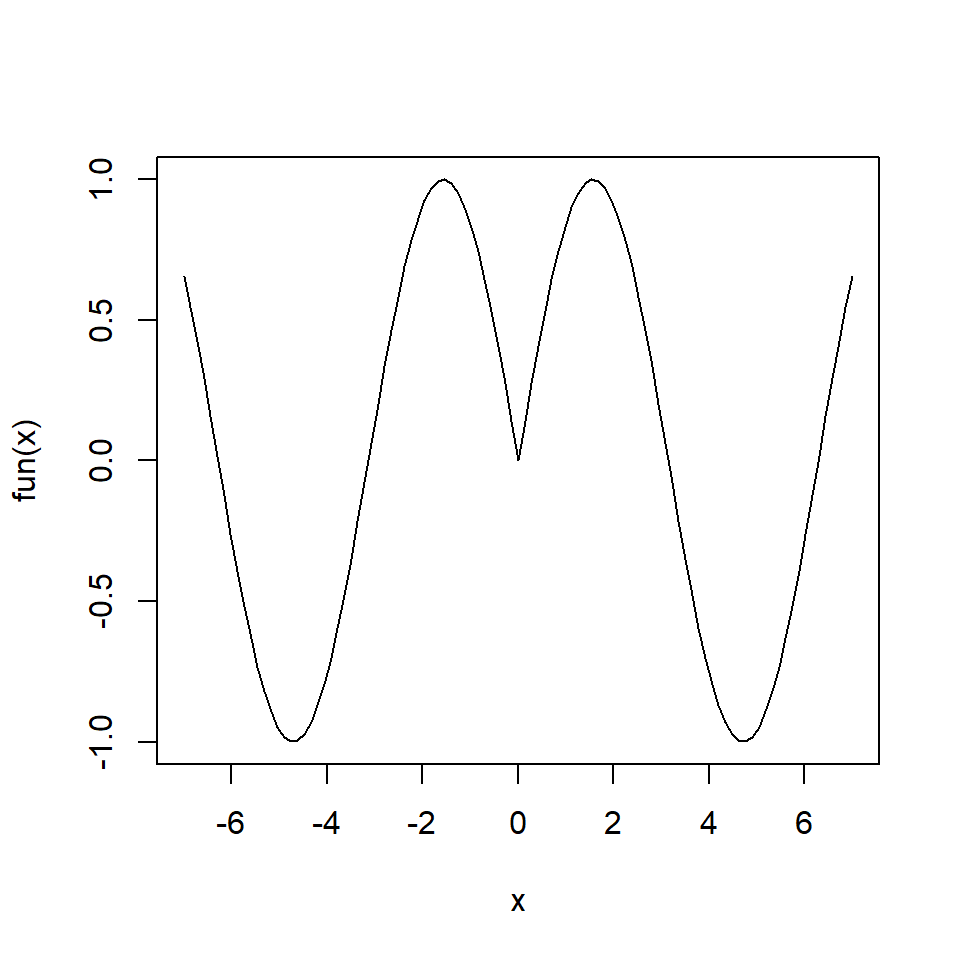
Note that curve function is very useful for plotting functions such as dnorm, dexp, cos, sin, among others.
Curve customization
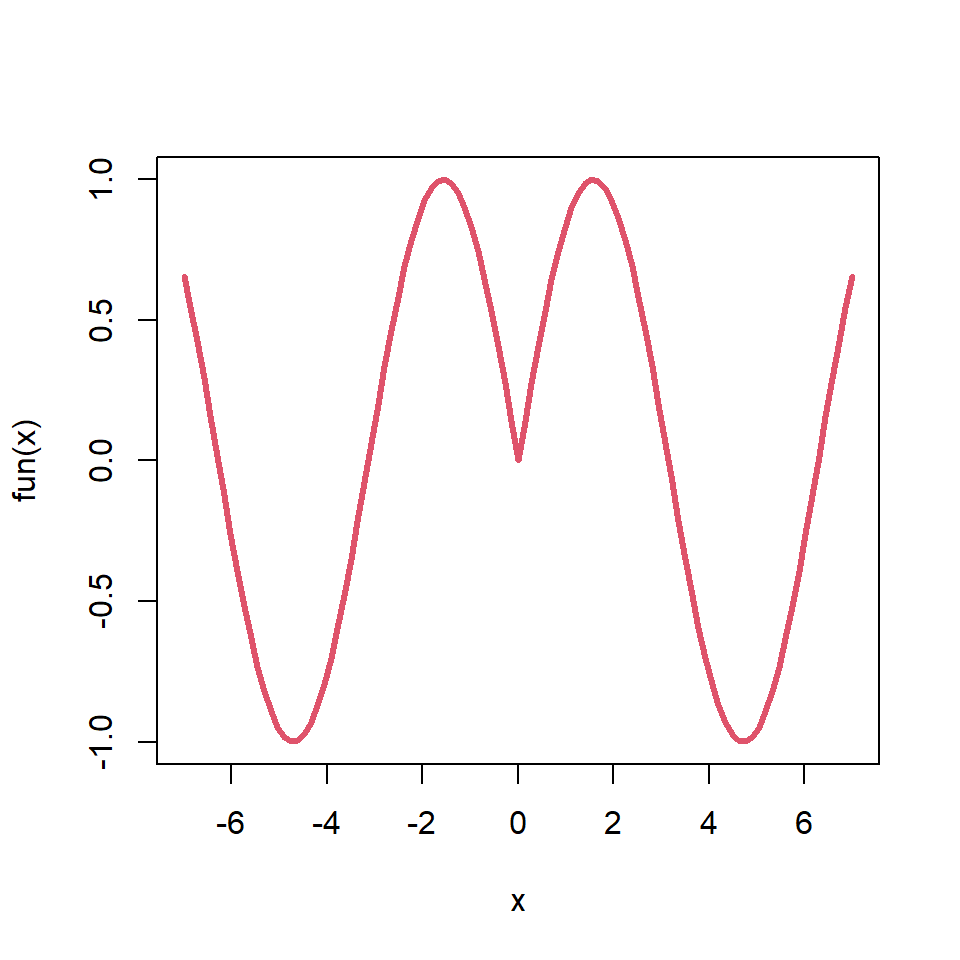
The output of the curve function can be customized the same way as other base R plots. You can change the color, the line width or the line type, among other customizations.
# Function
fun <- function(x) {
  sin(sqrt(x ^ 2))
}

# Plot
curve(fun, from = -7, to = 7,
      col = 2, lwd = 3)
Curve types
There are several line types available, which can be selected with type argument. In the following blocks of code we show a pair of examples.
Line and points
# Function
fun <- function(x) {
  sin(sqrt(x ^ 2))
}

# Plot
curve(fun, from = -7, to = 7,
      type = "o")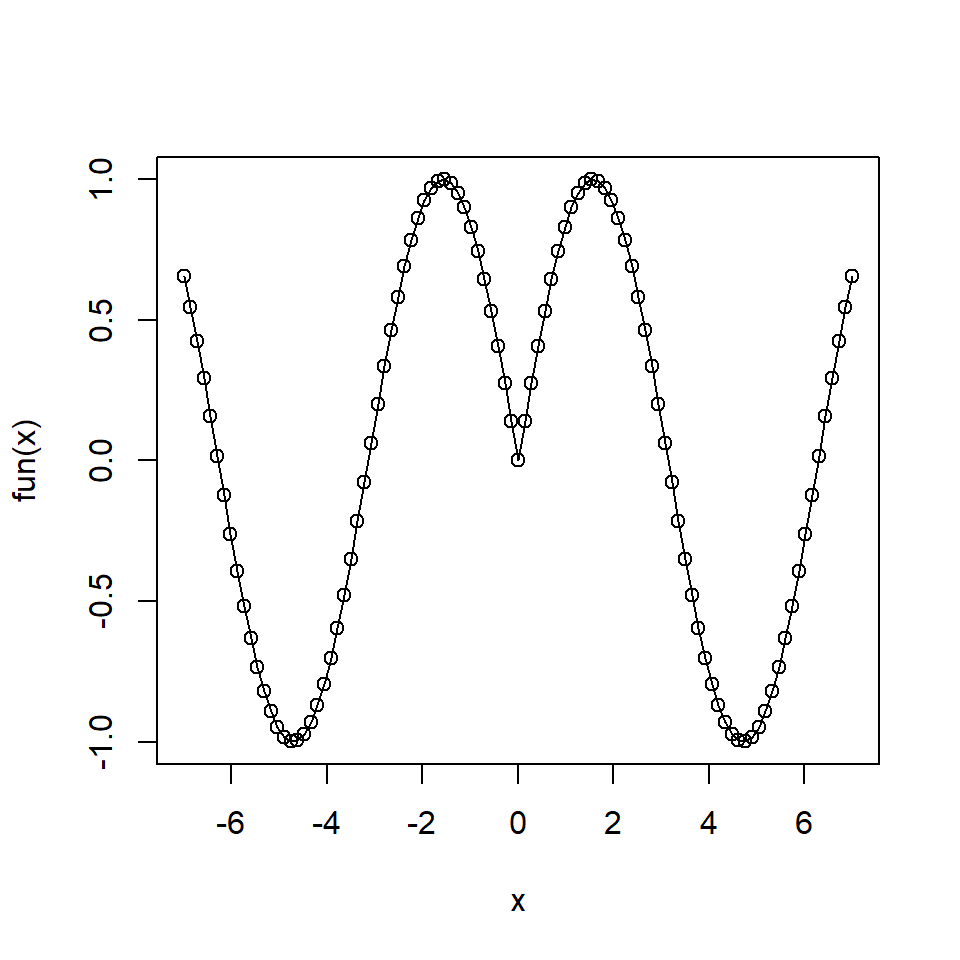
Stairs plot
# Function
fun <- function(x) {
  sin(sqrt(x ^ 2))
}

# Plot
curve(fun, from = -7, to = 7,
      type = "s")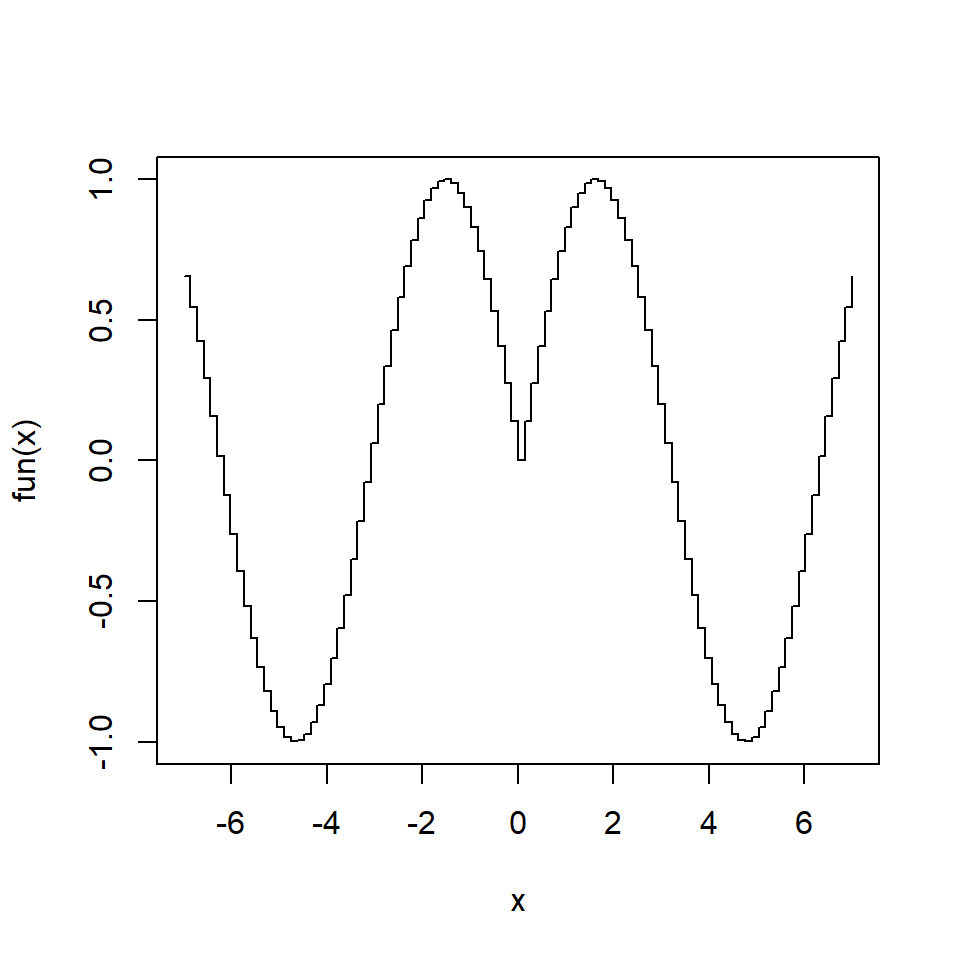
Histogram-like
# Function
fun <- function(x) {
  sin(sqrt(x ^ 2))
}

# Plot
curve(fun, from = -7, to = 7,
      type = "h")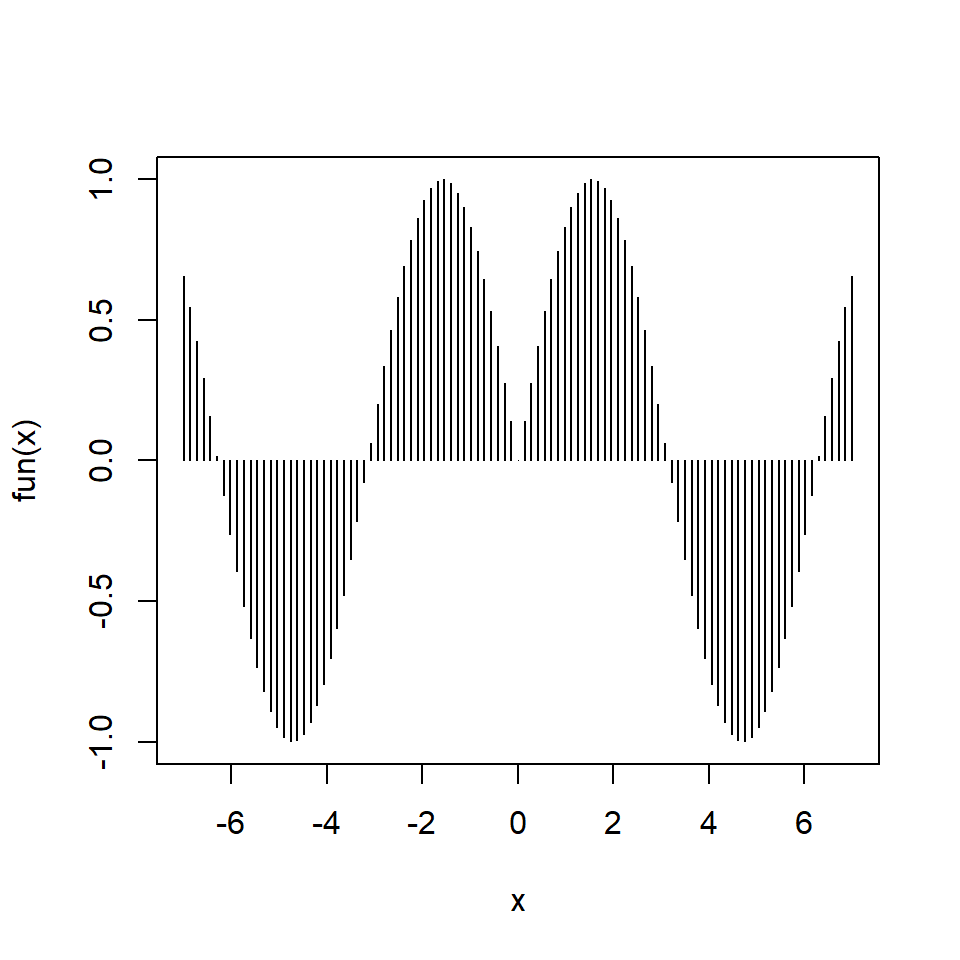
Add curves
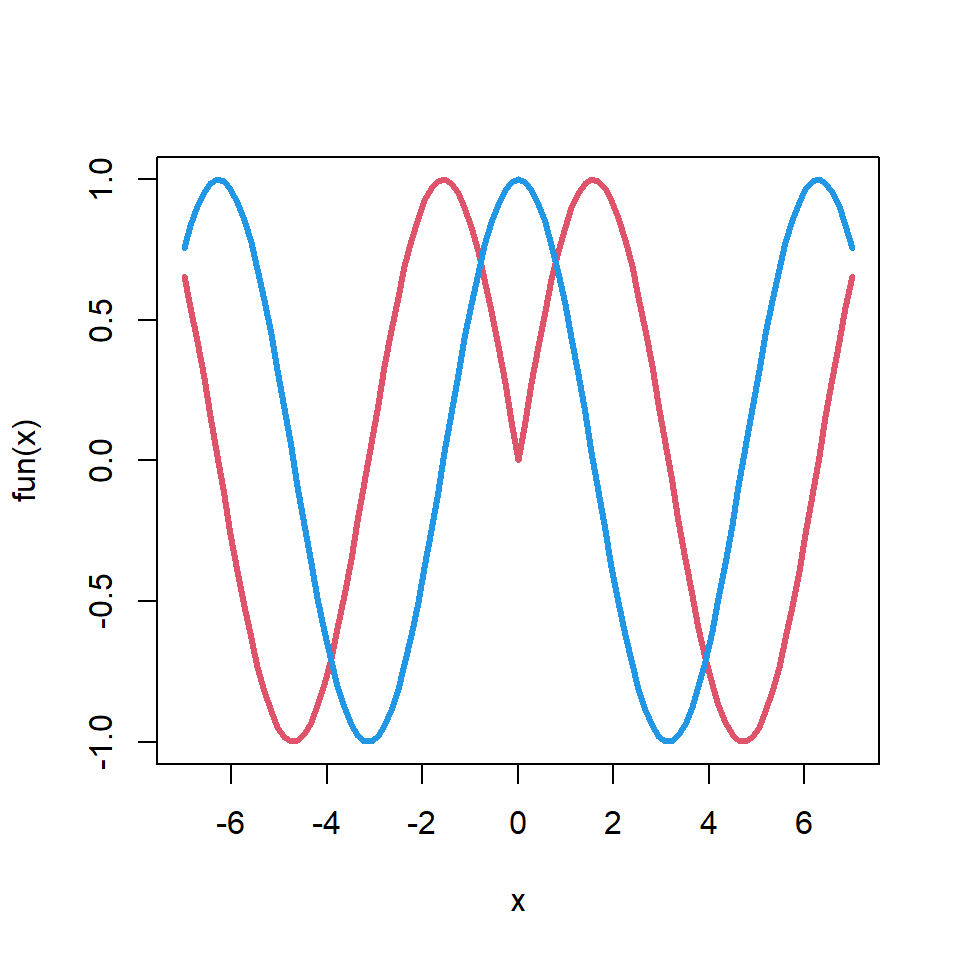
You can also add multiple curves on the same plot setting add = TRUE on the second and posterior functions.
# Function
fun <- function(x) {
  sin(sqrt(x ^ 2))
}

# Plot
curve(fun, from = -7, to = 7,
      col = 2, lwd = 3)
curve(cos, col = 4, lwd = 3,
      add = TRUE)
Master Statistics
Learn statistics from the basics to advanced techniques, clearly explained
Go to site