Sample data set
For this tutorial we are going to use the following sample data, which consists on ten realizations of a brownian motion. The corresponding data for each path is a column of the B matrix.
# Brownian motion
set.seed(1)

# Grid
t <- seq(0, 1, by = 0.001)
p <- length(t) - 1

# 10 paths
n <- 10
I <- matrix(rnorm(n * p, 0, 1 / sqrt(p)), n, p)

# Matrix
B <- apply(I, 1, cumsum)
matplot function
In order to create a line chart with all the columns of the data at the same time you can make use of matplot and setting type = "l". Note that B is a numeric matrix, but could also be a data frame or a vector and a matrix.
matplot(B, type = "l")

# Equivalent to:
matplot(as.data.frame(B), type = "l")

# Equivalent to:
matplot(matrix(t), rbind(rep(0, n), B), type = "l")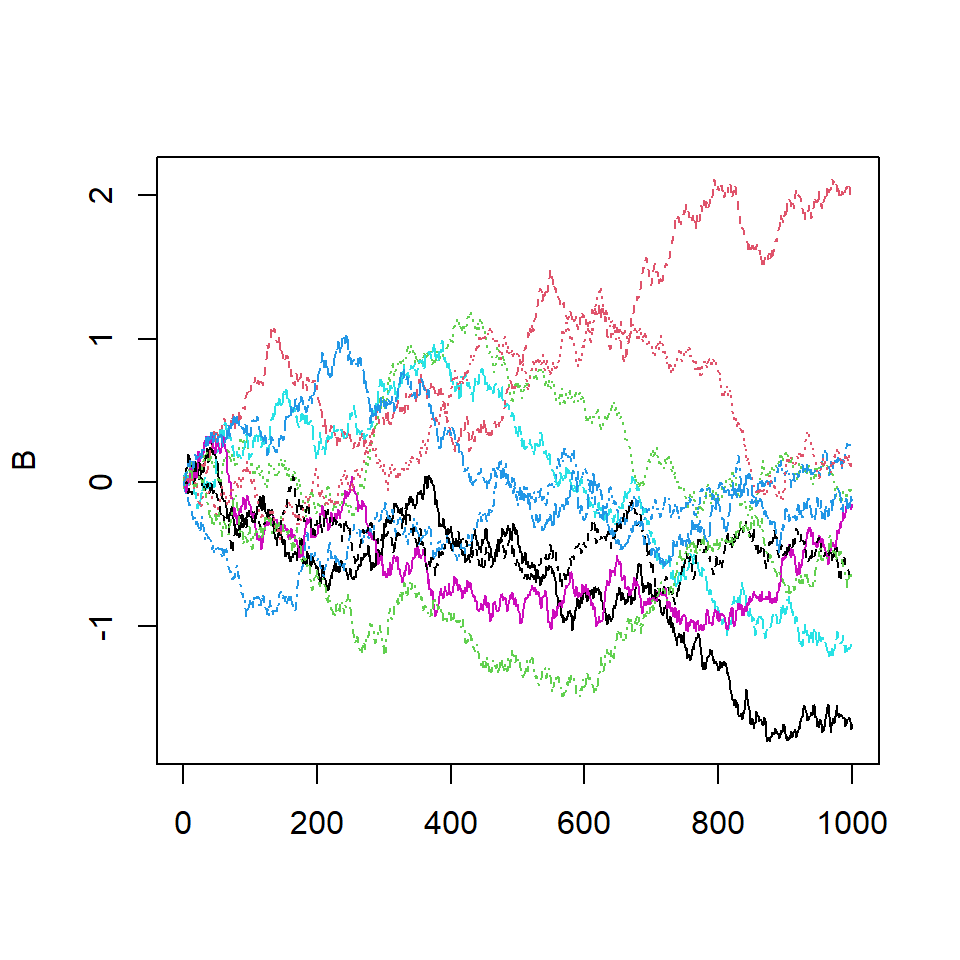
By default, the function uses colors 1 to 6, line width of 1 and line types 1 to 5 to create the lines, but his can be overridden with arguments col, lwd and lty, respectively.
# Colors
cols <- hcl.colors(10, "Temps")

matplot(B, type = "l",
        col = cols, # Colors
        lwd = 2,    # Line width
        lty = 1)    # Line type
matlines function
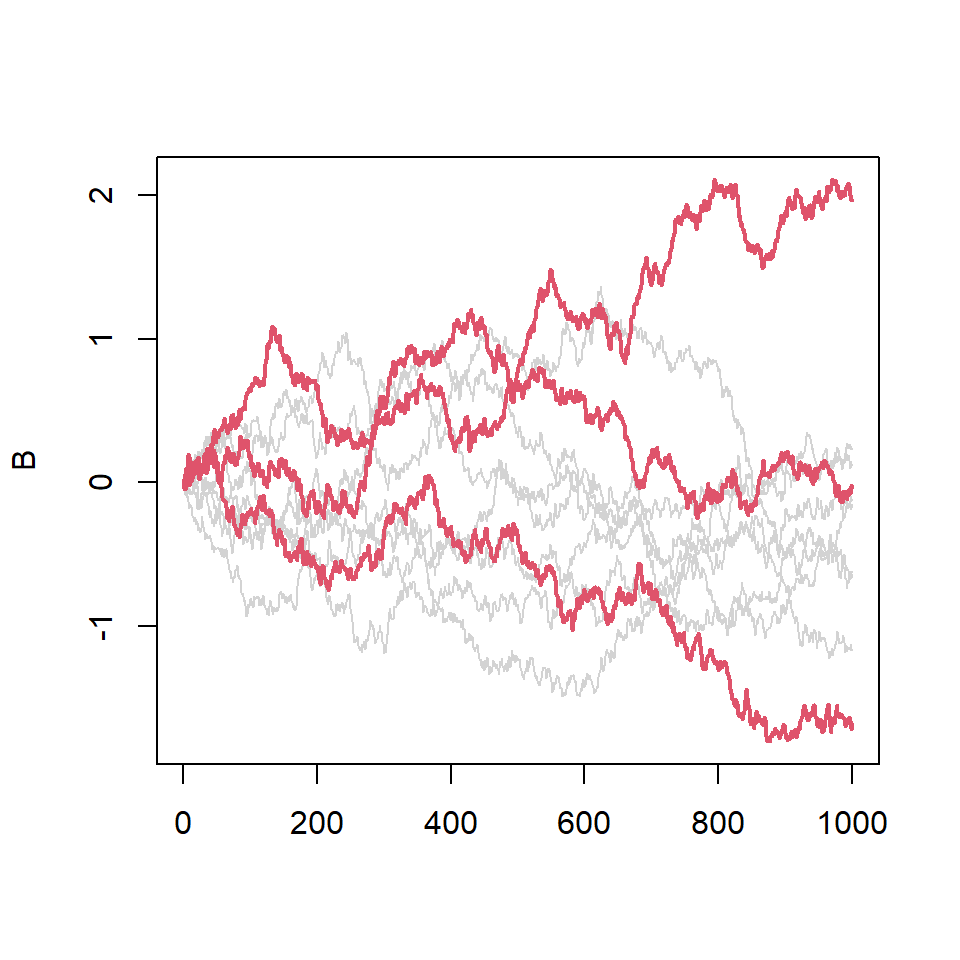
The matlines function is to matplot the same as lines is to plot. It allows you adding more lines from a data frame or matrix to the previous plot. In the following example we are using it to highlight some paths of the brownian motion.
matplot(B, type = "l",
        col = "lightgray",
        lty = 1)

# Highlight the first three columns
# with a different color
matlines(B[, 1:3], type = "l",
         col = 2, lwd = 2,
         lty = 1)
Master Statistics
Learn statistics from the basics to advanced techniques, clearly explained
Go to site