Sample data
The plotStream function of the sinkr package needs a vector of x axis values and a matrix y containing the data series as columns corresponding to x.
In this block of code we are generating a vector with 500 values and a matrix with 30 columns (series) and 500 rows, one for each observation.
The data series have been simulated making use of smoothed splines.
set.seed(1)
m <- 500
n <- 30
x <- seq(m)
y <- matrix(0, nrow = m, ncol = n)
colnames(y) <- seq(n)
for(i in seq(ncol(y))) {
  mu <- runif(1, min = 0.25 * m, max = 0.75 * m)
  SD <- runif(1, min = 5, max = 20)
  TMP <- rnorm(1000, mean = mu, sd = SD)
  HIST <- hist(TMP, breaks = c(0, x), plot = FALSE)
  fit <- smooth.spline(HIST$counts ~ HIST$mids)
  y[, i] <- fit$y
}
y <- replace(y, y < 0.01, 0)
Stream visualization plot
Basic stream plot
In order to create a stream plot you can pass the numeric vector and the matrix to the plotStream function. Note that a random wiggle is applied to the plot, so if you want to create always the same illustration set a seed.
# install.packages("remotes")
# remotes::install_github("marchtaylor/sinkr")
library(sinkr)

# Streamgraph
set.seed(1)
plotStream(x, y,
           xlim = c(100, 400),
           ylim = c(-125, 125))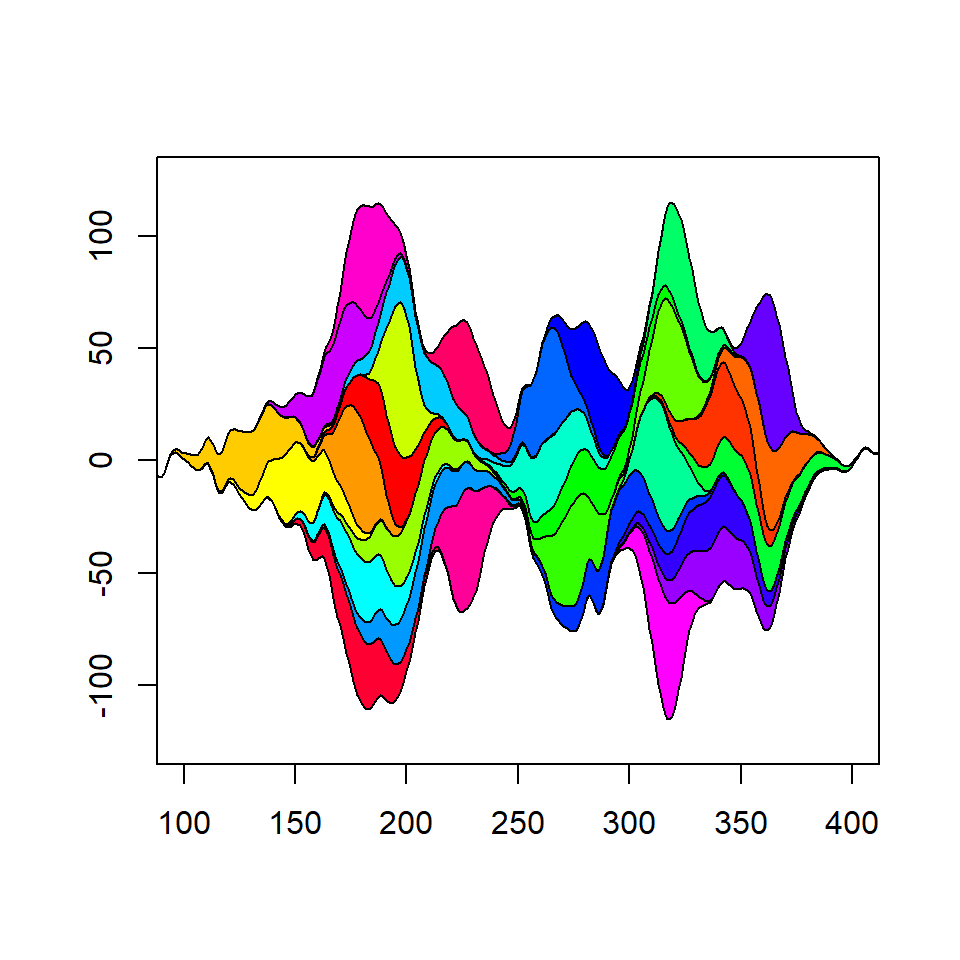
Wiggle
The amount of wiggle applied can be customized with the frac.rand and spar arguments. The first controls the fraction of the overall data stream used to define the range of the wiggle while the latter controls the smoothness of baseline.
# install.packages("remotes")
# remotes::install_github("marchtaylor/sinkr")
library(sinkr)

# Streamgraph
set.seed(1)
plotStream(x, y,
           xlim = c(100, 400),
           ylim = c(-125, 125),
           frac.rand = 0.2,
           spar = 0.5)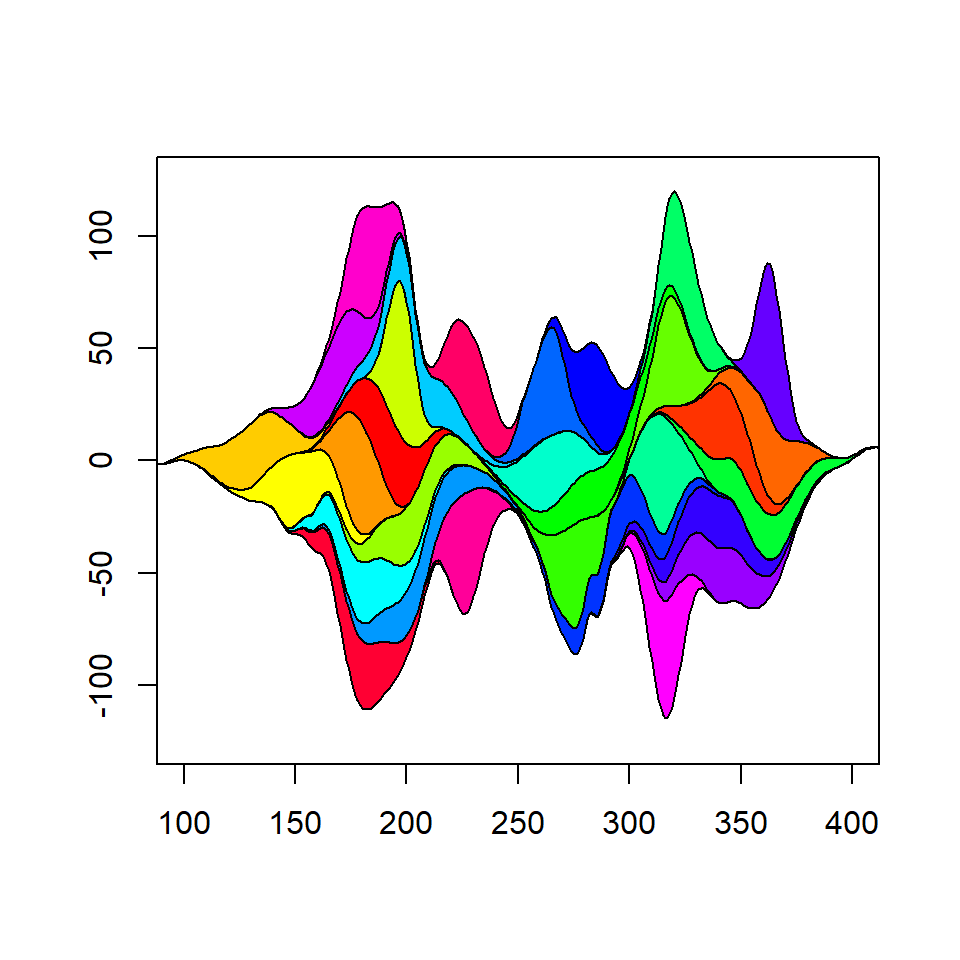
Color palette
The default color palette is the rainbow palette. However, you can customize it with the col argument. In the example below we are generating a palette with hcl.colors of 30 colors (the number of columns of y).
# install.packages("remotes")
# remotes::install_github("marchtaylor/sinkr")
library(sinkr)

# Colors
cols <- hcl.colors(30, "BluYl")

# Streamgraph
set.seed(1)
plotStream(x, y,
           xlim = c(100, 400),
           ylim = c(-125, 125),
           col = cols)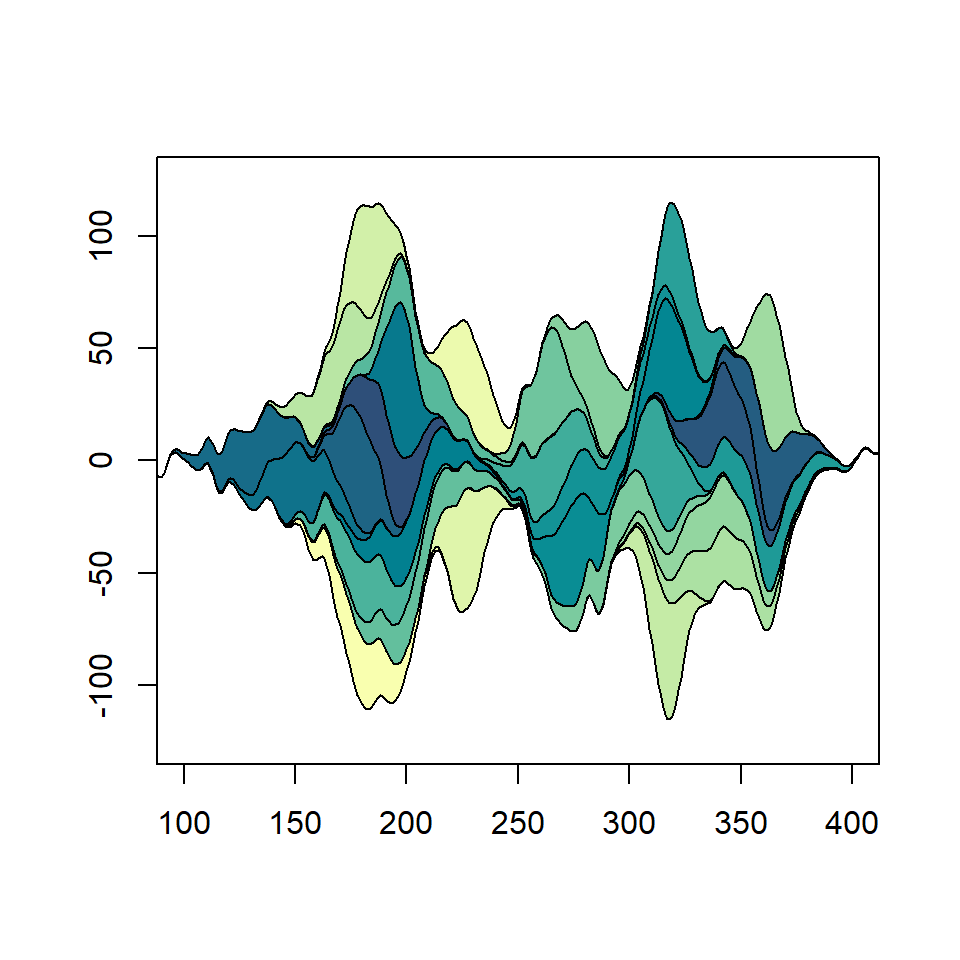
Border customization
The color, line width and line type of the polygons used to create the plot can be customized with the border, lwd and lty arguments, respectively.
# install.packages("remotes")
# remotes::install_github("marchtaylor/sinkr")
library(sinkr)

# Streamgraph
set.seed(1)
plotStream(x, y, xlim = c(100, 400),
           ylim = c(-125, 125),
           col = hcl.colors(30, "Blues 3"),
           border = "white", lwd = 1, lty = 1)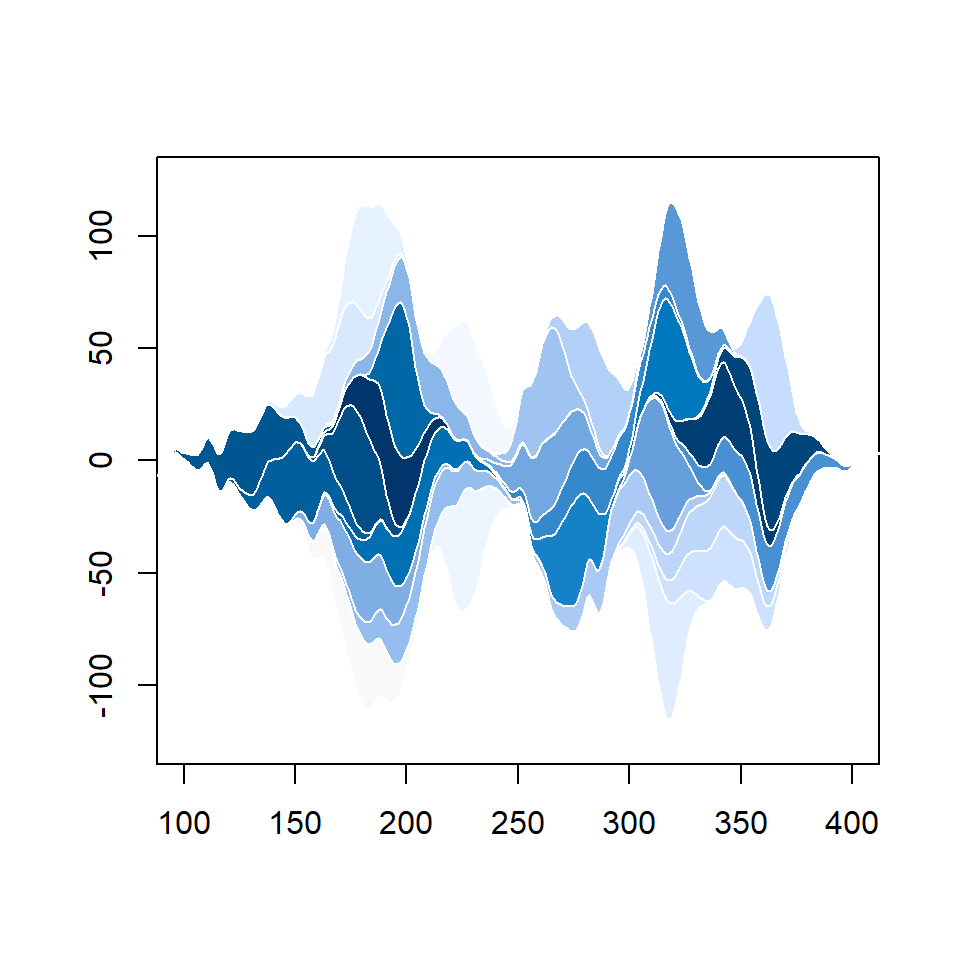
Order methods
The function provides three different ordering plotting methods with the order.method argument. The default is "as.is", but you can also set "max" or "first". Type ?plotStream for further details.
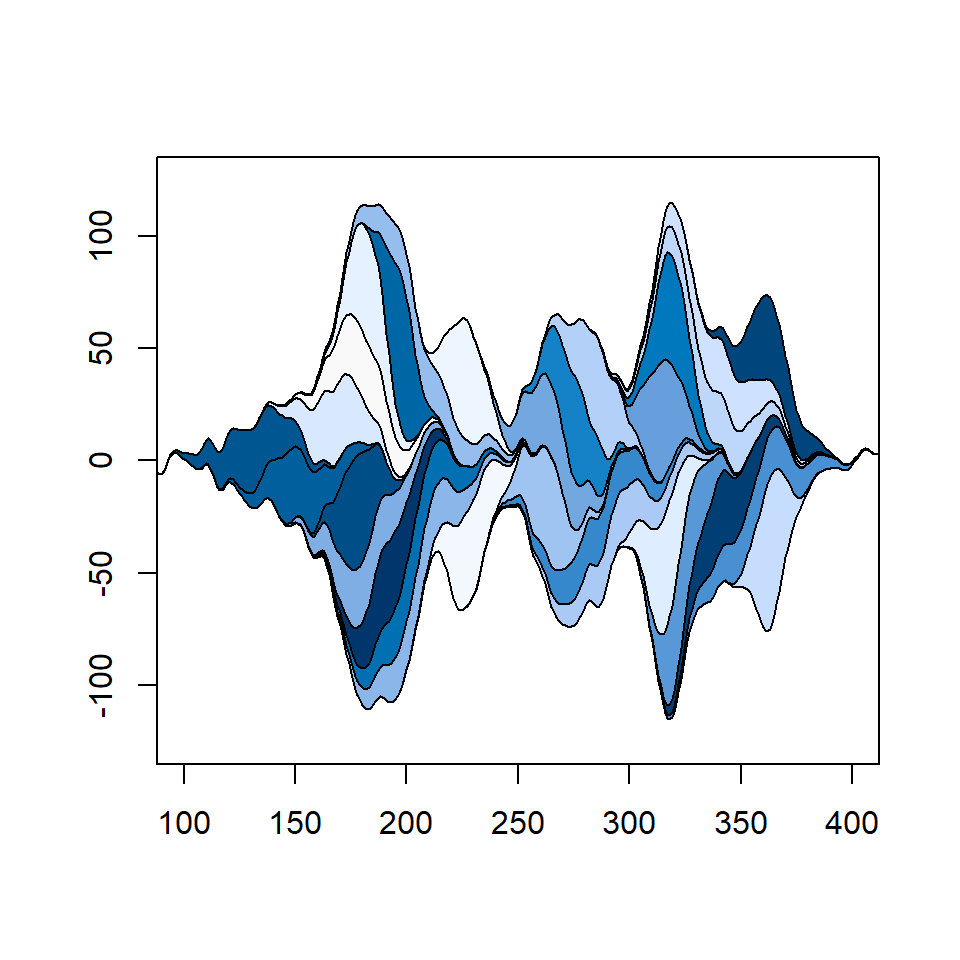
“max” order method
# install.packages("remotes")
# remotes::install_github("marchtaylor/sinkr")
library(sinkr)

# Streamgraph
set.seed(1)
plotStream(x, y, xlim = c(100, 400),
           ylim = c(-125, 125),
           col = hcl.colors(30, "Blues 3"),
           order.method = "max")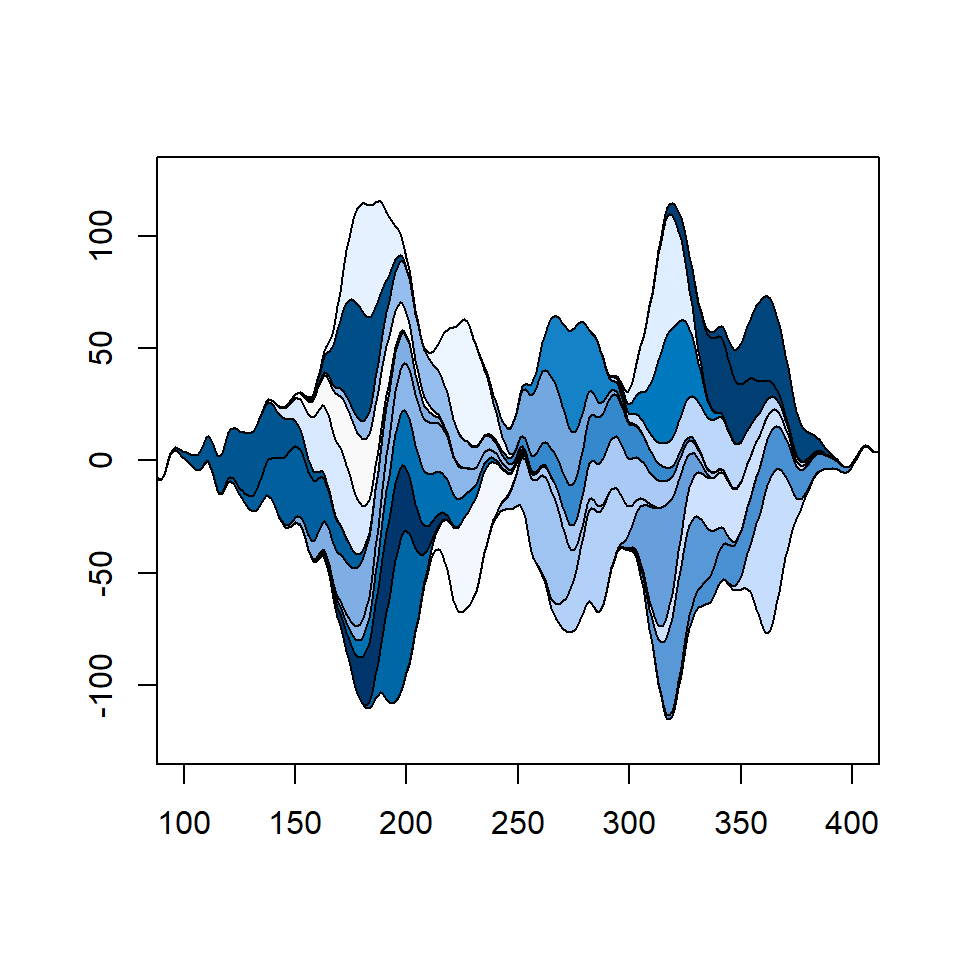
“first” order method
# install.packages("remotes")
# remotes::install_github("marchtaylor/sinkr")
library(sinkr)

# Streamgraph
set.seed(1)
plotStream(x, y, xlim = c(100, 400),
           ylim = c(-125, 125),
           col = hcl.colors(30, "Blues 3"),
           order.method = "first")