Data
The ggparliament package was developed to create parliament diagrams with ggplot2. The library also provides a sample dataset with election data of several countries.
In this tutorial we are going to use the data from the 2016 State Duma, Russia elections for all the examples. However, it should be noted that depending on each country the parliament type will be different, so you should use the corresponding type depending on the data you want to display. Available types are "semicircle", (USA, France, Spain, …) "circle", "opposing_benches" (United Kingdom), "classroom" and "horsehoe" (Australia, New Zealand).
# install.packages("ggparliament")
library(ggparliament)
# install.packages("tidyverse")
library(tidyverse)

# Data
ru <- election_data %>%
  filter(country == "Russia" & year == 2016)
Semicircle parliament
In order to create a parliament diagram in ggplot2 with ggparliament you will need to transform your data to a format that the package can understand. For that purpose you can use the parliament_data function, where you can specify your original dataset, the type of parliament and its number of rows, the seats per party and other arguments.
Then you can pass your data to ggplot2 and use the geom_parliament_seats() function. Note that the package provides a custom theme named theme_ggparliament.
# install.packages("ggparliament")
library(ggparliament)
# install.packages("tidyverse")
library(tidyverse)

# Create the data frame to be used
ru_semicircle <- parliament_data(election_data = ru,
                                 type = "semicircle", # Parliament type
                                 parl_rows = 10,      # Number of rows of the parliament
                                 party_seats = ru$seats) # Seats per party

ggplot(ru_semicircle, aes(x = x, y = y, colour = party_short)) +
  geom_parliament_seats() +
  theme_ggparliament() +
  labs(title = "Russia, 2016") +
  scale_colour_manual(values = ru_semicircle$colour,
limits = ru_semicircle$party_short) 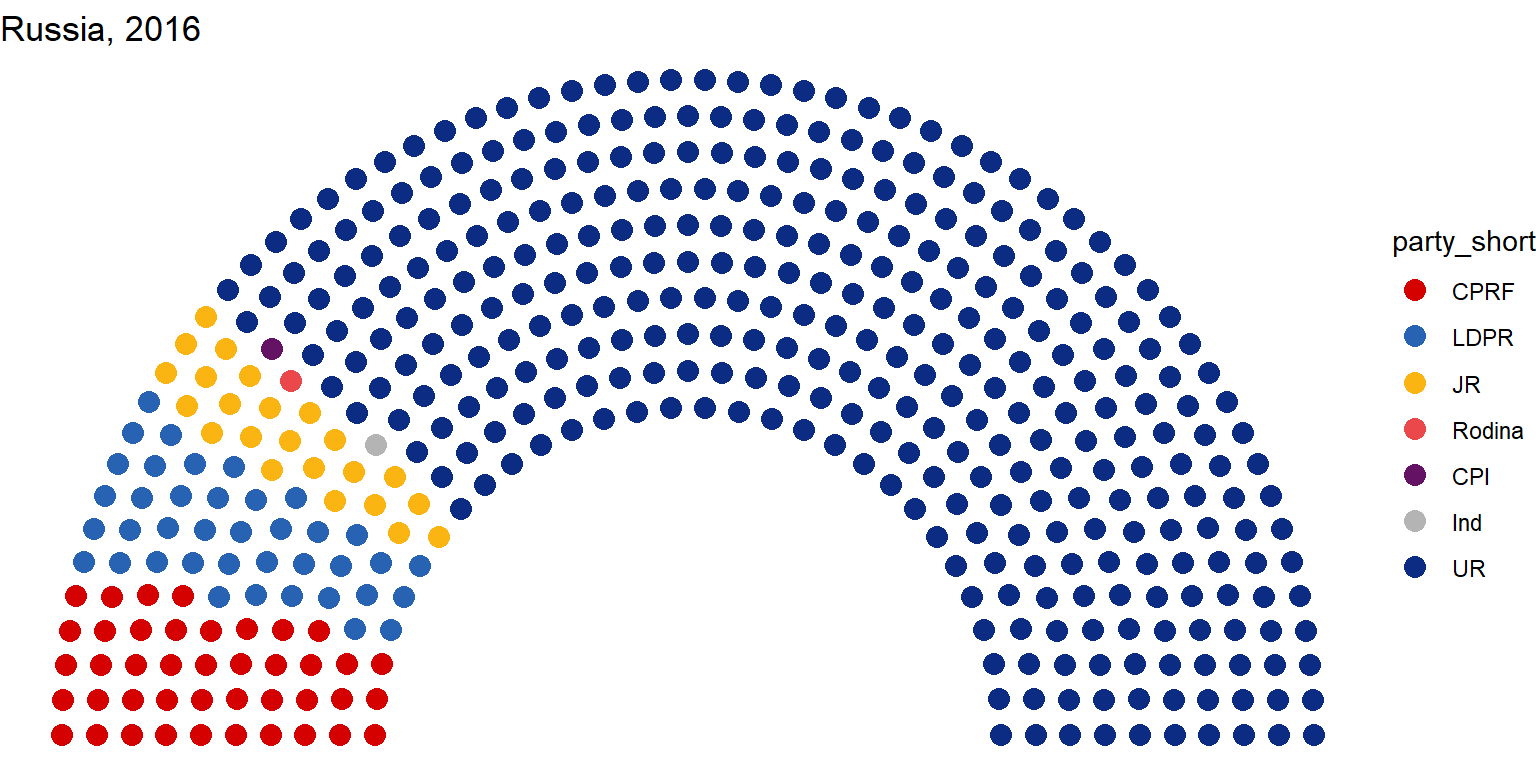
Circle parliament
If you want to create other type of parliament just pass other available type to the type argument of the parliament_data function. In the following example we are creating a circle parliament, used in some nations.
# install.packages("ggparliament")
library(ggparliament)
# install.packages("tidyverse")
library(tidyverse)

ru_circle <- parliament_data(election_data = ru,
                             type = "circle",
                             parl_rows = 10,
                             party_seats = ru$seats)

ggplot(ru_circle, aes(x = x, y = y, colour = party_short)) +
  geom_parliament_seats() +
  theme_ggparliament() +
  labs(title = "Russia, 2016") +
  scale_colour_manual(values = ru_circle$colour,
limits = ru_circle$party_short) 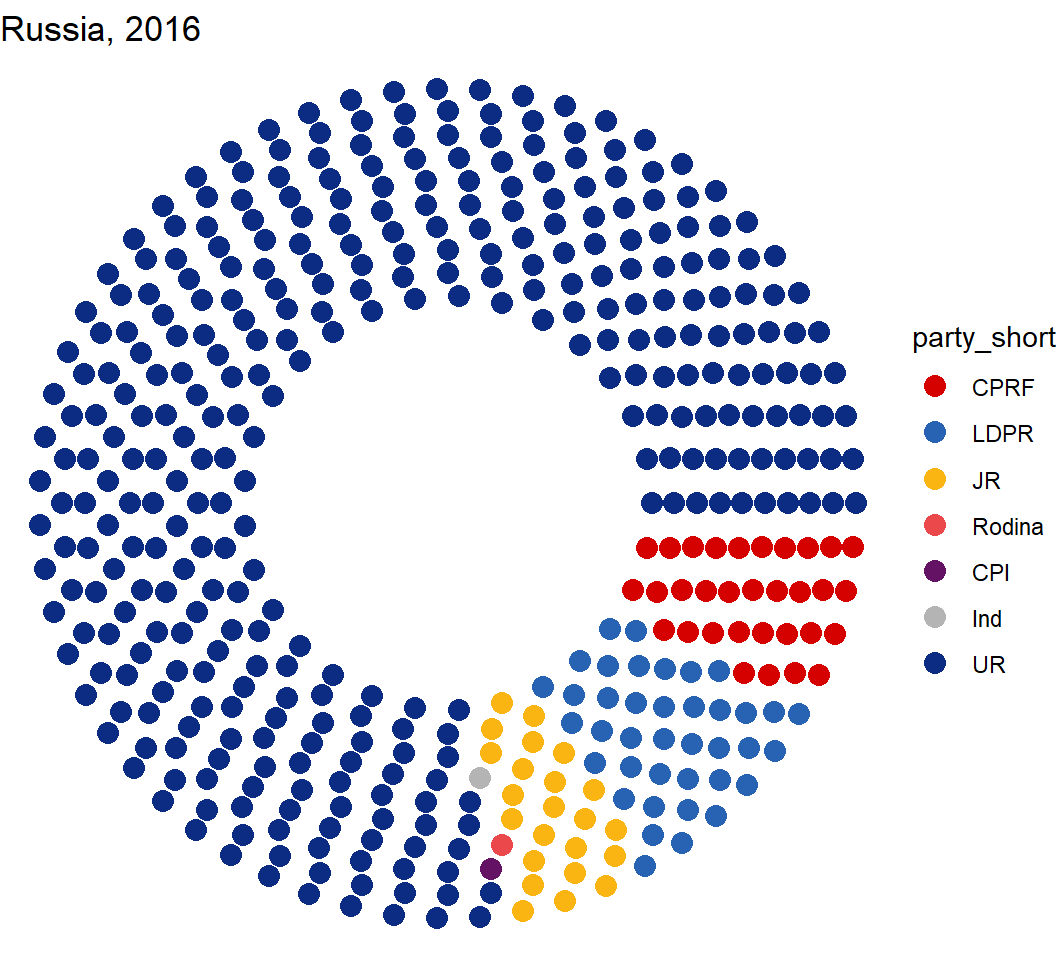
Opposing benches parliament
The opposing benches parliament type can be selected passing "opposing_benches" to the type argument of the parliament_data function. However, this type of parliament also requires specifying the group argument as shown below. Note that we have rotated the default plot with cood_flip.
# install.packages("ggparliament")
library(ggparliament)
# install.packages("tidyverse")
library(tidyverse)

ru_ob <- parliament_data(election_data = ru,
                         type = "opposing_benches",
                         group = ru$government,
                         parl_rows = 10,
                         party_seats = ru$seats)

ggplot(ru_ob, aes(x = x, y = y, colour = party_short)) +
  geom_parliament_seats() +
  theme_ggparliament() +
  labs(title = "Russia, 2016") +
  scale_colour_manual(values = ru$colour,
                      limits = ru$party_short) +
  coord_flip()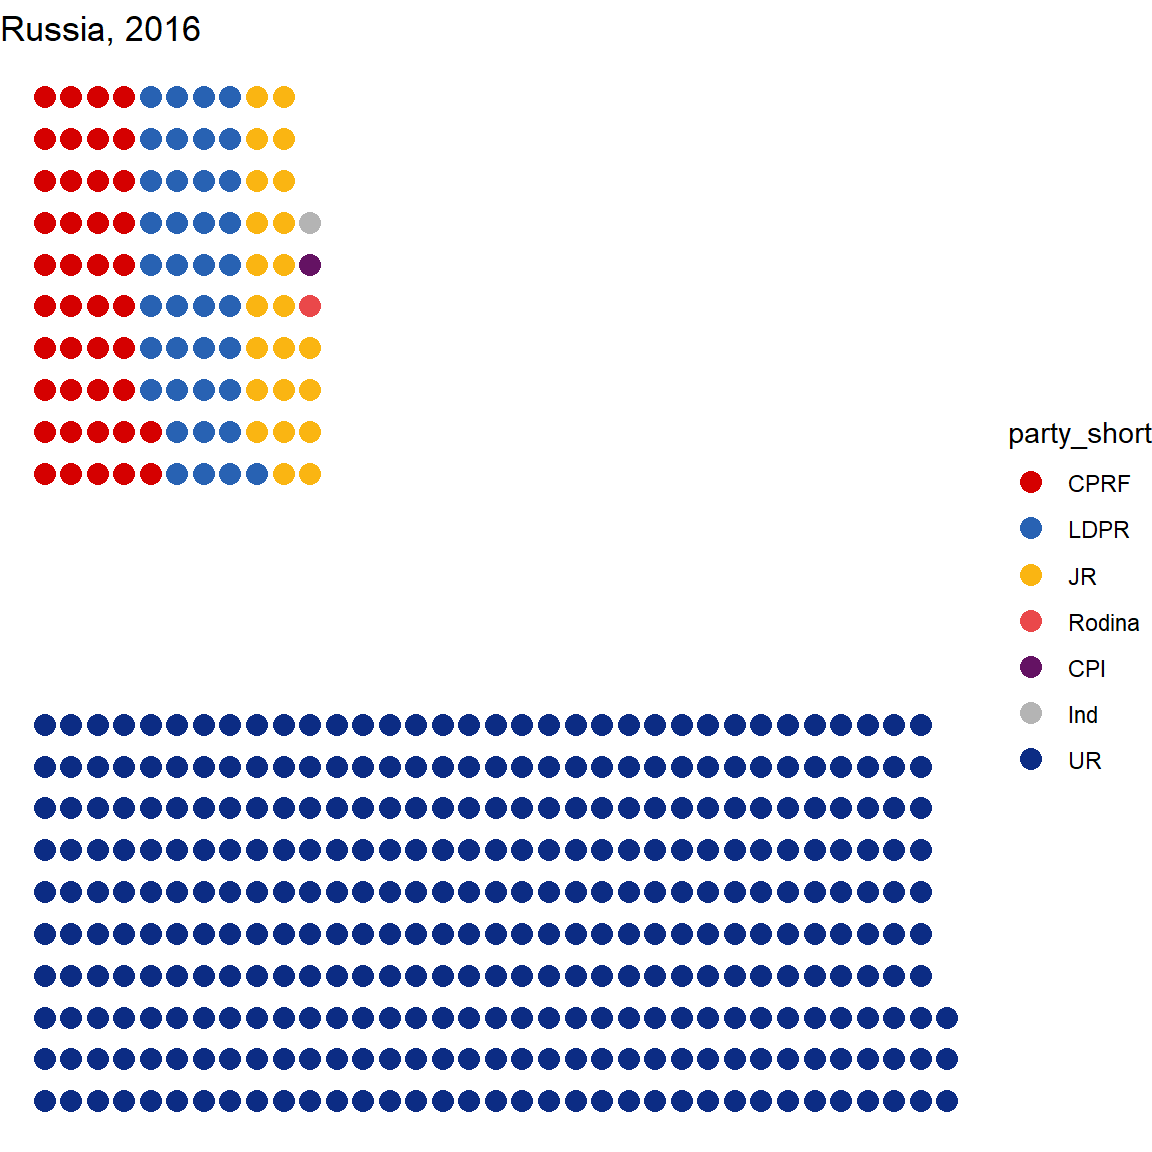
Classroom parliament
The last type of parliament we are going to review is the classroom parliament. Similarly to the previous types you just need to pass the type to the corresponding argument of the parliament_data function.
# install.packages("ggparliament")
library(ggparliament)
# install.packages("tidyverse")
library(tidyverse)

ru_classroom <- parliament_data(election_data = ru,
                                type = "classroom",
                                parl_rows = 11,
                                party_seats = ru$seats)

ggplot(ru_classroom, aes(x = x, y = y, colour = party_short)) +
  geom_parliament_seats() +
  theme_ggparliament() +
  labs(title = "Russia, 2016") +
  scale_colour_manual(values = ru$colour,
limits = ru$party_short) 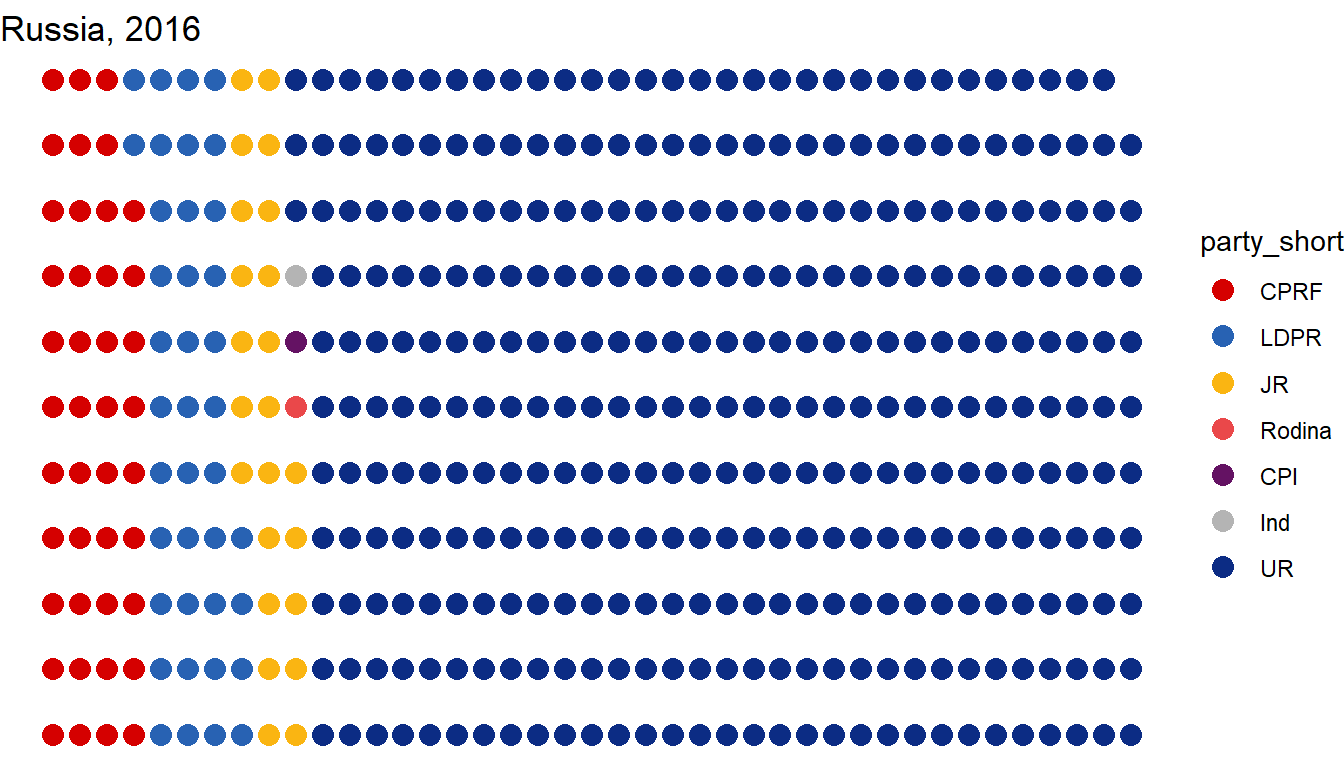
Further customization
The package provides additional functions to customize the parliament diagrams, such as labeling parties, drawing the majority threshold line, highlighting parties in power, …
In the following examples we are going to use the semicircle diagram but you could use the same functions for other types of parliaments.
Highlight government and draw majority threshold
The geom_highlight_government function allows highlighting governments or parties in control of the legislature. In addition, the draw_majoritythreshold function allows adding a line indicating the majority threshold.
# install.packages("ggparliament")
library(ggparliament)
# install.packages("tidyverse")
library(tidyverse)

ru_semicircle <- parliament_data(election_data = ru,
                                 type = "semicircle",
                                 parl_rows = 10,
                                 party_seats = ru$seats)

ggplot(ru_semicircle, aes(x = x, y = y, colour = party_short)) +
  geom_parliament_seats() +
  geom_highlight_government(government == 1) +
  draw_majoritythreshold(n = 225, label = TRUE, type = "semicircle") +
  theme_ggparliament() +
  labs(title = "Russia, 2016") +
  scale_colour_manual(values = ru_semicircle$colour,
limits = ru_semicircle$party_short) 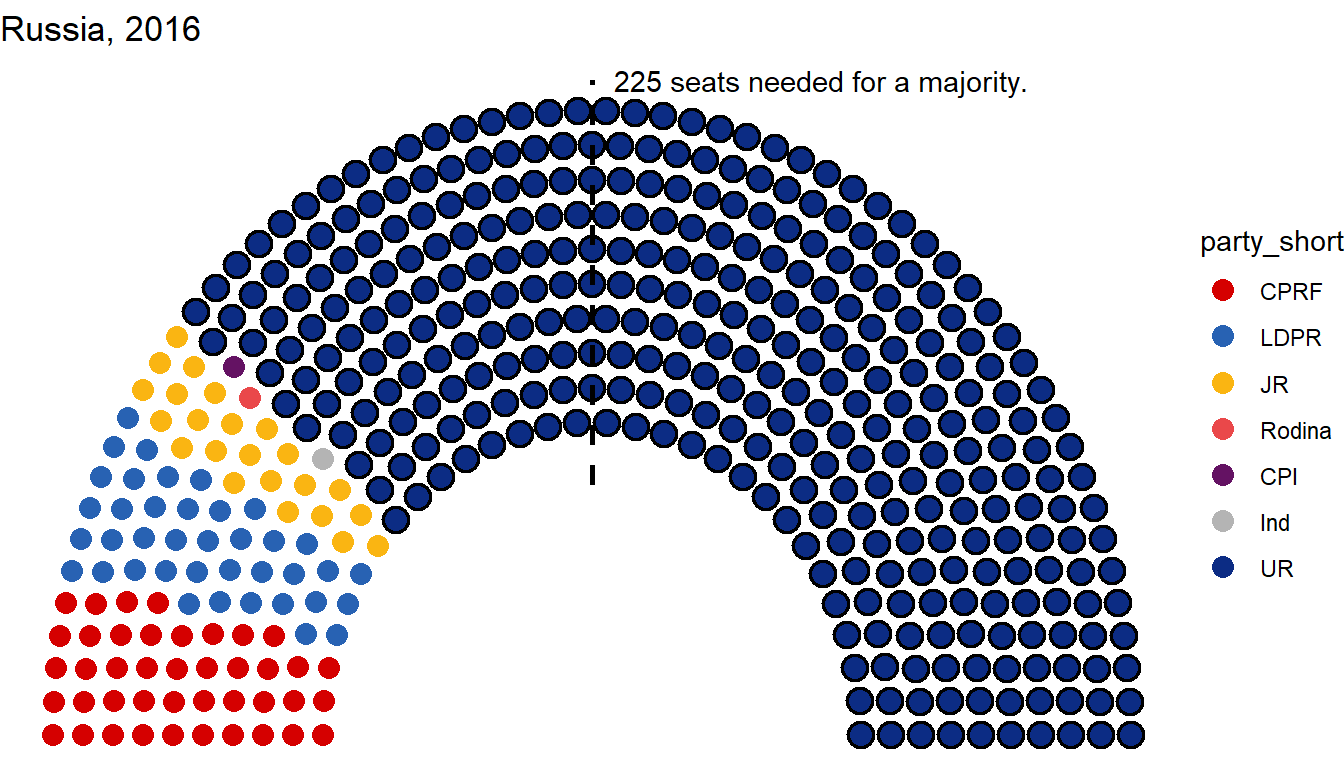
Parliament bar
You can also add a parliament bar showing the proportion of seats by party in the parliament using the geom_parliament_bar function, as shown below.
# install.packages("ggparliament")
library(ggparliament)
# install.packages("tidyverse")
library(tidyverse)

ru_semicircle <- parliament_data(election_data = ru,
                                 type = "semicircle",
                                 parl_rows = 10,
                                 party_seats = ru$seats)

ggplot(ru_semicircle, aes(x = x, y = y, colour = party_short)) +
  geom_parliament_seats() +
  geom_highlight_government(government == 1) +
  geom_parliament_bar(colour = colour, party = party_long, label = TRUE) +
  draw_majoritythreshold(n = 225, label = TRUE, type = "semicircle") +
  theme_ggparliament() +
  labs(title = "R") +
  scale_colour_manual(values = ru_semicircle$colour,
limits = ru_semicircle$party_short) 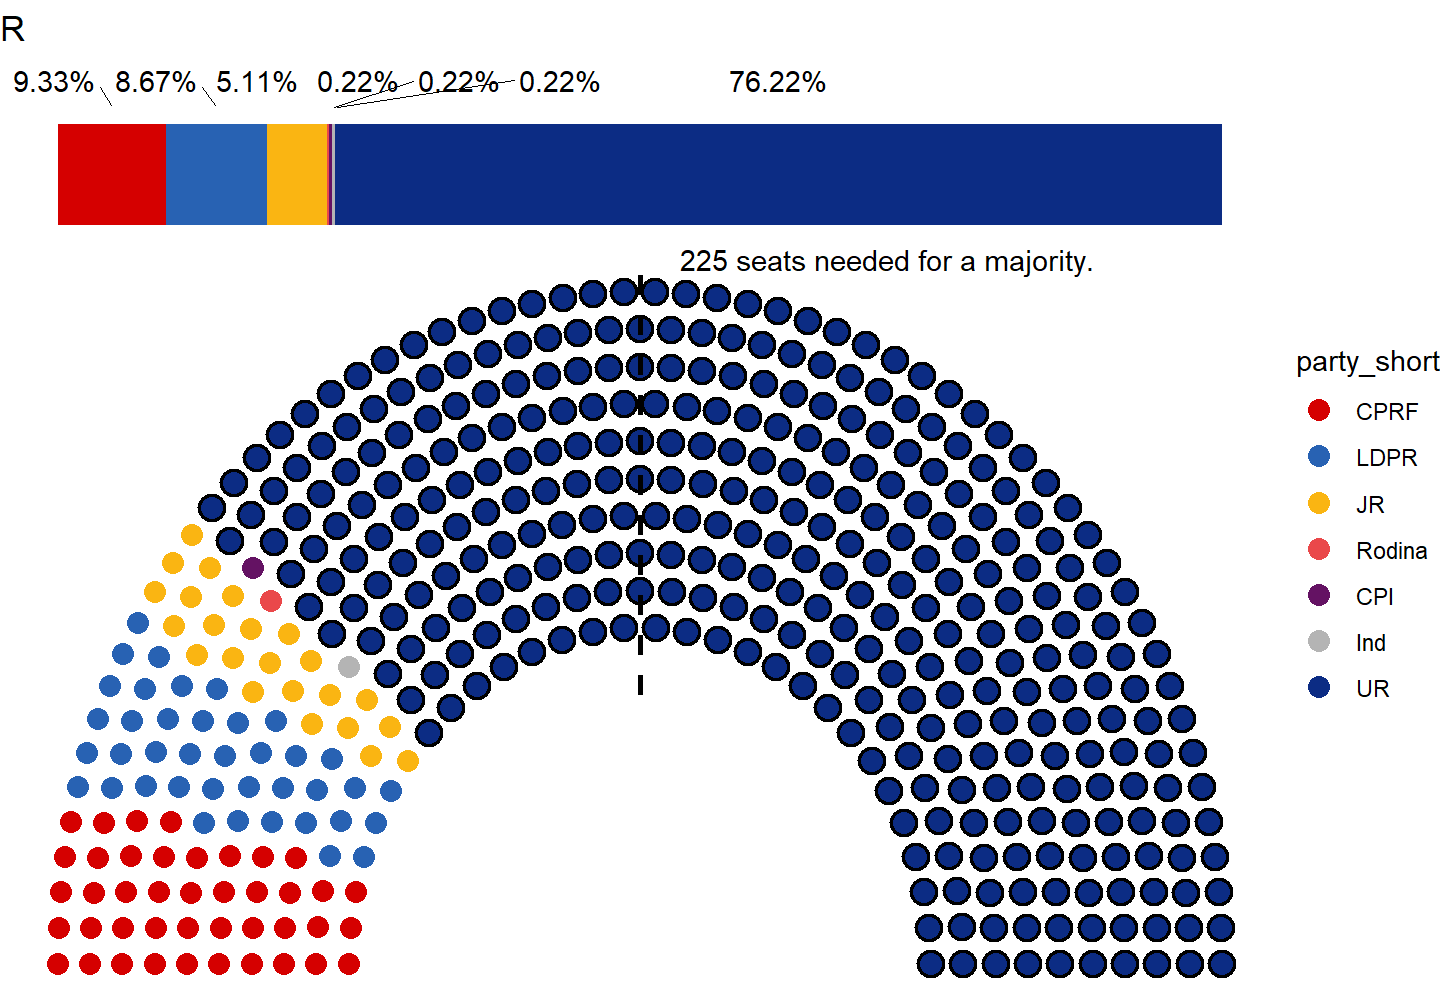
Labels
Finally, you can also add labels to the diagram with the draw_partylabels and draw_totalseats functions as shown in the following example.
# install.packages("ggparliament")
library(ggparliament)
# install.packages("tidyverse")
library(tidyverse)

ru_semicircle <- parliament_data(election_data = ru,
                                 type = "semicircle",
                                 parl_rows = 10,
                                 party_seats = ru$seats)

ggplot(ru_semicircle, aes(x = x, y = y, colour = party_short)) +
  geom_parliament_seats() +
  draw_partylabels(type = "semicircle",
                   party_names = party_long,
                   party_seats = seats,
                   party_colours = colour) +
  draw_totalseats(n = 450, type = "semicircle") +
  theme_ggparliament() +
  labs(title = "Russia, 2016") +
  scale_colour_manual(values = ru_semicircle$colour,
limits = ru_semicircle$party_short) 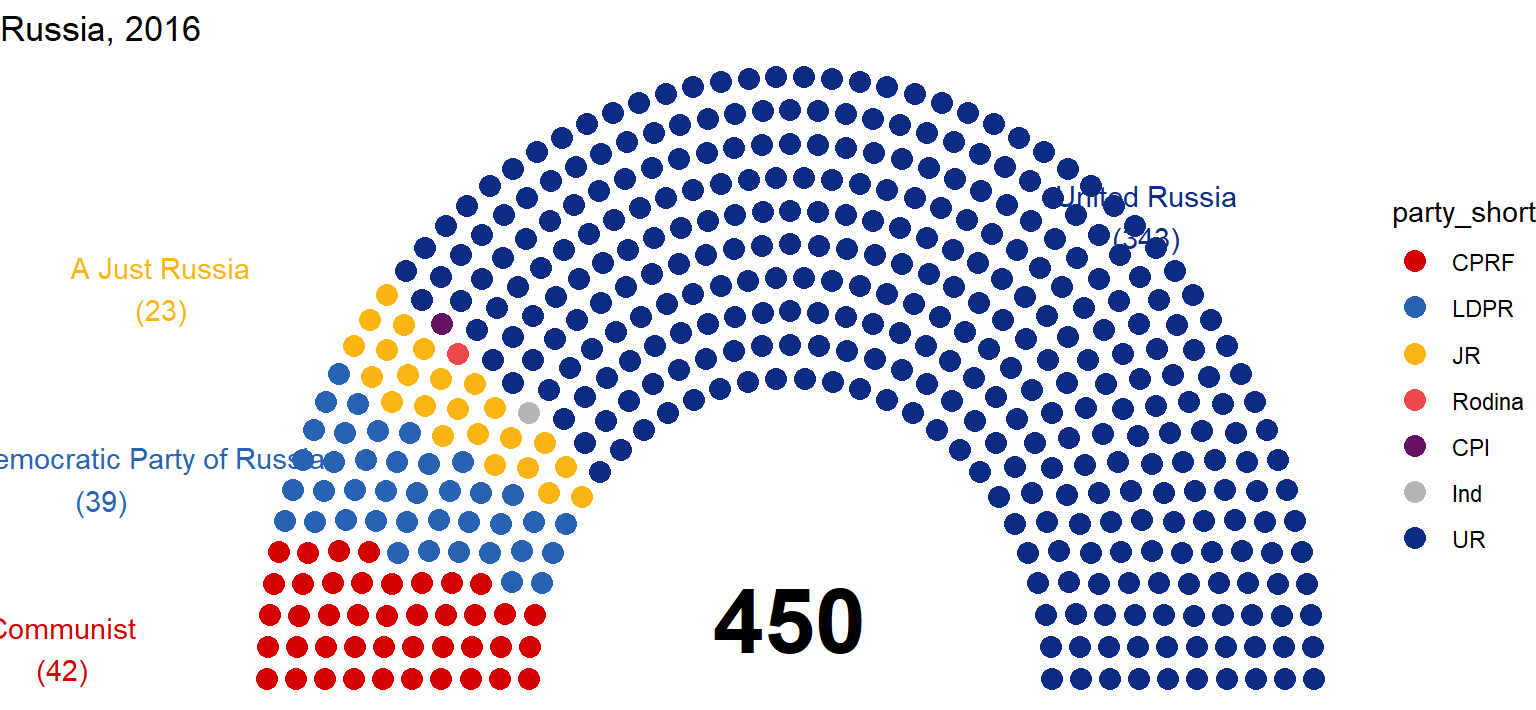

Master Statistics
Learn statistics from the basics to advanced techniques, clearly explained
Go to site