Voronoi diagram with deldir
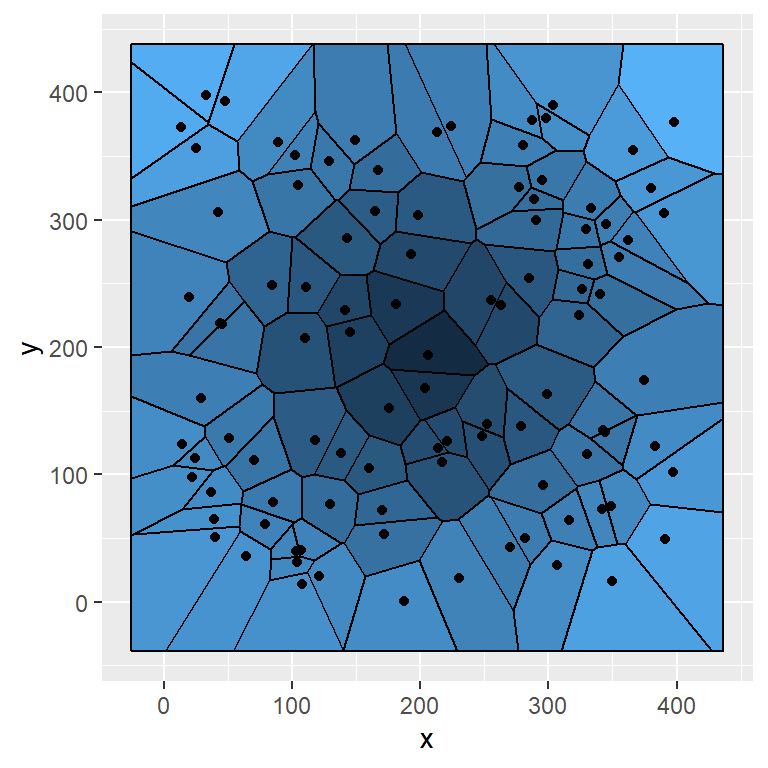
A Voronoi diagram (or Thiessen polygons) can be created in base R with the functions provided by deldir package. Given two vectors you will need to calculate the Delaunay triangulation with the deldir function and the Dirichlet (Voronoi) tessellation with the tile.list function. Then, you can plot the resulting object with the plot.tile.list S3 method.
# install.packages("deldir")
library(deldir)

# Data
set.seed(1)
x <- runif(50)
y <- runif(50)

# Calculate Voronoi Tesselation and tiles
tesselation <- deldir(x, y)
tiles <- tile.list(tesselation)

plot(tiles, pch = 19)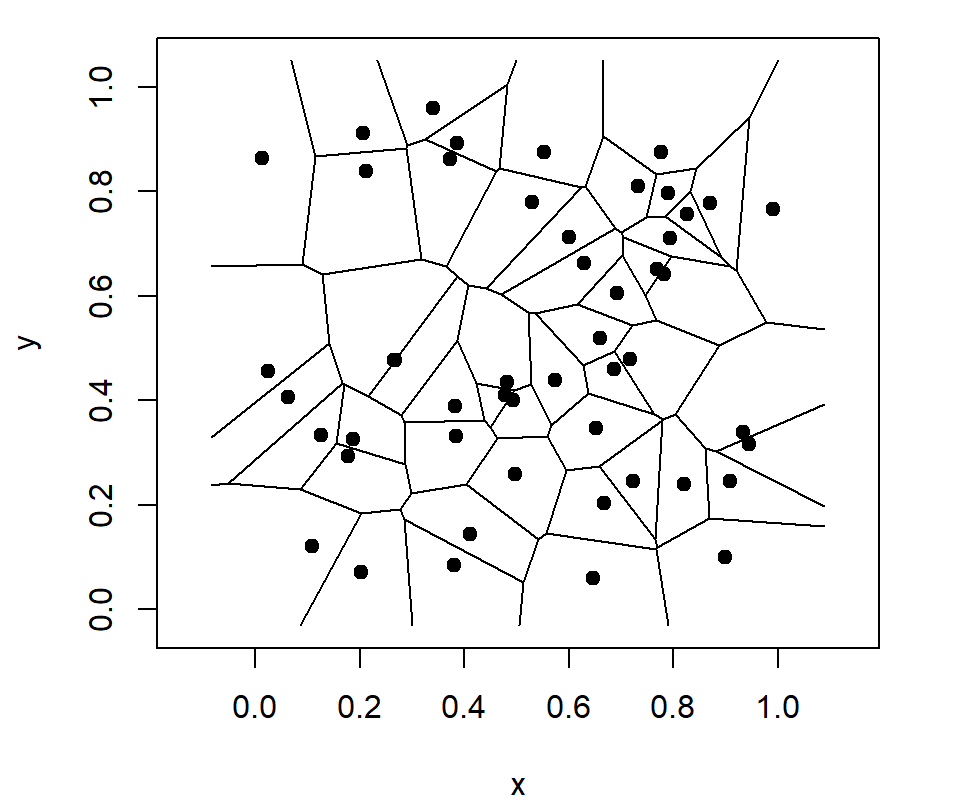
If you want you can add numbers instead of the default points, setting number = TRUE.
# install.packages("deldir")
library(deldir)

# Data
set.seed(1)
x <- runif(50)
y <- runif(50)

# Calculate Voronoi Tesselation and tiles
tesselation <- deldir(x, y)
tiles <- tile.list(tesselation)

plot(tiles, pch = 19,
     number = TRUE)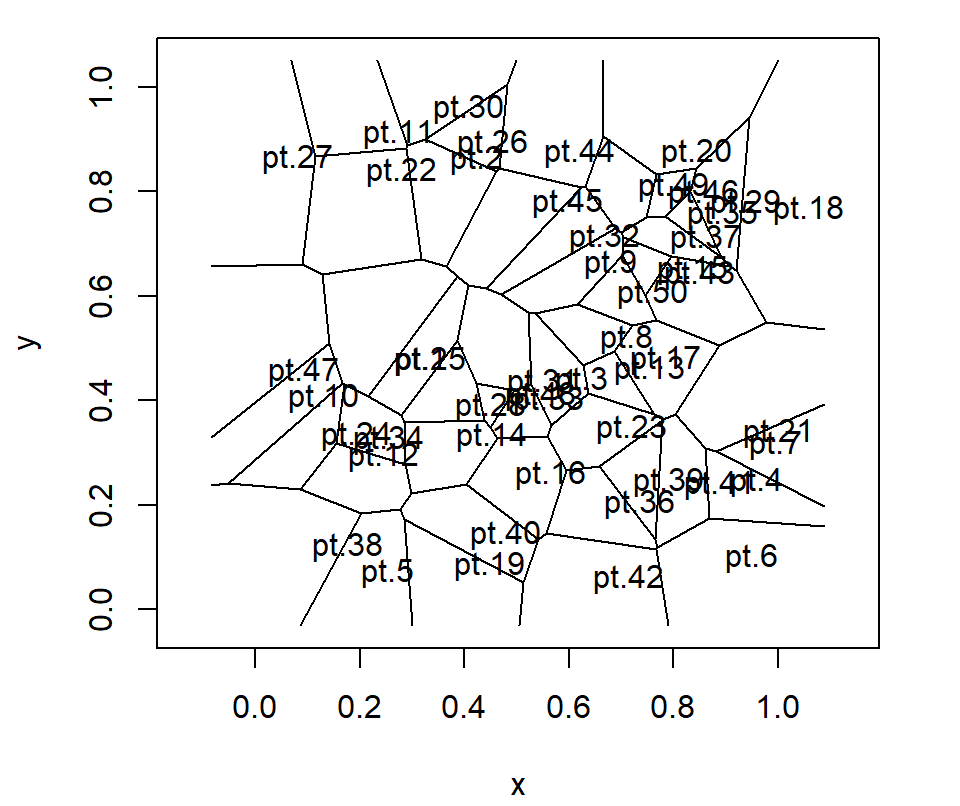
In addition, it is possible to remove the points setting the argument showpoints to FALSE.
# install.packages("deldir")
library(deldir)

# Data
set.seed(1)
x <- runif(50)
y <- runif(50)

# Calculate Voronoi Tesselation and tiles
tesselation <- deldir(x, y)
tiles <- tile.list(tesselation)

plot(tiles,
     showpoints = FALSE)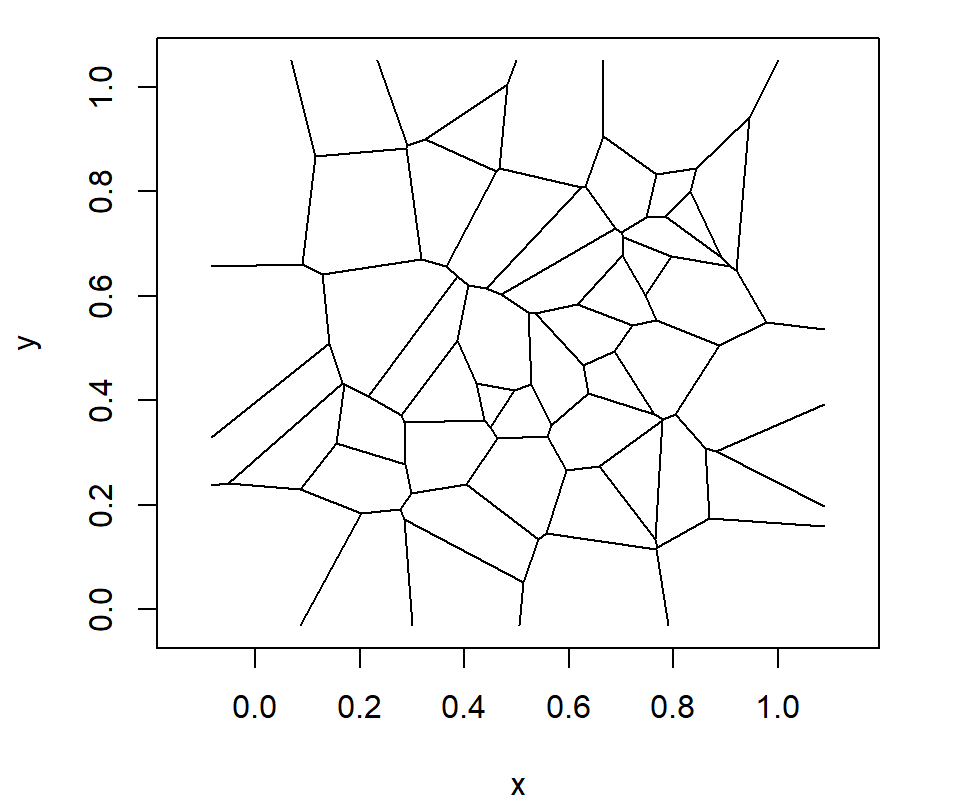
The edges of the tiles can be closed with a rectangle setting close = TRUE.
# install.packages("deldir")
library(deldir)

# Data
set.seed(1)
x <- runif(50)
y <- runif(50)

# Calculate Voronoi Tesselation and tiles
tesselation <- deldir(x, y)
tiles <- tile.list(tesselation)

plot(tiles,
     close = TRUE)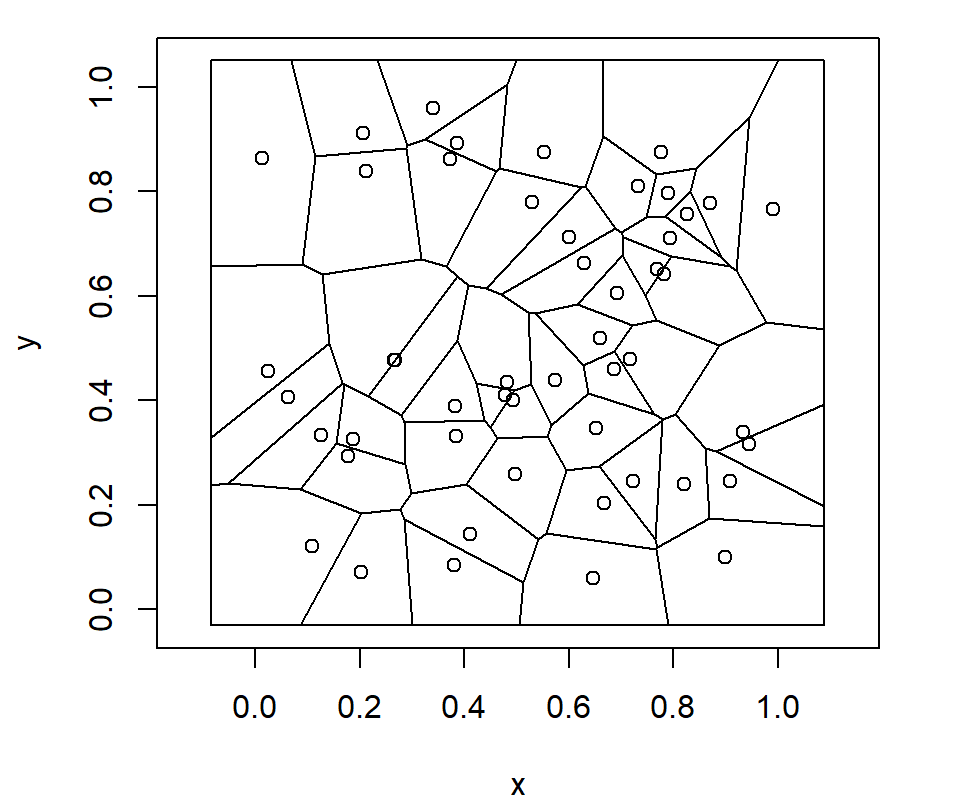
Fill and border colors
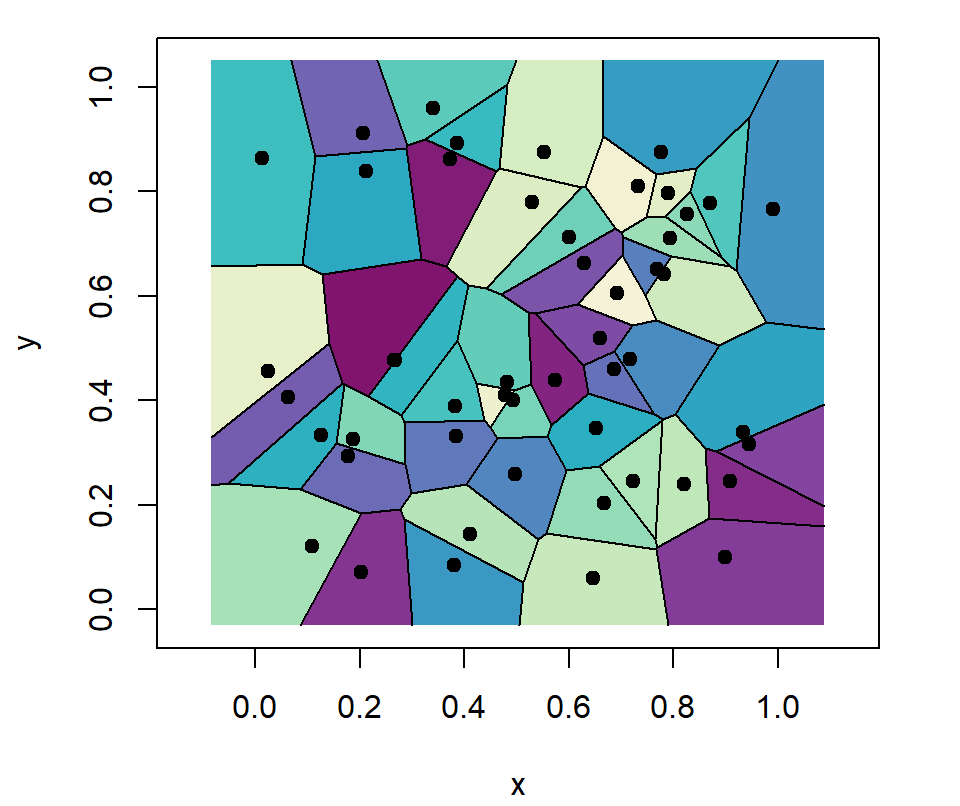
You can pass a color palette to the fillcol argument of the plotting function to add colors to the tiles. Note that you can also change the color or the points with col.pts or the color of the numbers with col.num. The latter in case number = TRUE.
# install.packages("deldir")
library(deldir)
# Data
set.seed(1)
x <- runif(50)
y <- runif(50)
# Calculate Voronoi Tesselation and tiles
tesselation <- deldir(x, y)
tiles <- tile.list(tesselation)
plot(tiles, pch = 19,
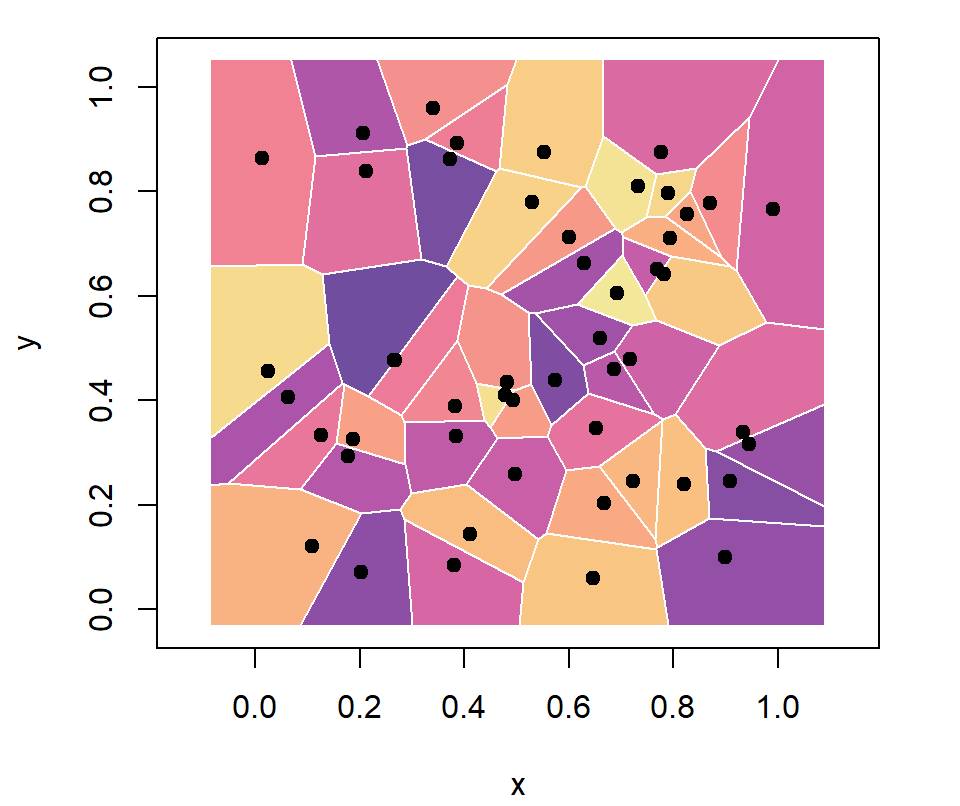
fillcol = hcl.colors(50, "Purple-Yellow"))The border argument allows changing the color of the border of the tiles, as shown in the example below.
# install.packages("deldir")
library(deldir)

# Data
set.seed(1)
x <- runif(50)
y <- runif(50)

# Calculate Voronoi Tesselation and tiles
tesselation <- deldir(x, y)
tiles <- tile.list(tesselation)

plot(tiles, pch = 19,
     border = "white",
     fillcol = hcl.colors(50, "Sunset"))
Clip shape
The function also provides a clipping method with clipp. The argument needs a list with the components x and y giving the coordinates of the polygon to which the tessellation should be clipped. In the following example we are clipping it to a circle.
# install.packages("deldir")
library(deldir)

# Data
set.seed(1)
x <- runif(50)
y <- runif(50)

# Calculate Voronoi Tesselation and tiles
tesselation <- deldir(x, y)
tiles <- tile.list(tesselation)

# Circle
s <- seq(0, 2 * pi, length.out = 3000)
circle <- list(x = 0.5 * (1 + cos(s)),
               y = 0.5 * (1 + sin(s)))

plot(tiles, pch = 19,
     col.pts = "white",
     border = "white",
     fillcol = hcl.colors(50, "viridis"),
     clipp = circle)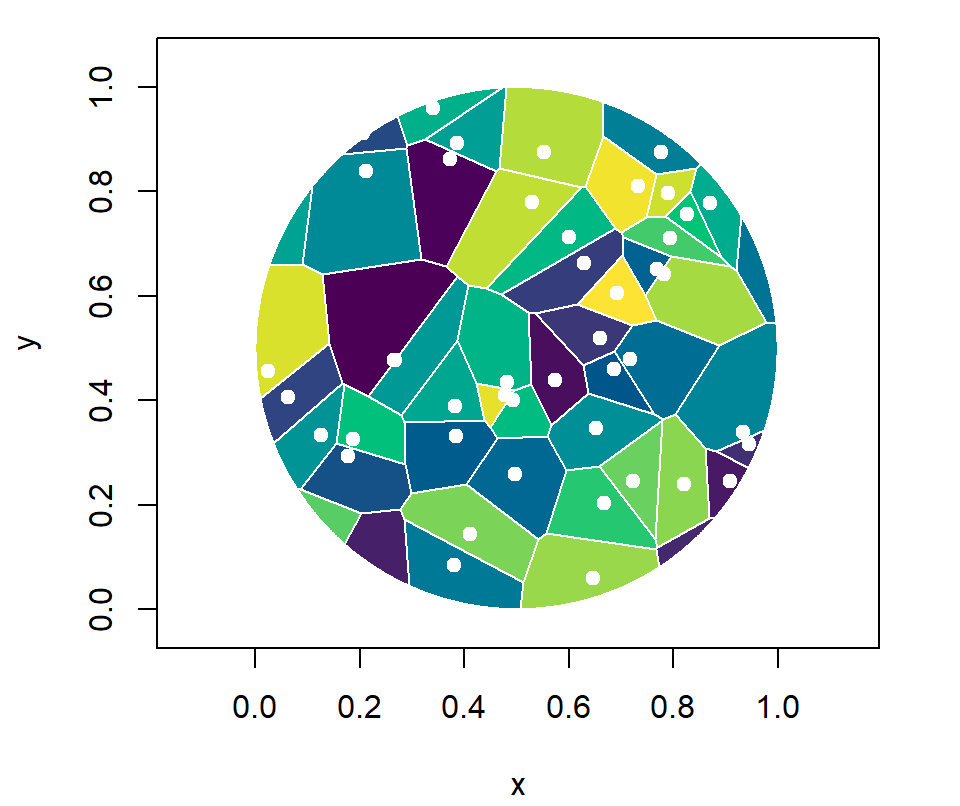

Master Statistics
Learn statistics from the basics to advanced techniques, clearly explained
Go to site