Circular fan (polar) dendrogram plot
The circlize_dendrogram function can be used to create a circular dendrogram, also known as circular, radial or fan tree plot. You need to pass an object of class dendrogram. Note that labels_track_height and dend_track_height arguments are used to fit the labels properly and that both circlize and dendextend need to be installed to run the function.
# install.packages("dendextend")
# install.packages("circlize")
library(dendextend)
library(circlize)

# Distance matrix
d <- dist(USArrests)

# Hierarchical clustering dendrogram
hc <- as.dendrogram(hclust(d))

# Circular dendrogram
circlize_dendrogram(hc,
                    labels_track_height = NA,
                    dend_track_height = 0.5)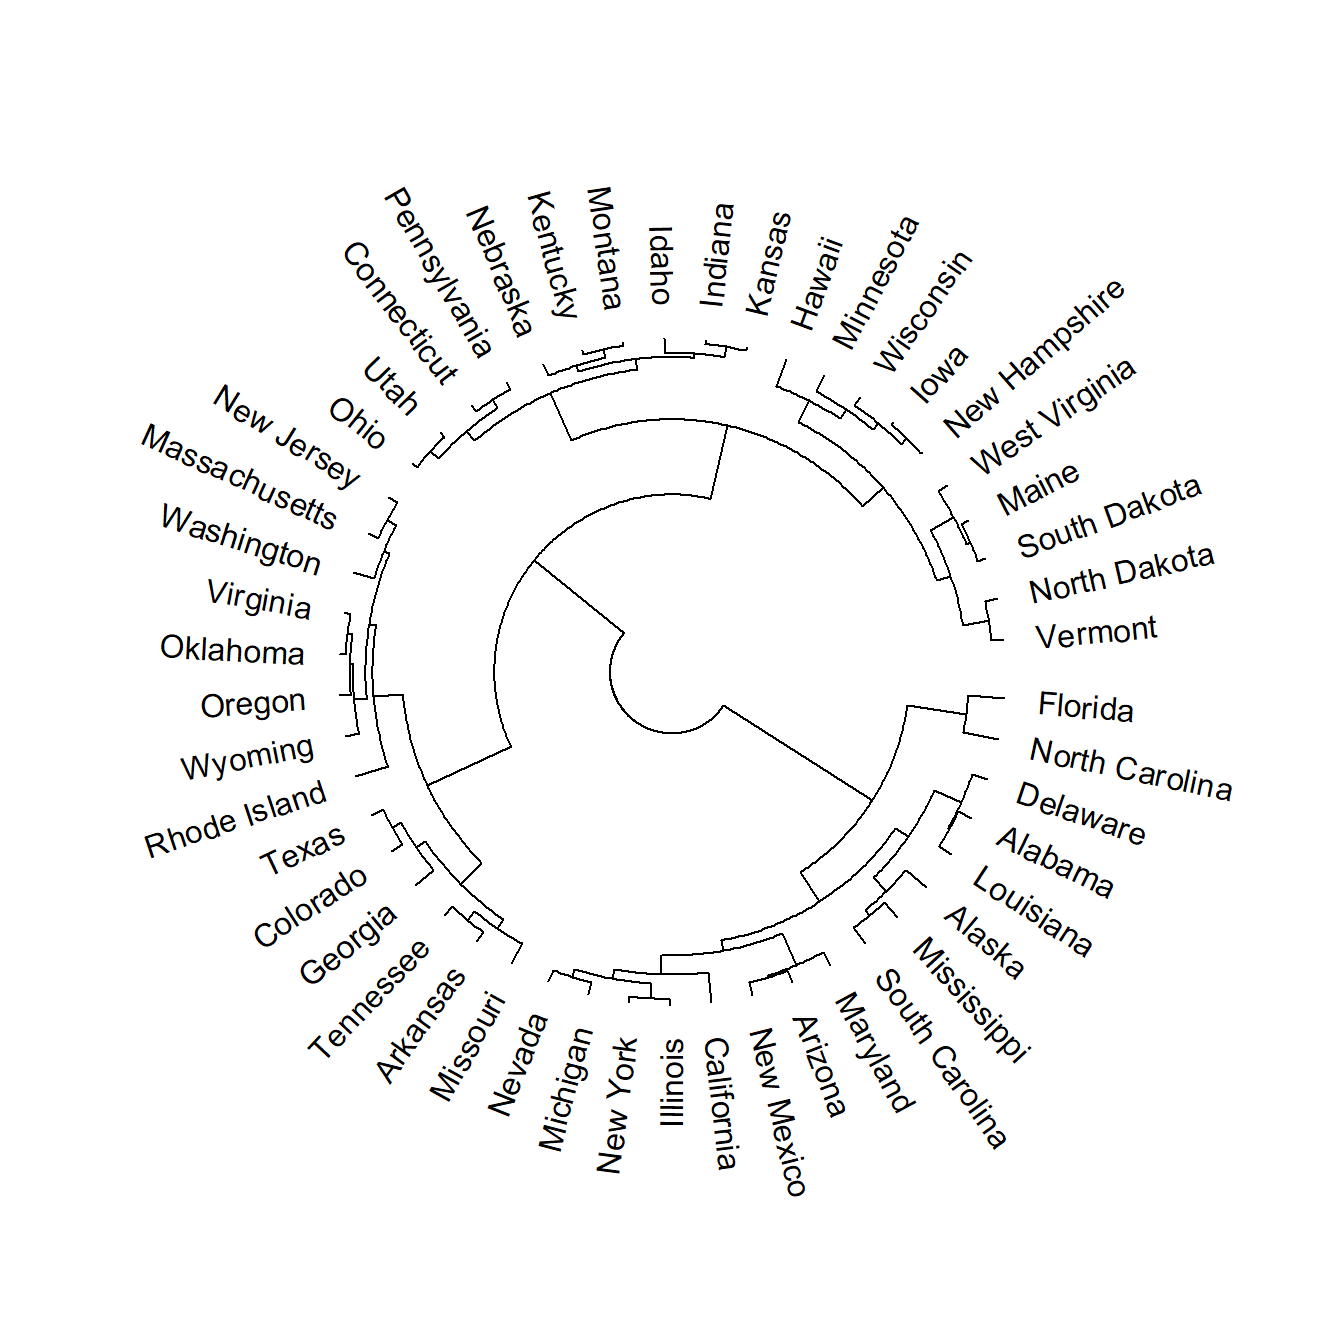
The default dendrogram faces outside, but you can change this setting facing = "inside".
# install.packages("dendextend")
# install.packages("circlize")
library(dendextend)
library(circlize)

# Distance matrix
d <- dist(USArrests)

# Hierarchical clustering dendrogram
hc <- as.dendrogram(hclust(d))

# Circular dendrogram facing inside
circlize_dendrogram(hc,
                    labels_track_height = NA,
                    dend_track_height = 0.5,
                    facing = "inside")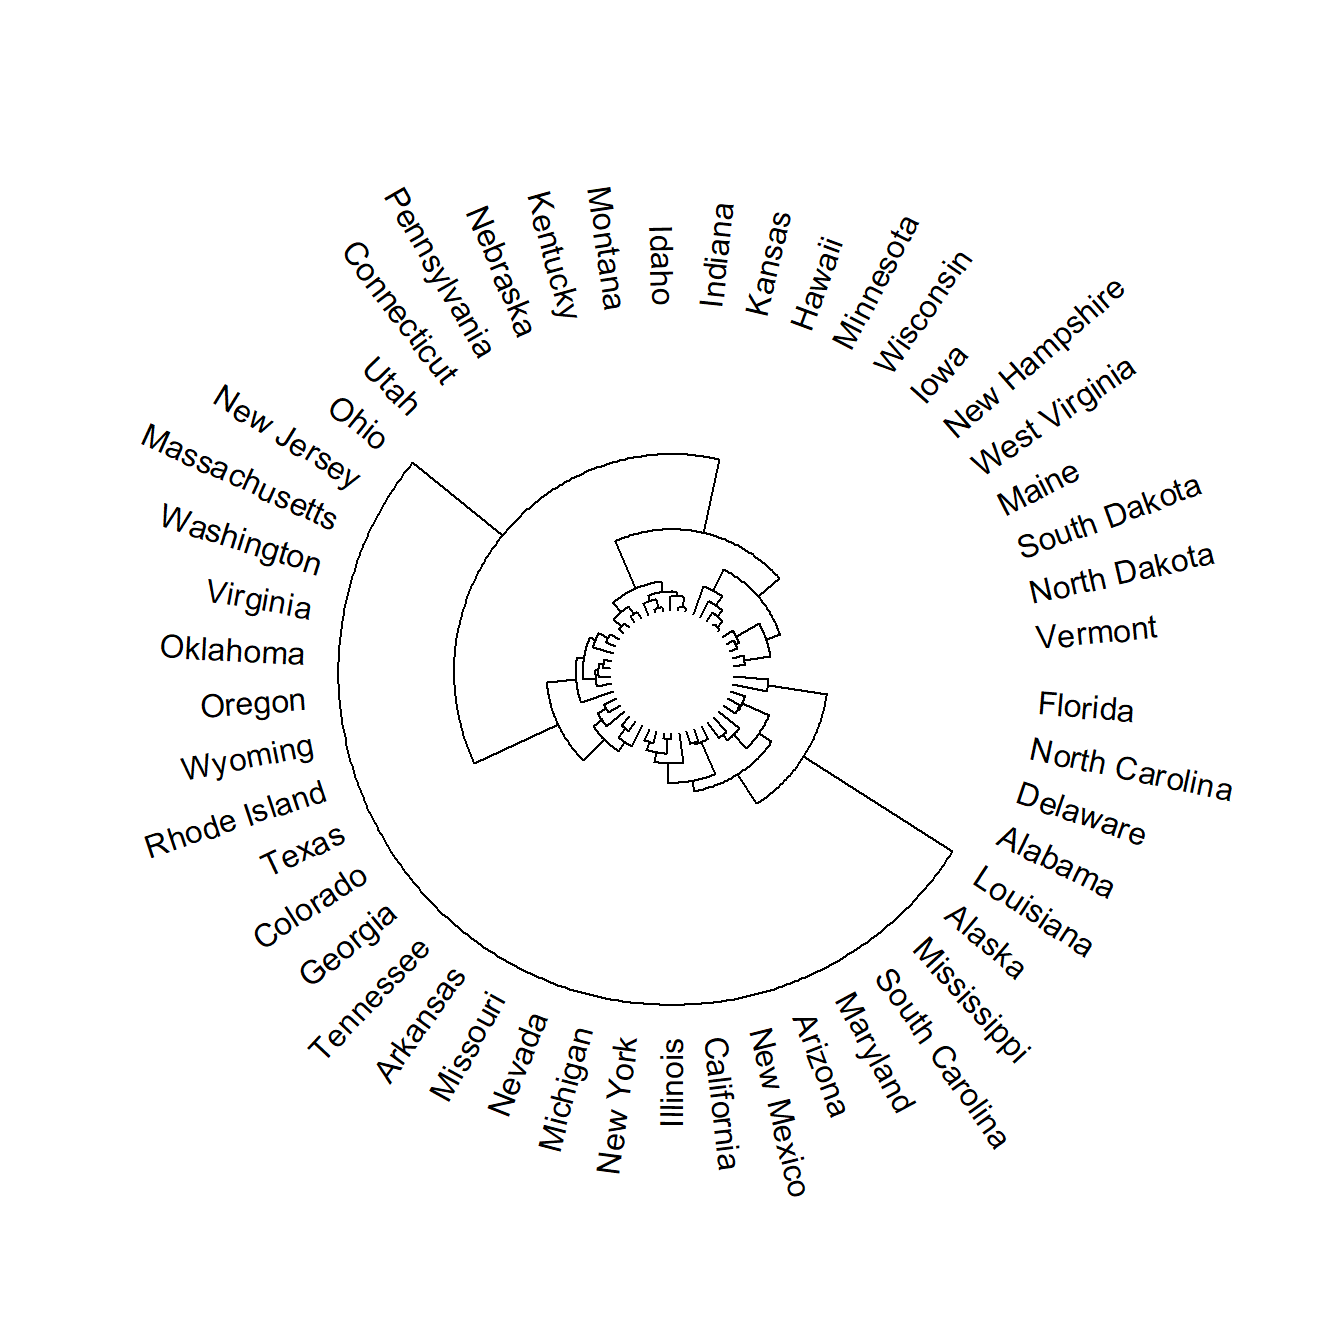
The labels of the dendrogram can be removed if you only want to display the branches setting labels = FALSE. In this scenario is recommended to increase the dend_track_height argument value.
# install.packages("dendextend")
# install.packages("circlize")
library(dendextend)
library(circlize)

# Distance matrix
d <- dist(USArrests)

# Hierarchical clustering dendrogram
hc <- as.dendrogram(hclust(d))

# Circular dendrogram without labels
circlize_dendrogram(hc,
                    dend_track_height = 0.8,
                    labels = FALSE)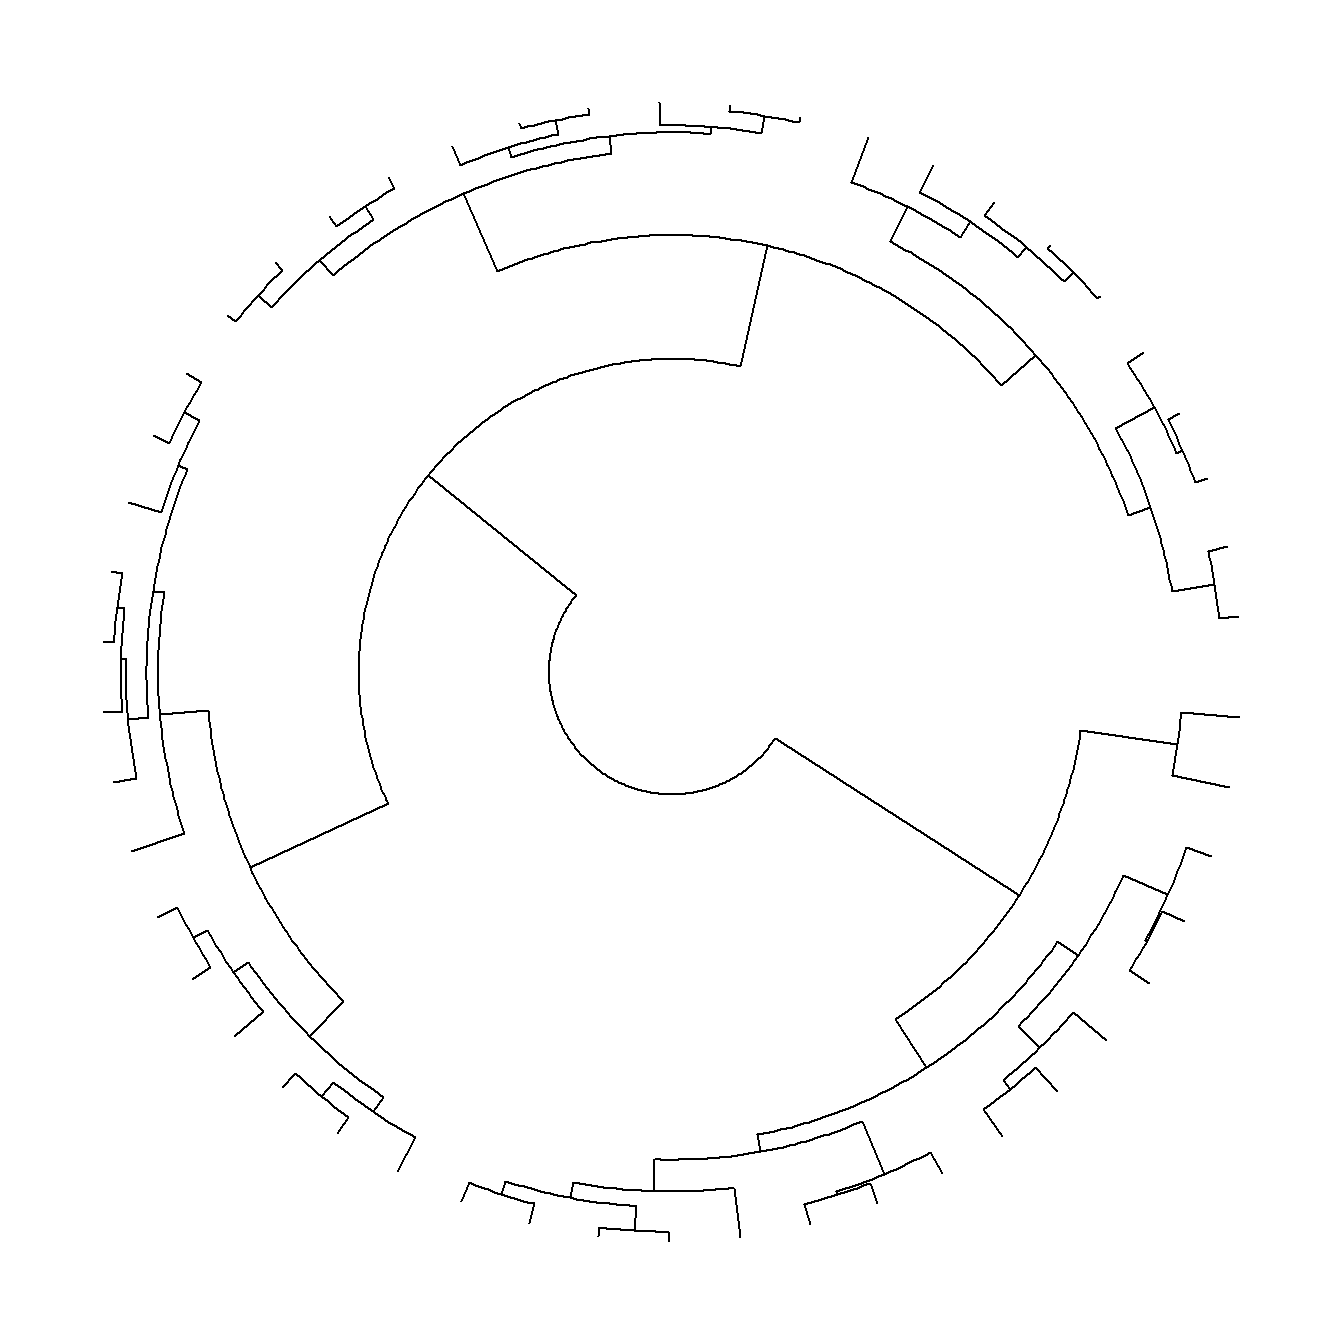
Further customization
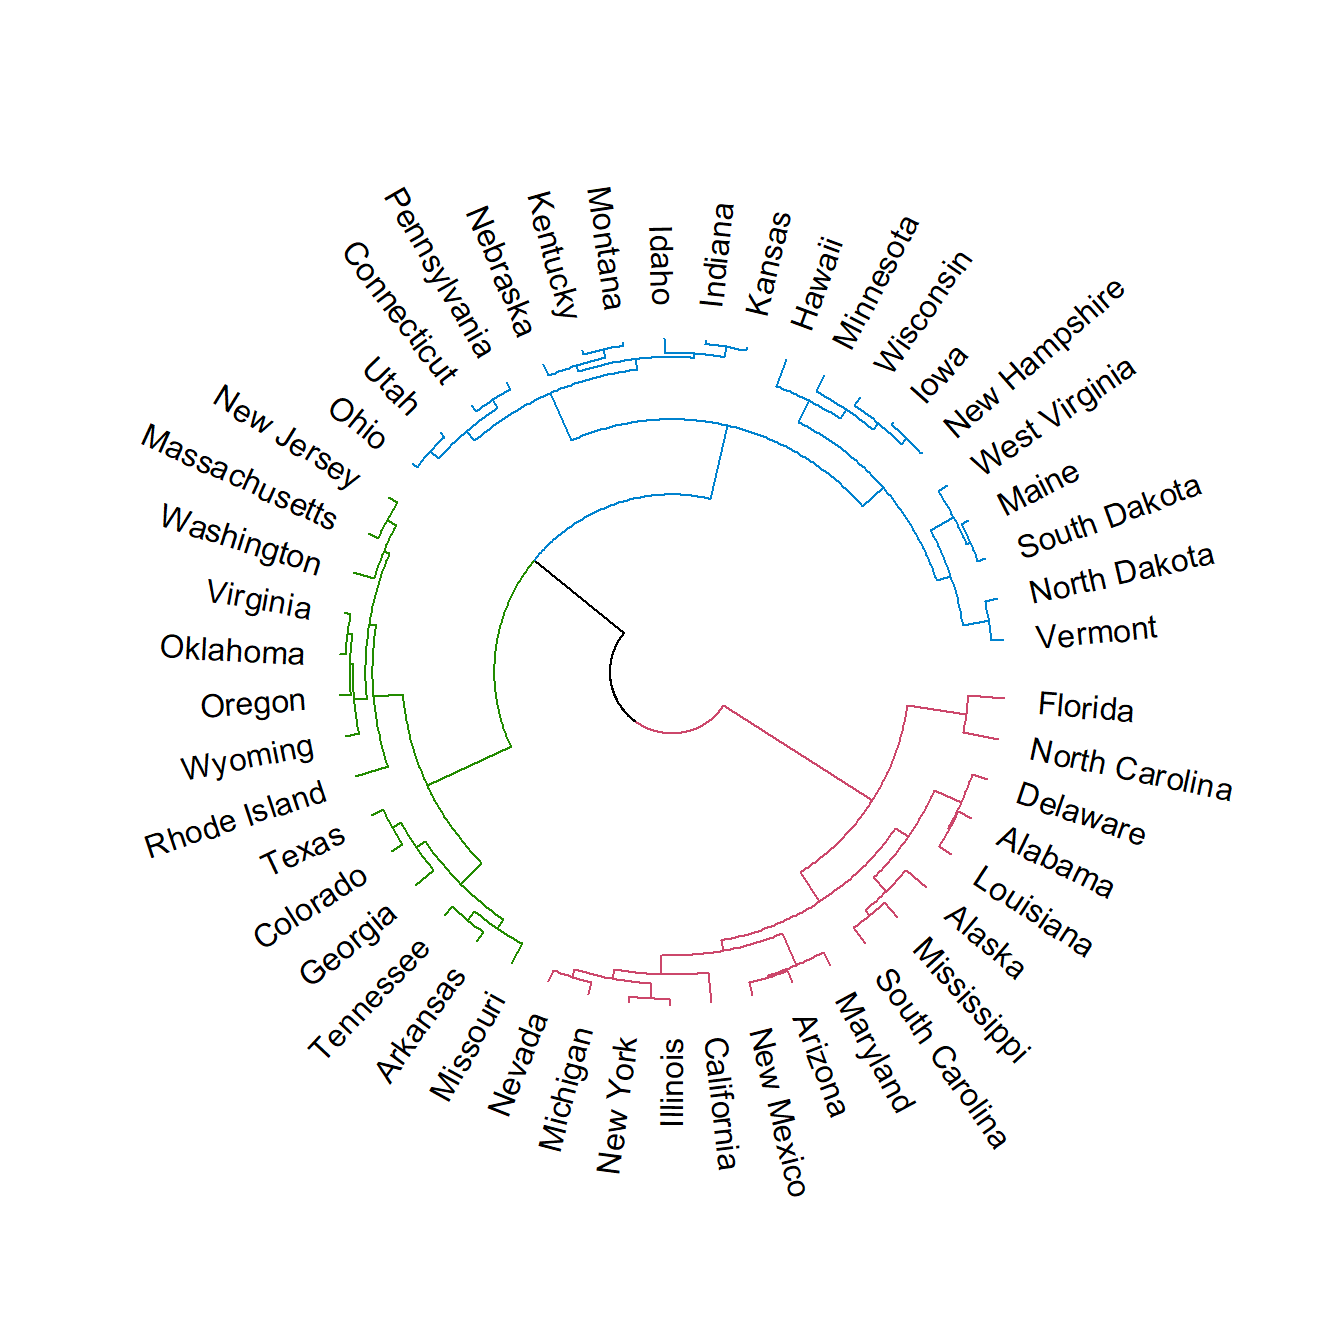
The styling of the polar tree plot can be customized transforming the dendrogram object. If you want to colorize the branches you can use the color_branches function, based on a number of clusters (k) or a height (h). Note that the function contains an argument named col that allows customizing the colors.
# install.packages("dendextend")
# install.packages("circlize")
library(dendextend)
library(circlize)
# Distance matrix
d <- dist(USArrests)
# Hierarchical clustering dendrogram
hc <- as.dendrogram(hclust(d))
# Colors
hc <- hc %>%
color_branches(k = 3)
# hc <- color_branches(hc, k = 4)
# Radial plot
circlize_dendrogram(hc,
labels_track_height = NA,
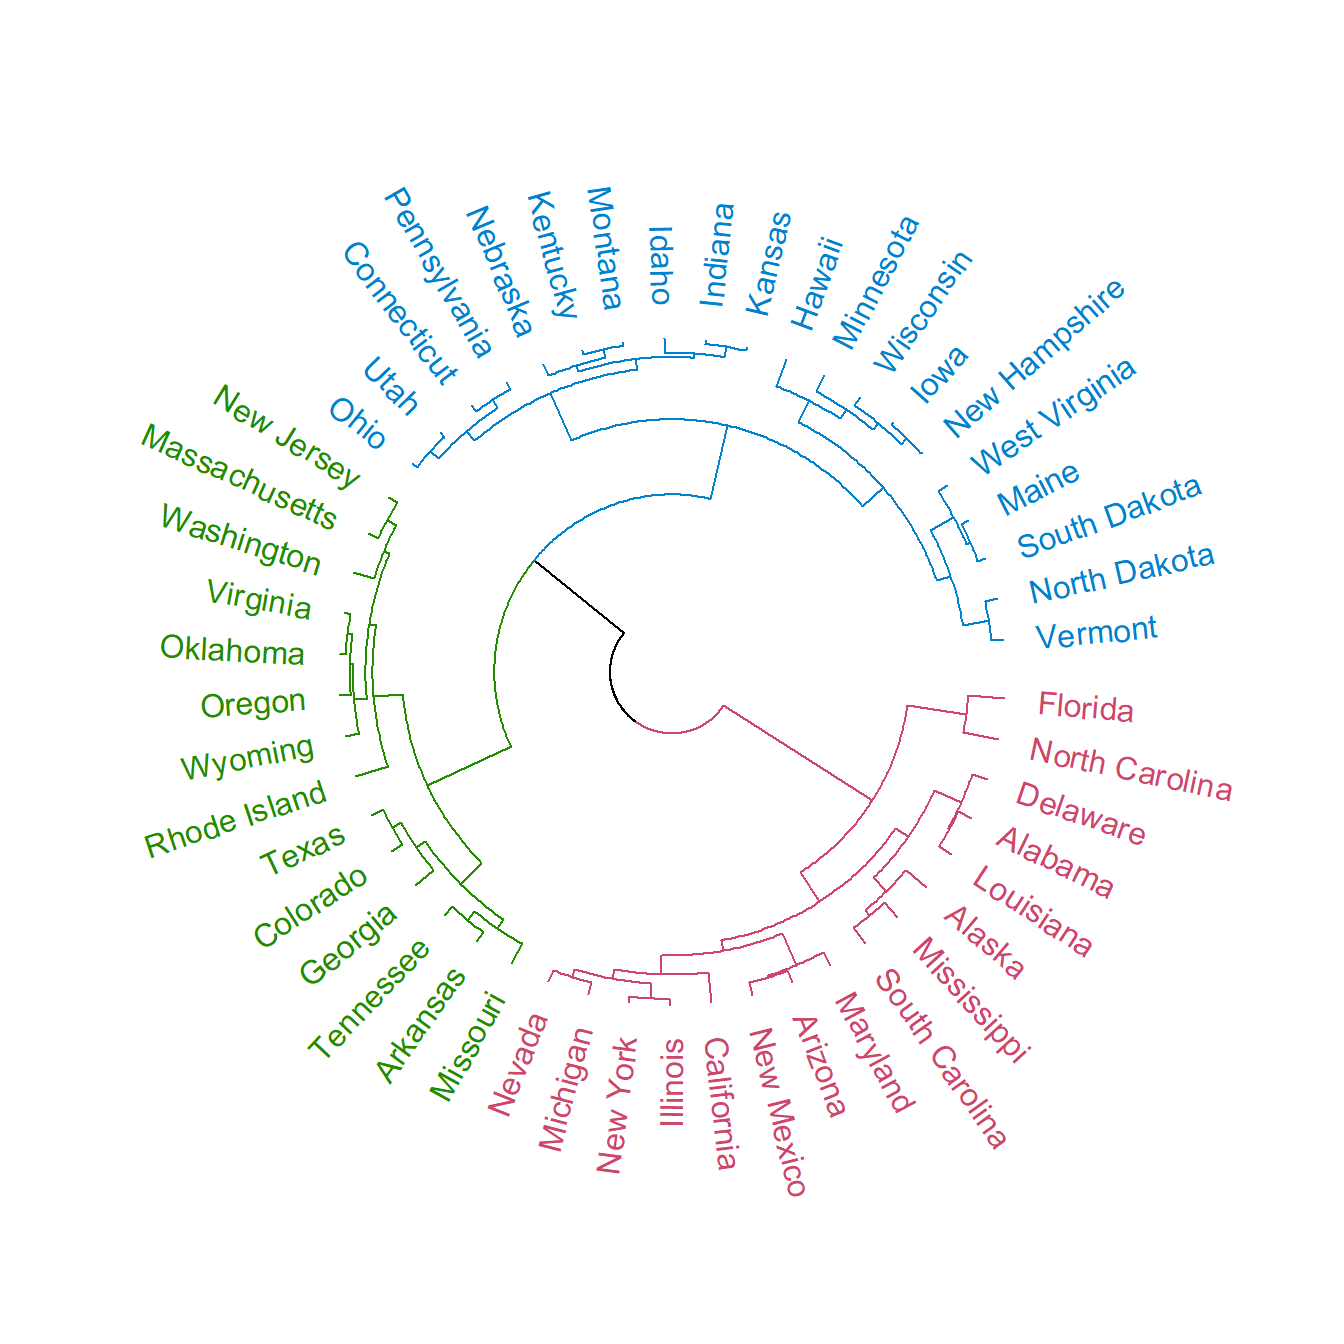
dend_track_height = 0.5) The labels can also be customized the same way as the branches. For that purpose use the color_labels function and specify the number of clusters or the height.
# install.packages("dendextend")
# install.packages("circlize")
library(dendextend)
library(circlize)
# Distance matrix
d <- dist(USArrests)
# Hierarchical clustering dendrogram
hc <- as.dendrogram(hclust(d))
# Colors
hc <- hc %>%
color_branches(k = 3) %>%
color_labels(k = 3)
# Fan tree plot with colored labels
circlize_dendrogram(hc,
labels_track_height = NA,
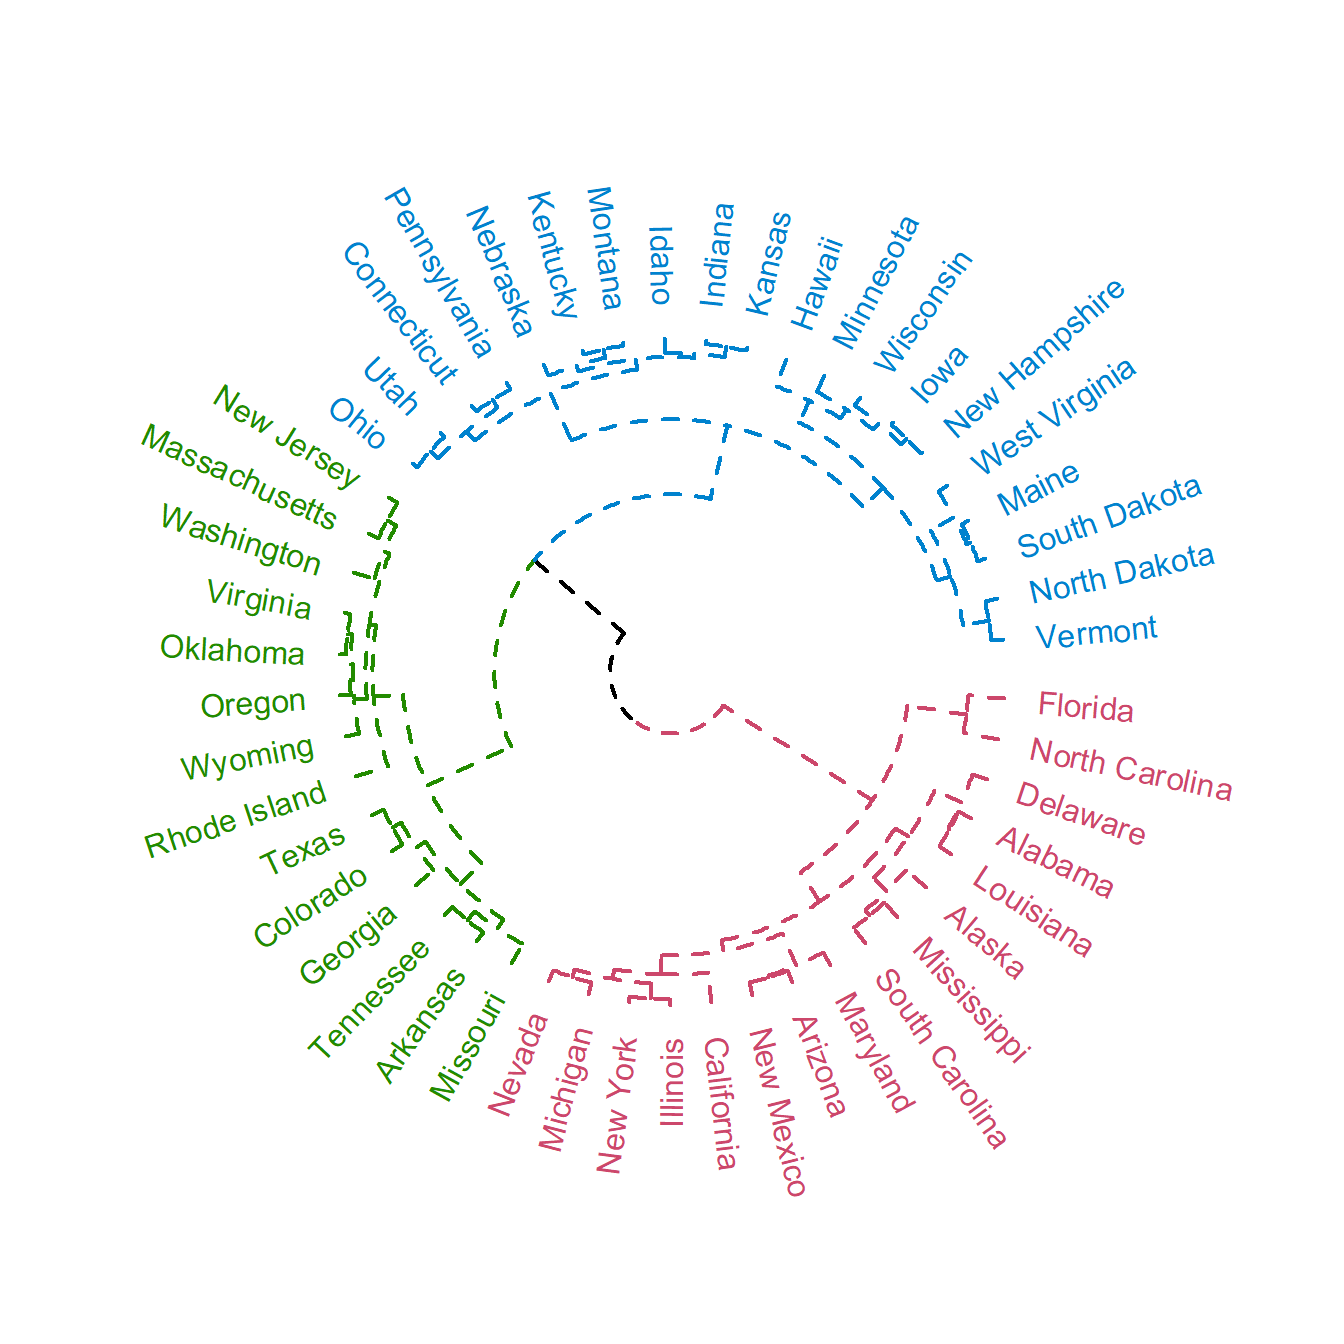
dend_track_height = 0.5) Finally, it is worth to mention that the style and width of the lines can be changed as in the example below.
# install.packages("dendextend")
# install.packages("circlize")
library(dendextend)
library(circlize)

# Distance matrix
d <- dist(USArrests)

# Hierarchical clustering dendrogram
hc <- as.dendrogram(hclust(d))

# Colors and line customization
hc <- hc %>%
  color_branches(k = 3) %>%
  set("branches_lwd", 2) %>%  # Line width
  set("branches_lty", 2) %>%  # Line type
  color_labels(k = 3)

# Line styling of the dendrogram
circlize_dendrogram(hc,
                    labels_track_height = NA,
dend_track_height = 0.5) 
Master Statistics
Learn statistics from the basics to advanced techniques, clearly explained
Go to site