Most basic waffle chart
The waffle package function contains a function of the same name that can be used to create waffle charts, also known as square pie charts or gridplots, based on ggplot2.
To create a basic waffle plot pass a vector containing the count for each group to the function. The number of rows of the plot can be selected with rows (defaults to 10). Choose a value according to your data.
# install.packages("waffle", repos = "https://cinc.rud.is")
library(waffle)

# Vector
x <- c(30, 25, 20, 5)

# Waffle chart
waffle(x, rows = 8)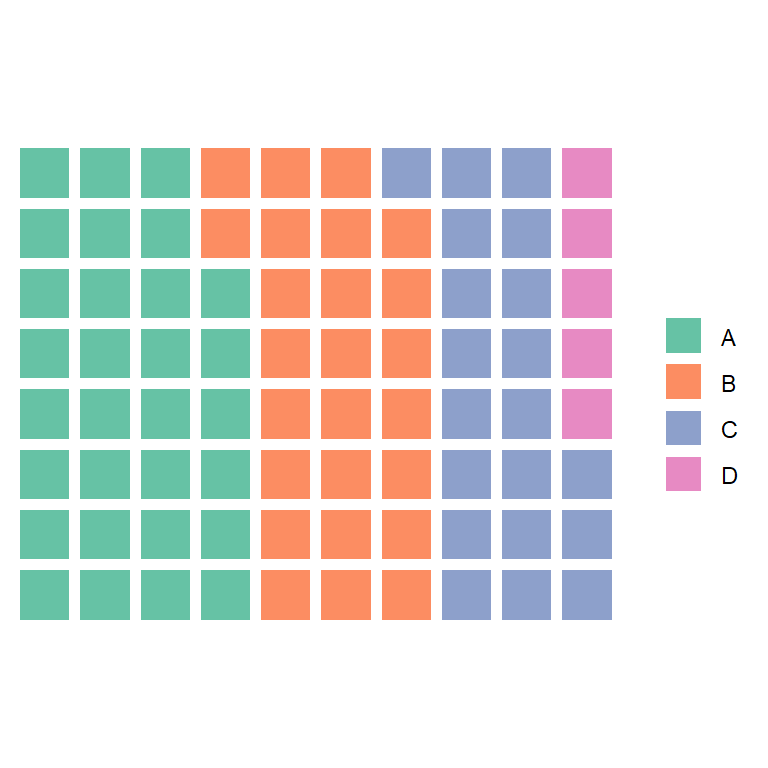
Use a named vector to change the legend names
If you name the variables, the legend will display their names.
# install.packages("waffle", repos = "https://cinc.rud.is")
library(waffle)

# Vector
x <- c(G1 = 30, G2 = 25, G3 = 20, G4 = 5)

# Waffle chart
waffle(x, rows = 8)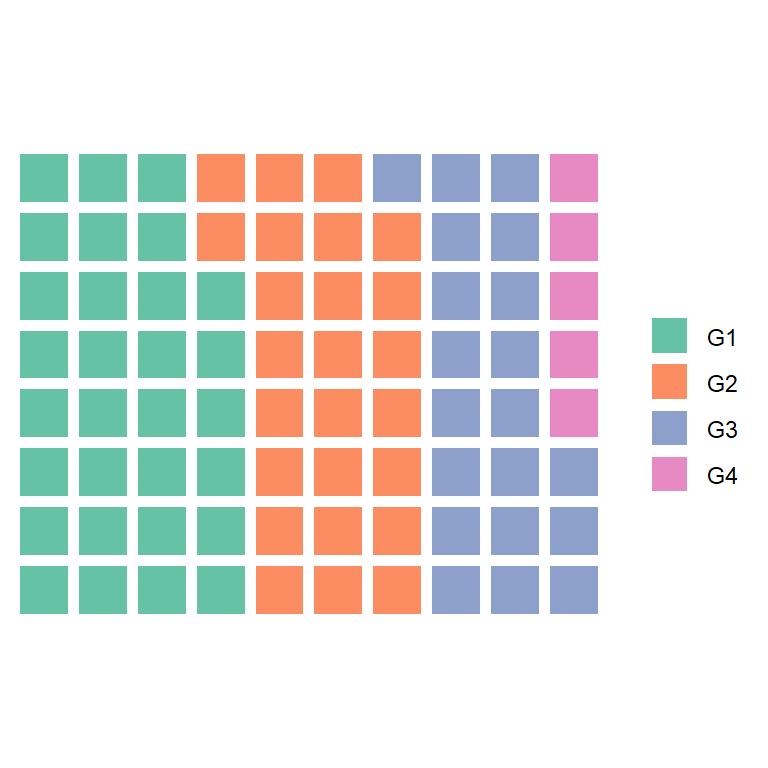
Color customization
You can pass a vector of colors to the colors argument. Pass as many colors as the number of components in the input vector.
# install.packages("waffle", repos = "https://cinc.rud.is")
library(waffle)

# Vector
x <- c(G1 = 30, G2 = 25, G3 = 20, G4 = 5)

# Waffle chart
waffle(x, rows = 8,
       colors = c("#FFEDA0", "#FEB24C", "#FC4E2A", "#BD0026"))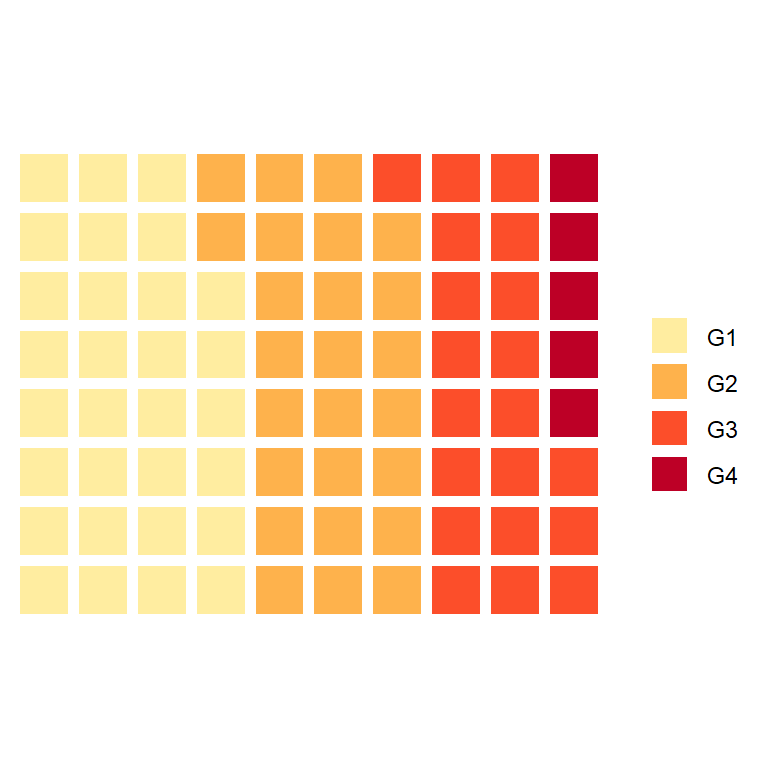
Legend position
The legend position can be changed with legend_pos argument. Possible values are "right" (default), "bottom", "left", "top" and "none" to remove the legend.
# install.packages("waffle", repos = "https://cinc.rud.is")
library(waffle)

# Vector
x <- c(G1 = 30,  G2 = 25, G3 = 20, G4 = 5)

# Waffle chart
waffle(x, rows = 8,
       legend_pos = "bottom")
In case you want to increase the margin of the plot respect to the legend pass a numeric value to pad argument (defaults to 0).
Combining square pie charts
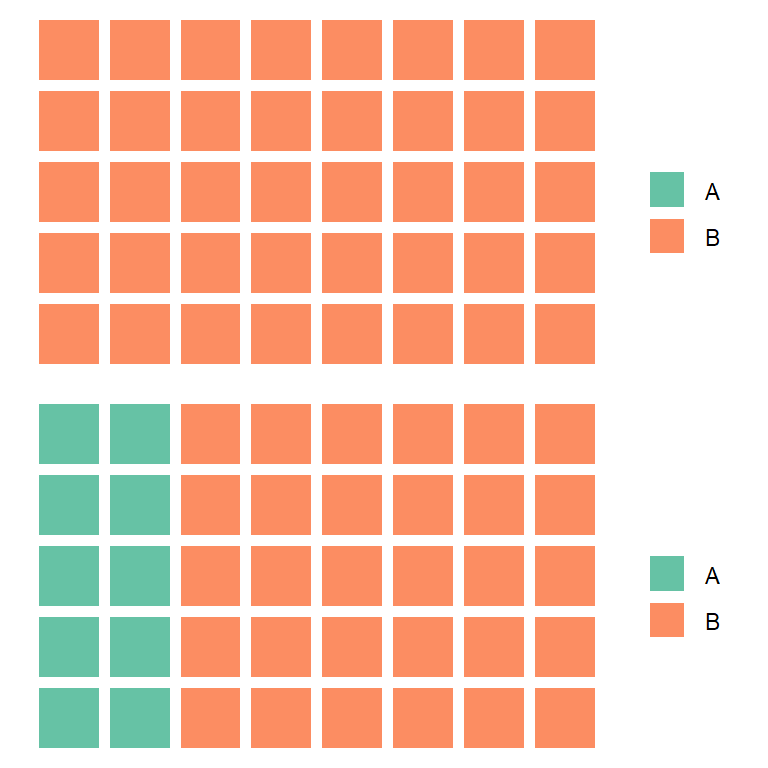
The package also provides a function named iron, which can be used to combine different waffle charts, like in the example below.
# install.packages("waffle", repos = "https://cinc.rud.is")
library(waffle)

w1 <- waffle(c(A = 0, B = 40), rows = 5)
w2 <- waffle(c(A = 10, B = 30), rows = 5)

# Combine the plots
iron(w1, w2)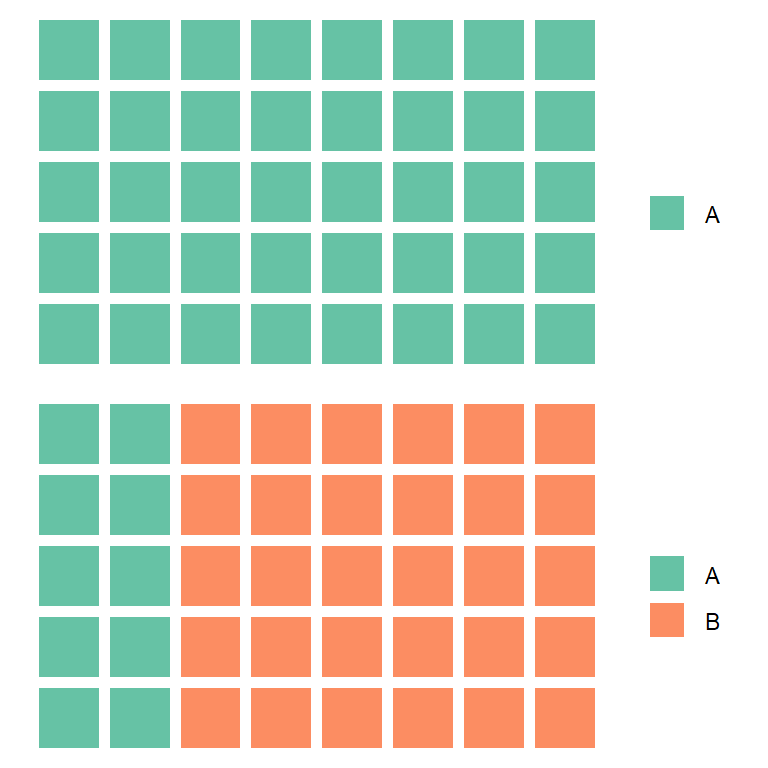
Note that you can get rid of unused categories across plots setting keep = FALSE.
# install.packages("waffle", repos = "https://cinc.rud.is")
library(waffle)

w1 <- waffle(c(A = 0, B = 40), rows = 5, keep = FALSE)
w2 <- waffle(c(A = 10, B = 30), rows = 5, keep = FALSE)

# Combine the plots, removing the unused legend labels
iron(w1, w2)
Using geom_waffle
If you prefer using a geom instead of a ggplot2 wrapper the package provides geom_waffle, which can be used as in the example below. Note that scale_fill_manual can be used to override the colors and to customize the legend.
# install.packages("waffle", repos = "https://cinc.rud.is")
library(waffle)

# Data
df <- data.frame(group = LETTERS[1:3],
                 value = c(25, 20, 35))

# Waffle plot
ggplot(df, aes(fill = group, values = value)) +
  geom_waffle(n_rows = 8, size = 0.33, colour = "white") +
  scale_fill_manual(name = NULL,
                    values = c("#BA182A", "#FF8288", "#FFDBDD"),
                    labels = c("A", "B", "C")) +
  coord_equal() +
  theme_void()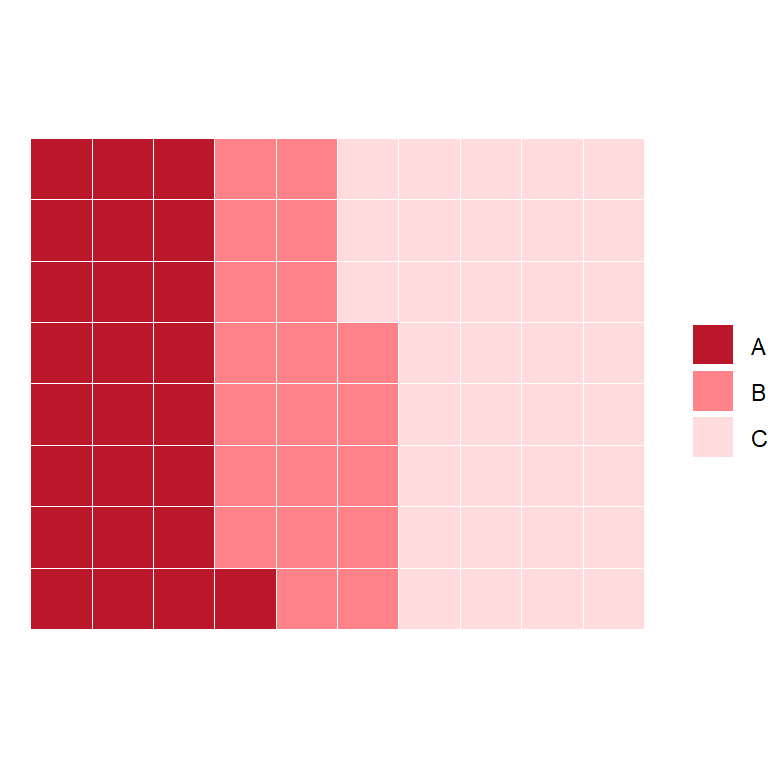

Master Statistics
Learn statistics from the basics to advanced techniques, clearly explained
Go to site