Pie chart with categorical data with pie
In order to create a pie chart in base R from a categorical variable you just need to create a table with your data with the table function and pass it to the pie function.
# Categorical data
cat_var <- factor(c(rep("Group 1", 10),
                    rep("Group 2", 15),
                    rep("Group 3", 30),
                    rep("Group 4", 20)))

# Create a table from the data
cat <- table(cat_var)

# Pie
pie(cat,
    col = hcl.colors(length(cat), "BluYl"))
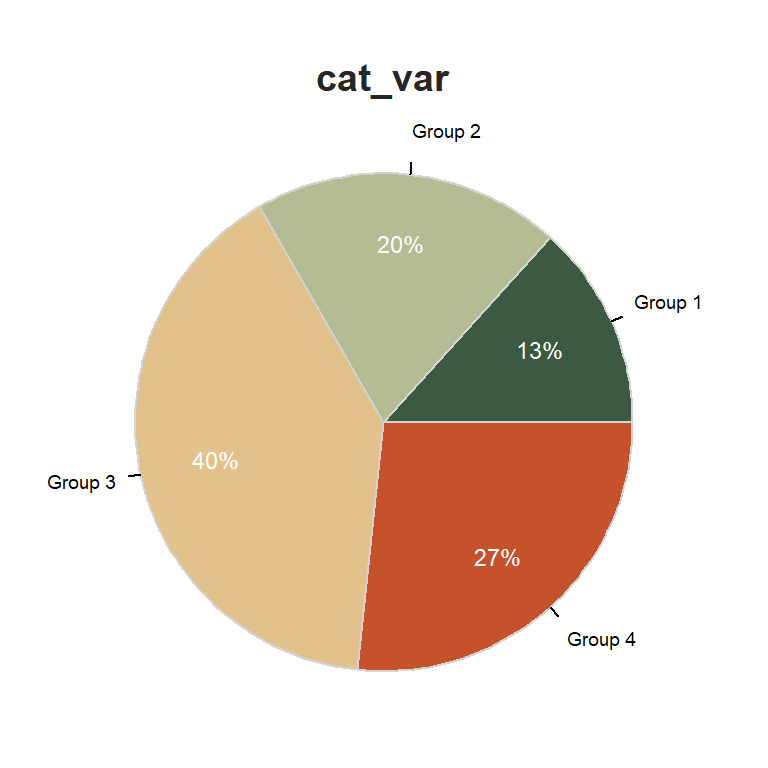
Pie chart with categorical with PieChart
If you want to display the group labels, in addition to the corresponding percentage for each group, you can use PieChart from lessR. This function also displays a table of frequencies and proportions and performs a Chi-square test for checking the equality of probabilities. Note that the data must be a variable of a data frame.
In addition, you can convert the pie chart into a doughnut chart if needed, increasing the value of hole.
# install.packages("lessR")
library(lessR)

# Categorical data
cat_var <- factor(c(rep("Group 1", 10),
                    rep("Group 2", 15),
                    rep("Group 3", 30),
                    rep("Group 4", 20)))

# Store the variable as data frame
cat <- data.frame(cat_var)

# Pie
cols <-  hcl.colors(length(levels(cat_var)), "Fall")
PieChart(cat_var, data = cat, hole = 0,
         fill = cols,
         labels_cex = 0.6)
Master Statistics
Learn statistics from the basics to advanced techniques, clearly explained
Go to site