Sample data set
The following data set contains statistics about arrests in the USA. For illustration purpose we are going to use the first twenty rows of the data set in the following examples.
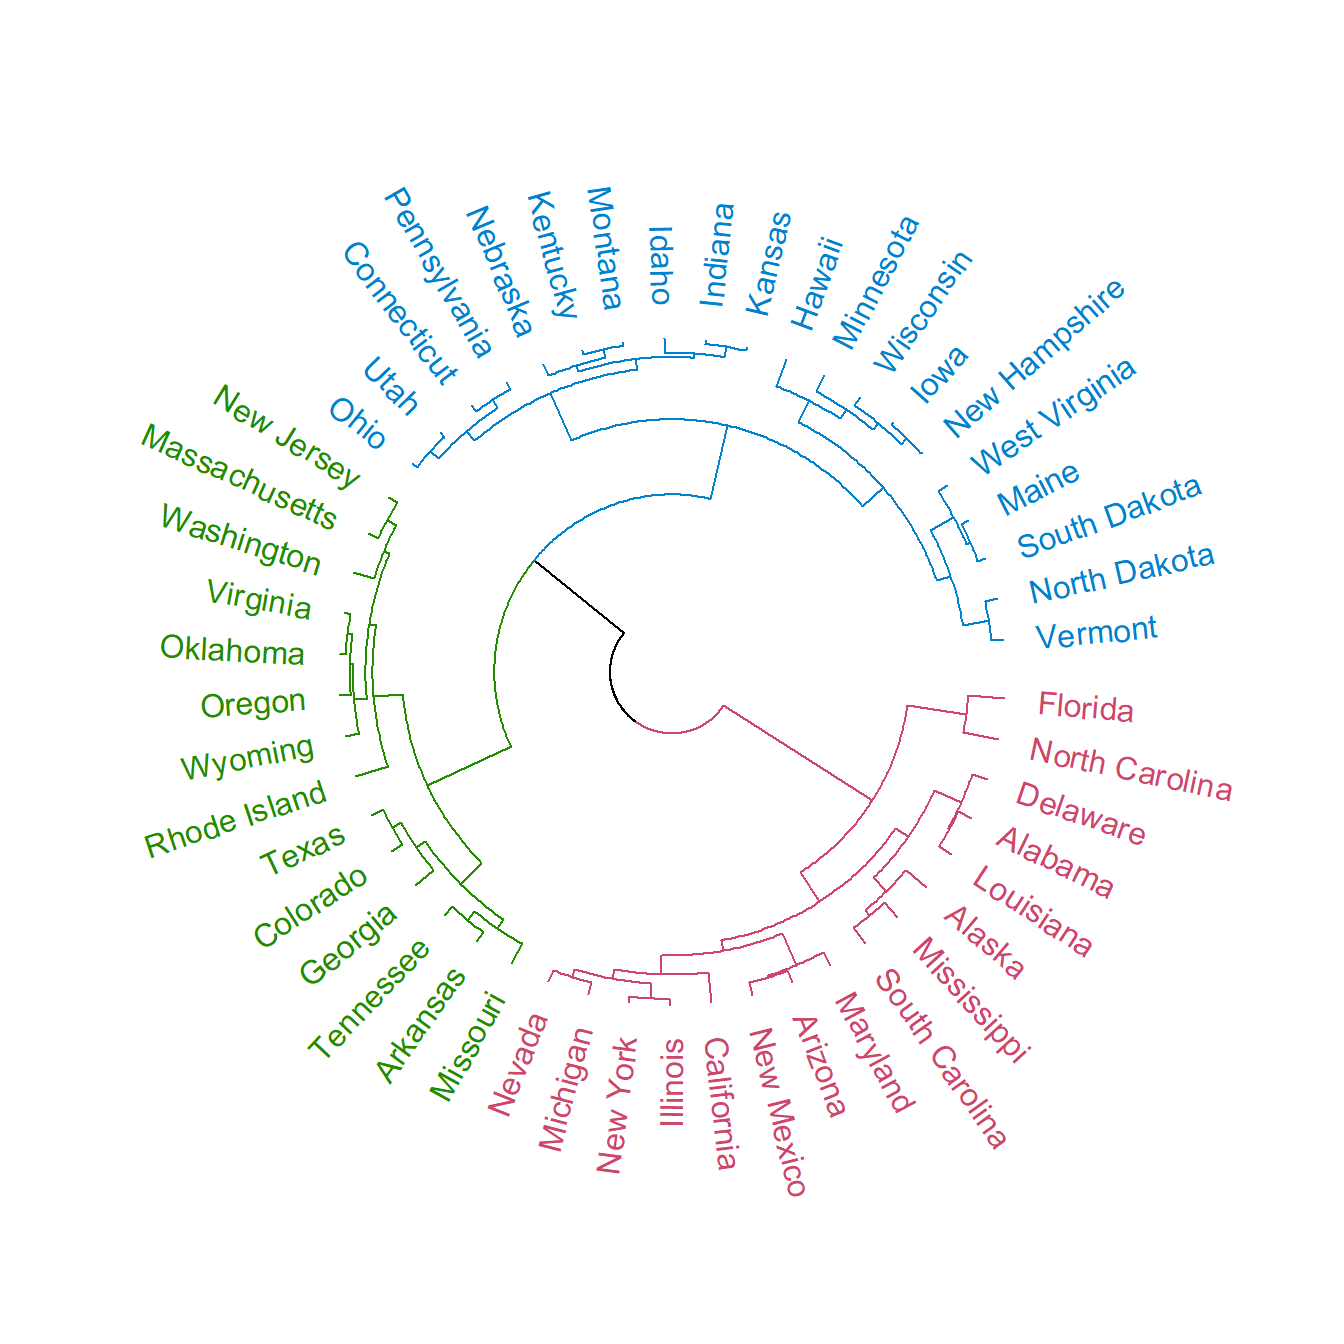
df <- USArrests[1:20, ]Basic dendrogram
In order to create a dendrogram in R first you will need to calculate the distance matrix of your data with dist, then compute the hierarchical clustering of the distance matrix with hclust and plot the dendrogram.
Option 1
Plot the hierarchical clustering object with the plot function.
# Distance matrix
d <- dist(df)

# Hierarchical clustering
hc <- hclust(d)

# Dendrogram
plot(hc)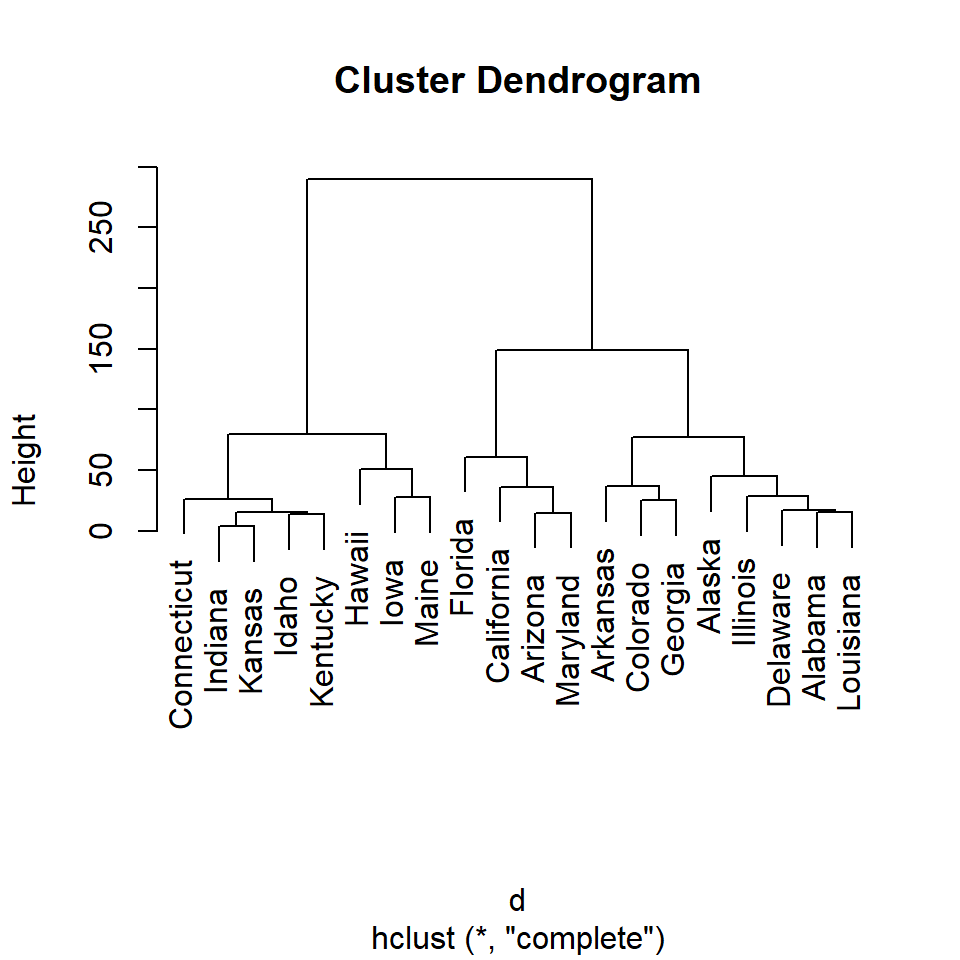
Option 2
Transform the hierarchical clustering output to dendrogram class with as.dendrogram. This will create a nicer visualization.
# Distance matrix
d <- dist(df)

# Hierarchical clustering
hc <- hclust(d)

# Dendrogram
plot(as.dendrogram(hc))

# The previous line is similar to:
# plot(hc, hang = -1)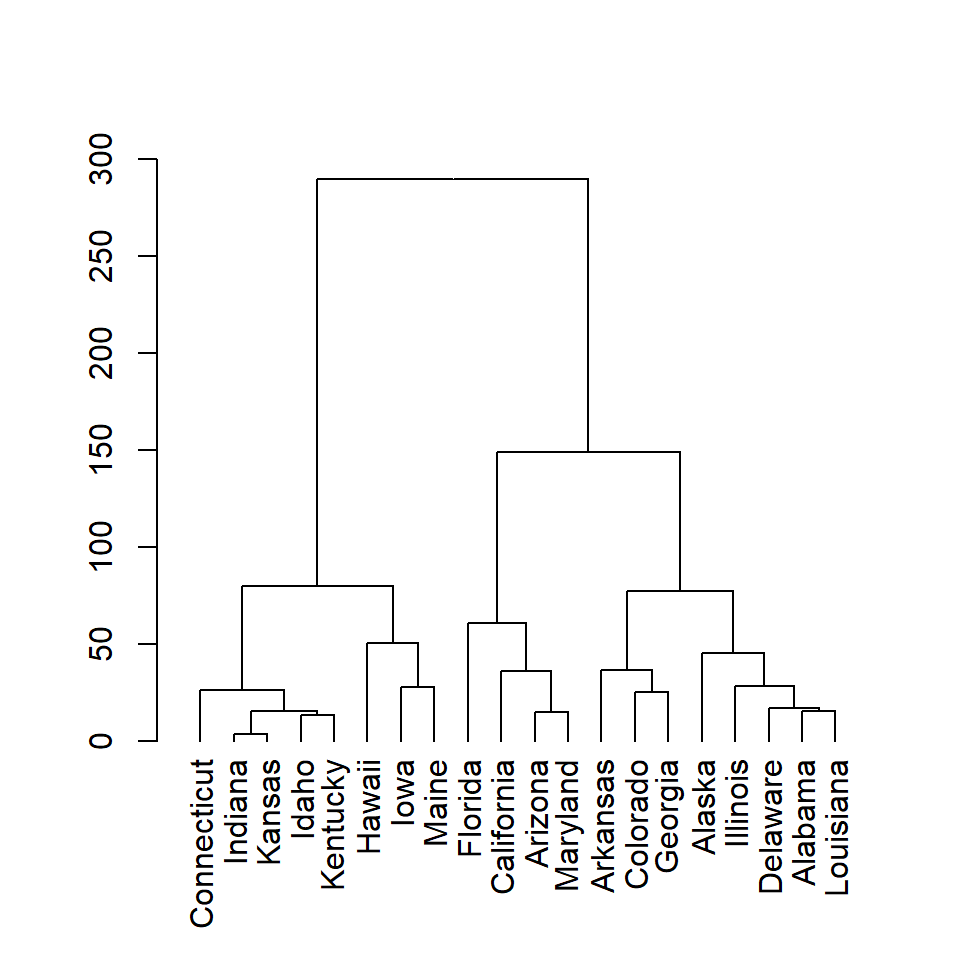
The dist function computes the distance matrix based on the euclidean distance, but there are other distance measures available such as "maximum", "manhattan", "canberra", "binary" or "minkowski". Choose the one that best fits your data.
Clustering methods
In addition to several distance measures there are several hierarchical clustering methods you can choose. The default method is "complete", but you can choose between "ward.D", "ward.D2", "single", "average", "mcquitty", "median" or "centroid". Type ?hclust for additional details about each method and other arguments.
In the examples below you can see the difference using each method.
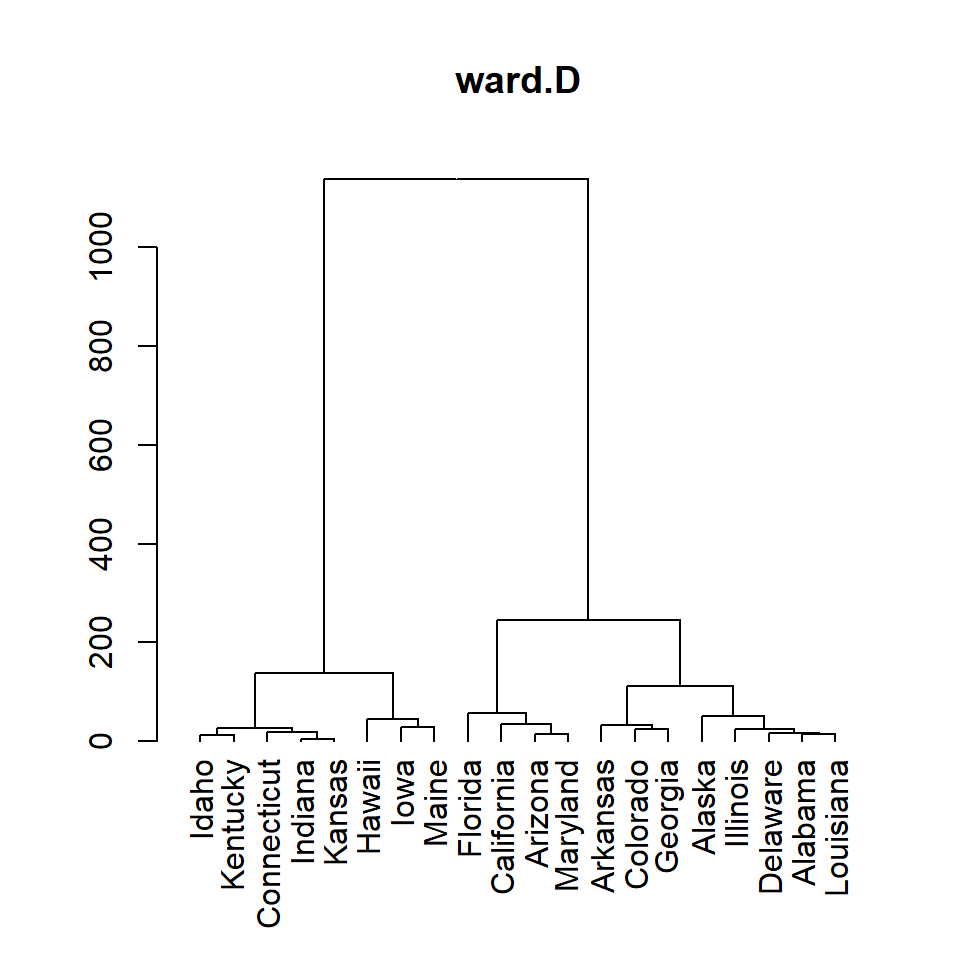
ward.D
# Distance matrix
d <- dist(df)

# Hierarchical clustering
hc <- hclust(d, method = "ward.D")

# Dendrogram
plot(as.dendrogram(hc), main = "ward.D")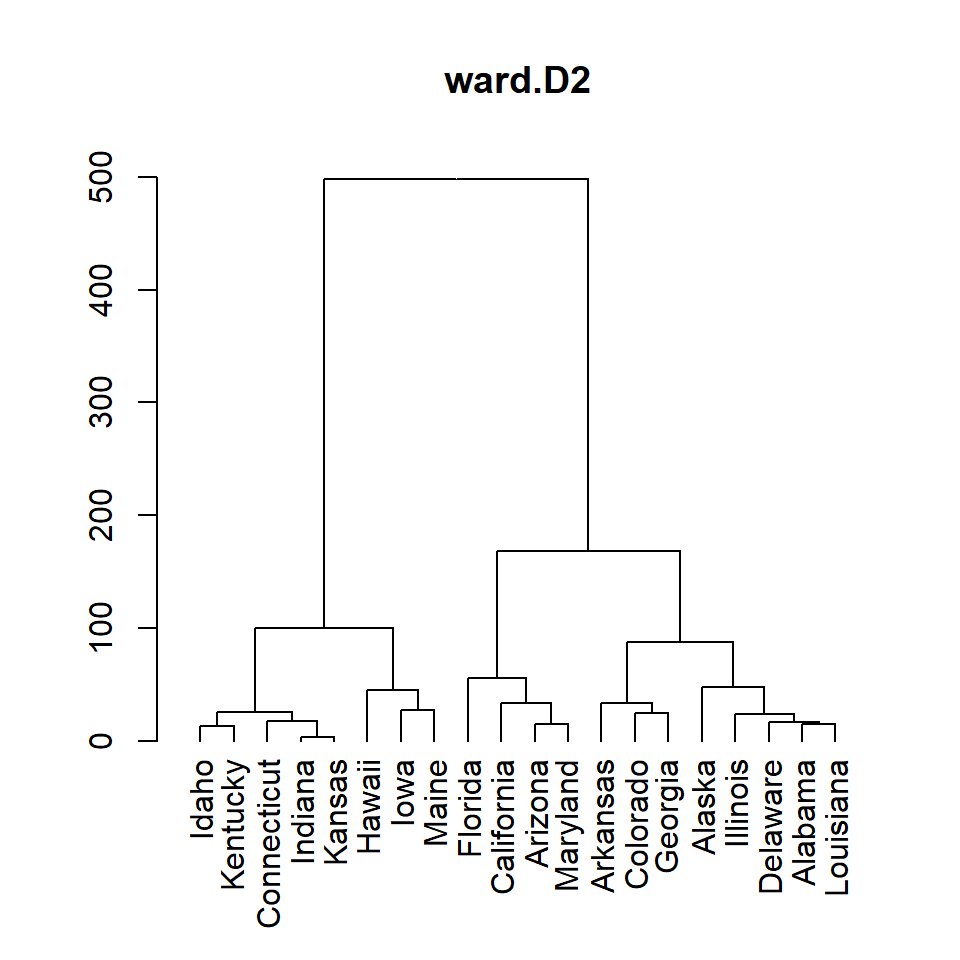
ward.D2
# Distance matrix
d <- dist(df)

# Hierarchical clustering
hc <- hclust(d, method = "ward.D2")

# Dendrogram
plot(as.dendrogram(hc), main = "ward.D2")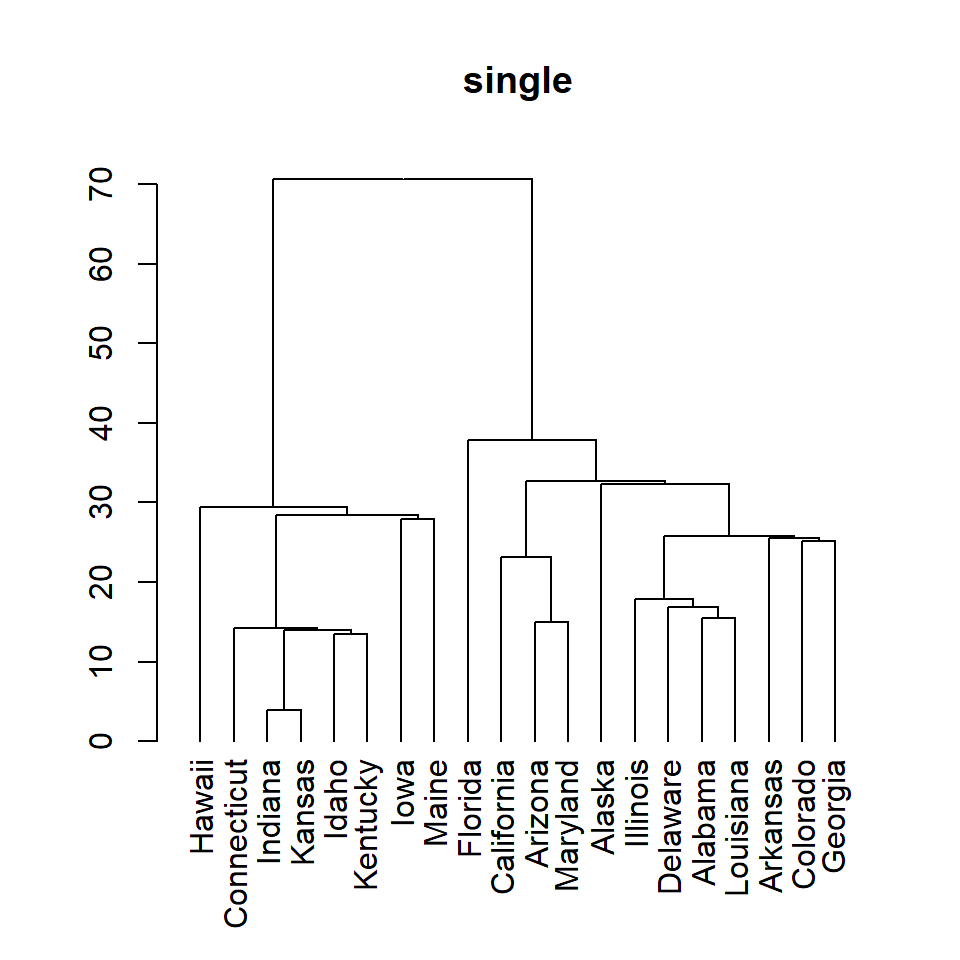
single
# Distance matrix
d <- dist(df)

# Hierarchical clustering
hc <- hclust(d, method = "single")

# Dendrogram
plot(as.dendrogram(hc), main = "single")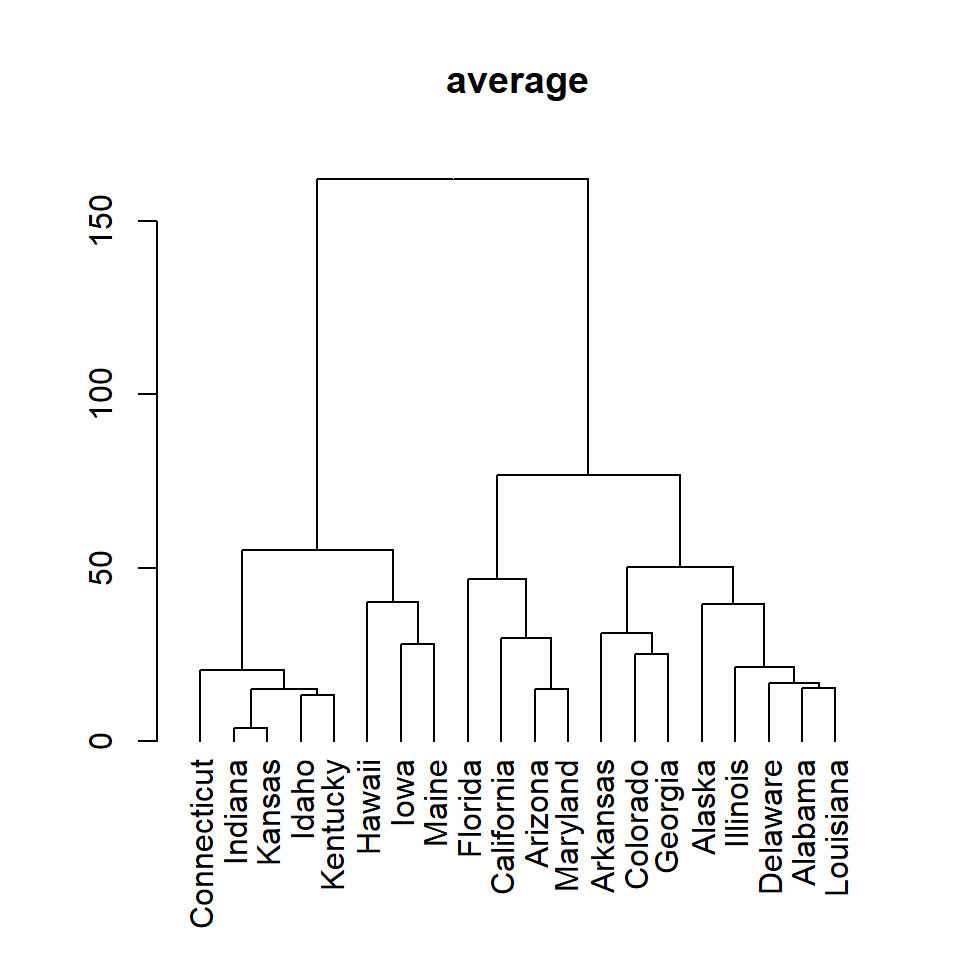
average
# Distance matrix
d <- dist(df)

# Hierarchical clustering
hc <- hclust(d, method = "average")

# Dendrogram
plot(as.dendrogram(hc), main = "average")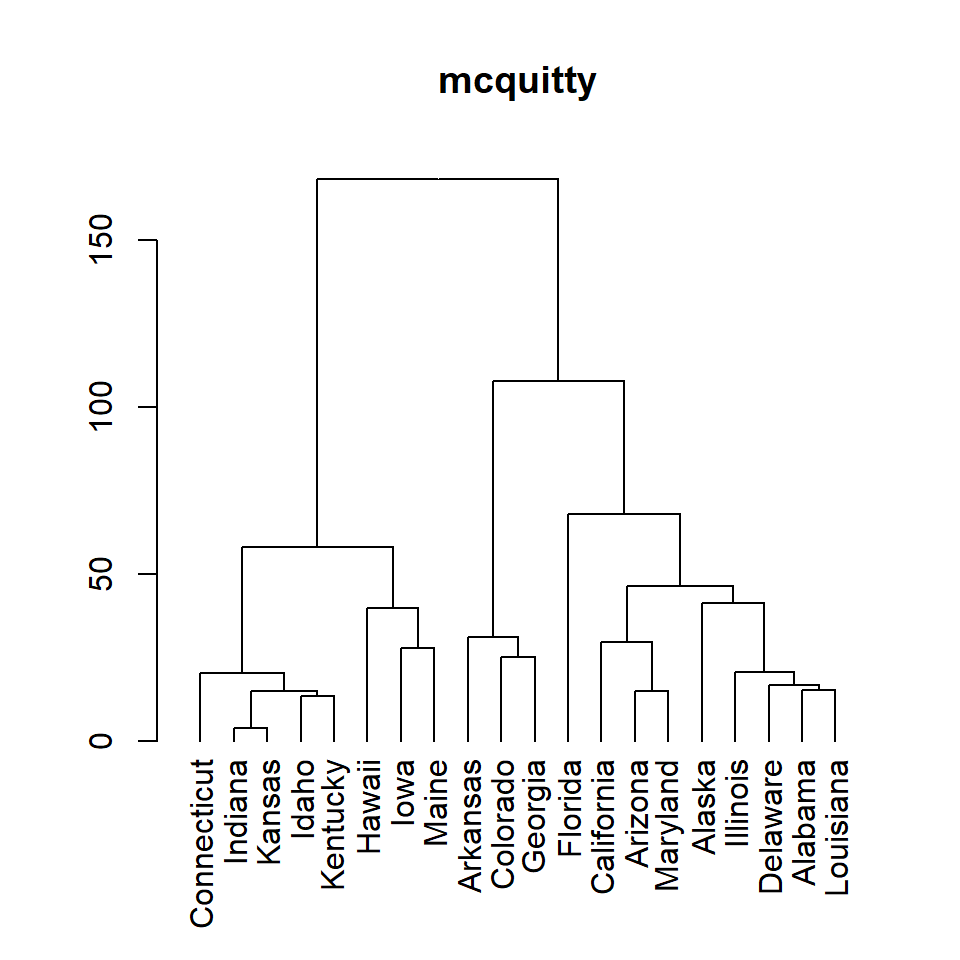
mcquitty
# Distance matrix
d <- dist(df)

# Hierarchical clustering
hc <- hclust(d, method = "mcquitty")

# Dendrogram
plot(as.dendrogram(hc), main = "mcquitty")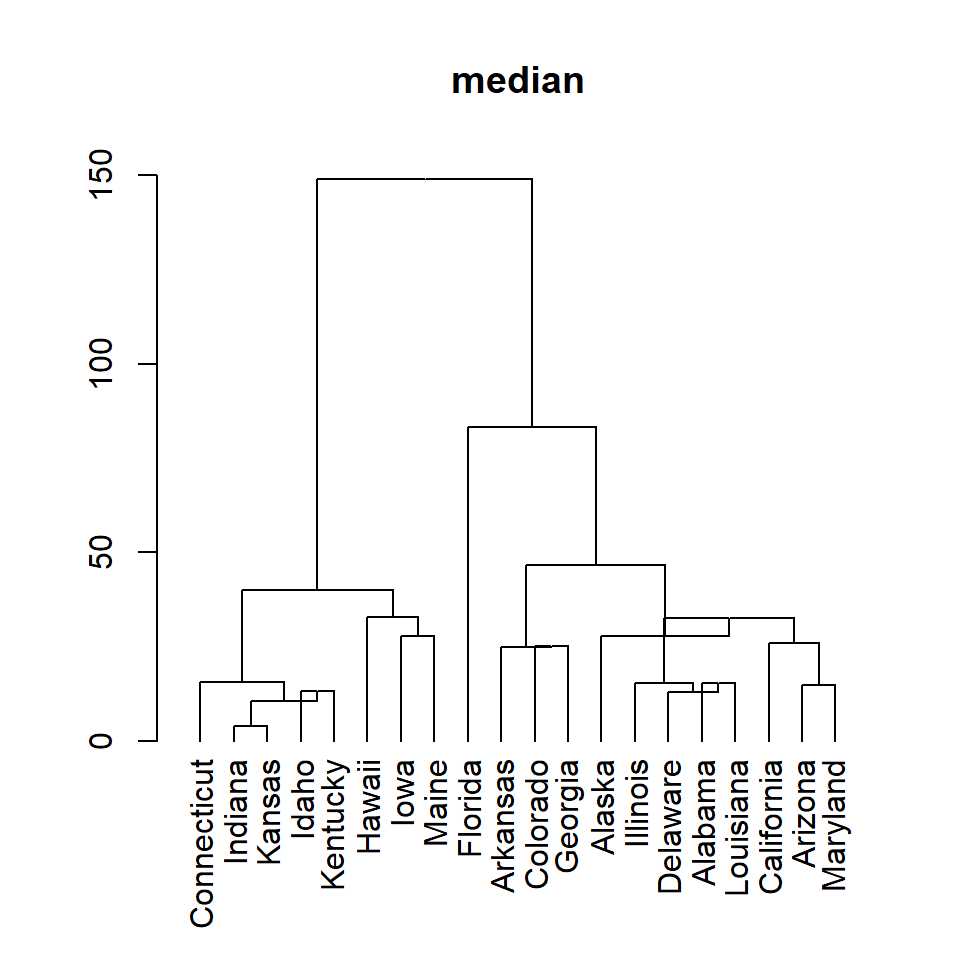
median
# Distance matrix
d <- dist(df)

# Hierarchical clustering
hc <- hclust(d, method = "median")

# Dendrogram
plot(as.dendrogram(hc), main = "median")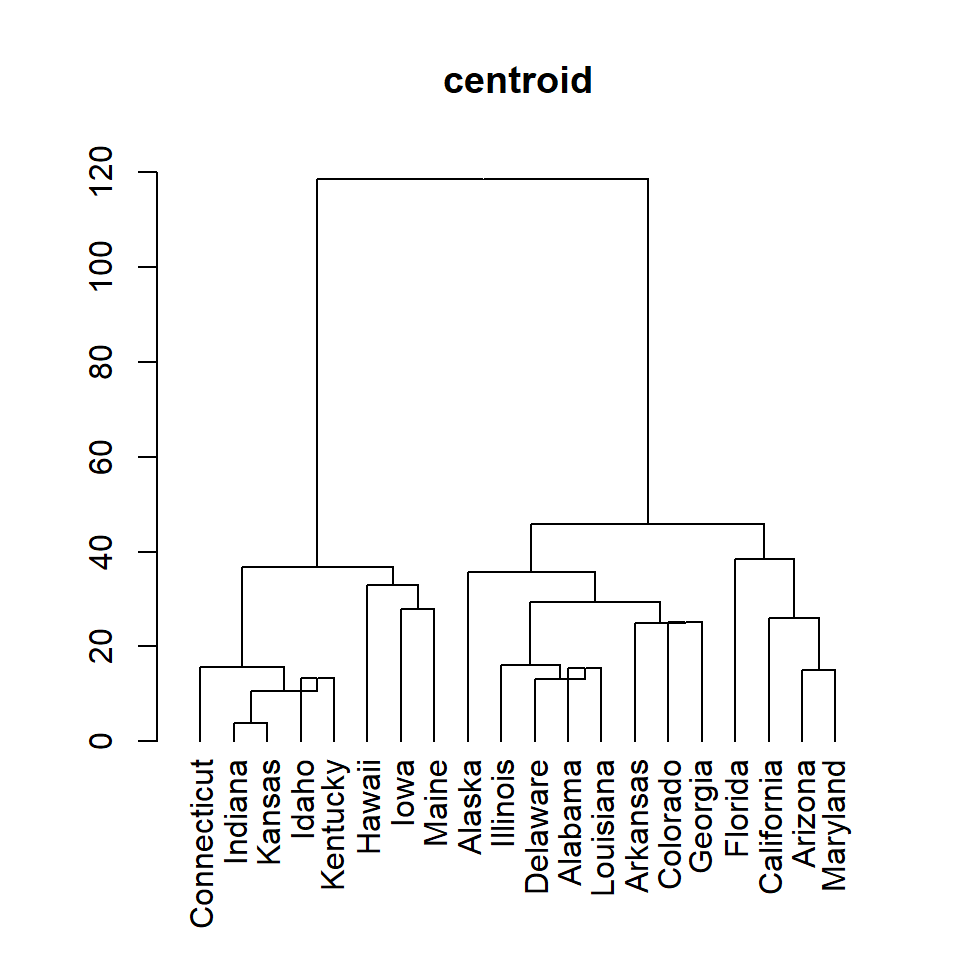
centroid
# Distance matrix
d <- dist(df)

# Hierarchical clustering
hc <- hclust(d, method = "centroid")

# Dendrogram
plot(as.dendrogram(hc), main = "centroid")
Adding rectangles around hierarchical clusters
Setting the number of clusters
The rect.hclust function allows adding clustering rectangles to the dendrogram. You can select the number of clusters to be displayed with k.
# Distance matrix
d <- dist(df)

# Hierarchical clustering
hc <- hclust(d)

# Dendrogram with 3 clusters
plot(as.dendrogram(hc))
rect.hclust(hc, k = 3)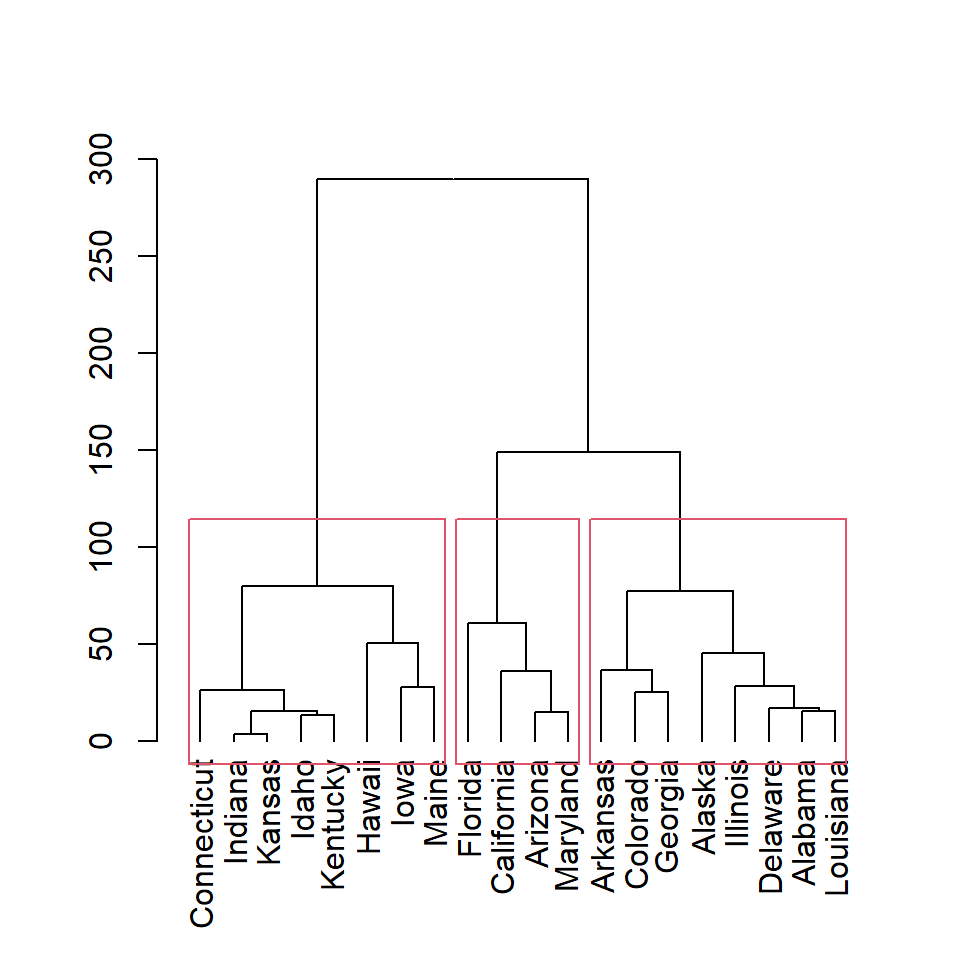
Note that you can display only some of the rectangles based on the number of clusters. In this example we are adding only the first and the third clusters rectangles.
# Distance matrix
d <- dist(df)

# Hierarchical clustering
hc <- hclust(d)

# 3 clusters, two rectangles
plot(as.dendrogram(hc))
rect.hclust(hc, k = 3,
            which = c(1, 3))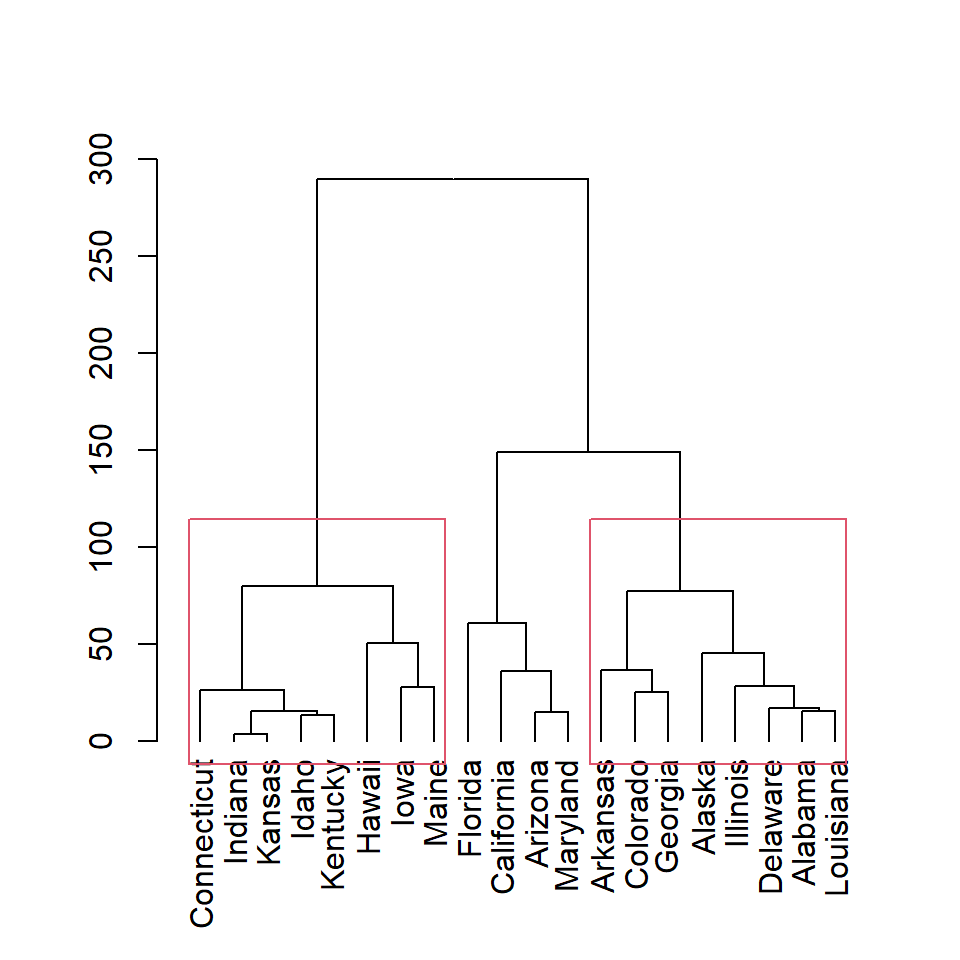
Clusters based on height
You can also create clusters based on height with h argument. Here we are setting h = 150, so two clusters will be created.
# Distance matrix
d <- dist(df)

# Hierarchical clustering
hc <- hclust(d)

# Dendrogram clusters based on height
plot(as.dendrogram(hc))
rect.hclust(hc, h = 150)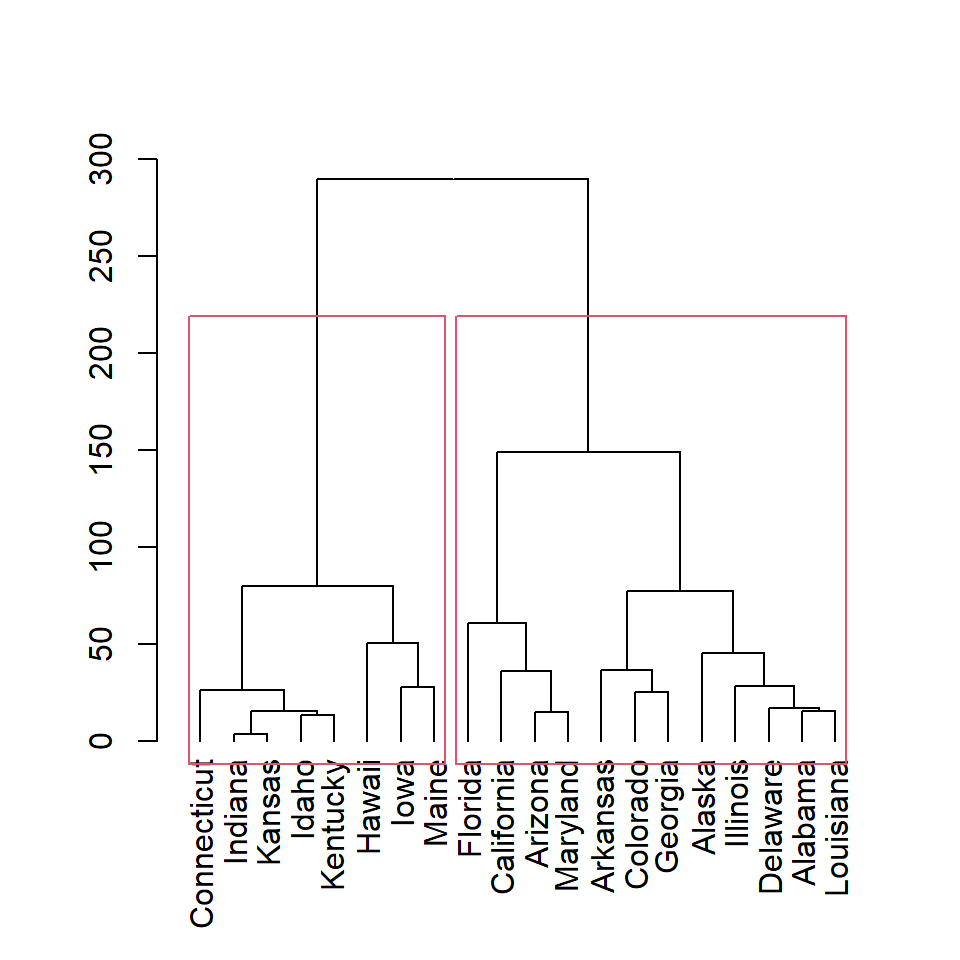
Color of the rectangles
The color for each rectangle can be customized with border argument. You can set one color or as many colors as rectangles.
# Distance matrix
d <- dist(df)

# Hierarchical clustering
hc <- hclust(d)

# Cluster colors
plot(as.dendrogram(hc))
rect.hclust(hc, k = 2,
            border = 3:4)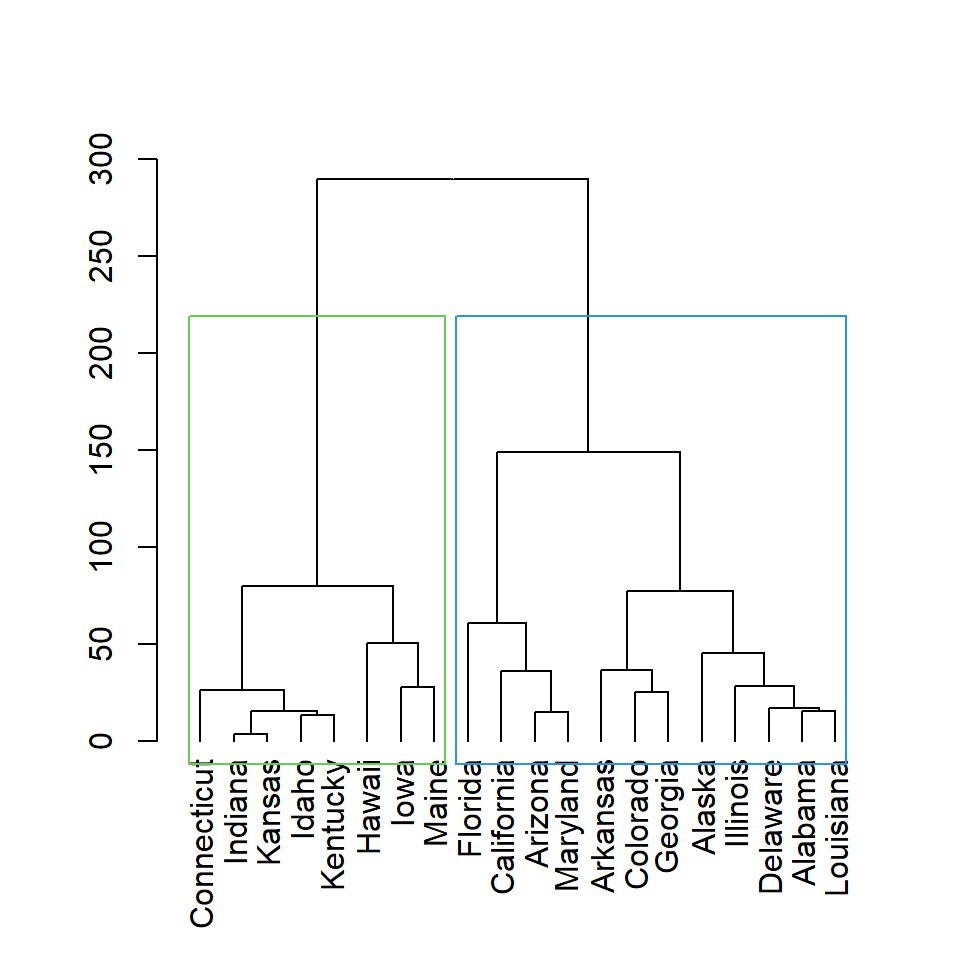

Master Statistics
Learn statistics from the basics to advanced techniques, clearly explained
Go to site