Venn diagram with ggVennDiagram
ggVennDiagram allows creating Venn diagrams based on ggplot2. You need to pass a list of vectors containing your data to the ggVennDiagram function as in the following example. Note that character vectors will be transformed into numeric.
# install.packages("ggVennDiagram")
library(ggVennDiagram)

# List of items
x <- list(A = 1:5, B = 2:7)

# 2D Venn diagram
ggVennDiagram(x)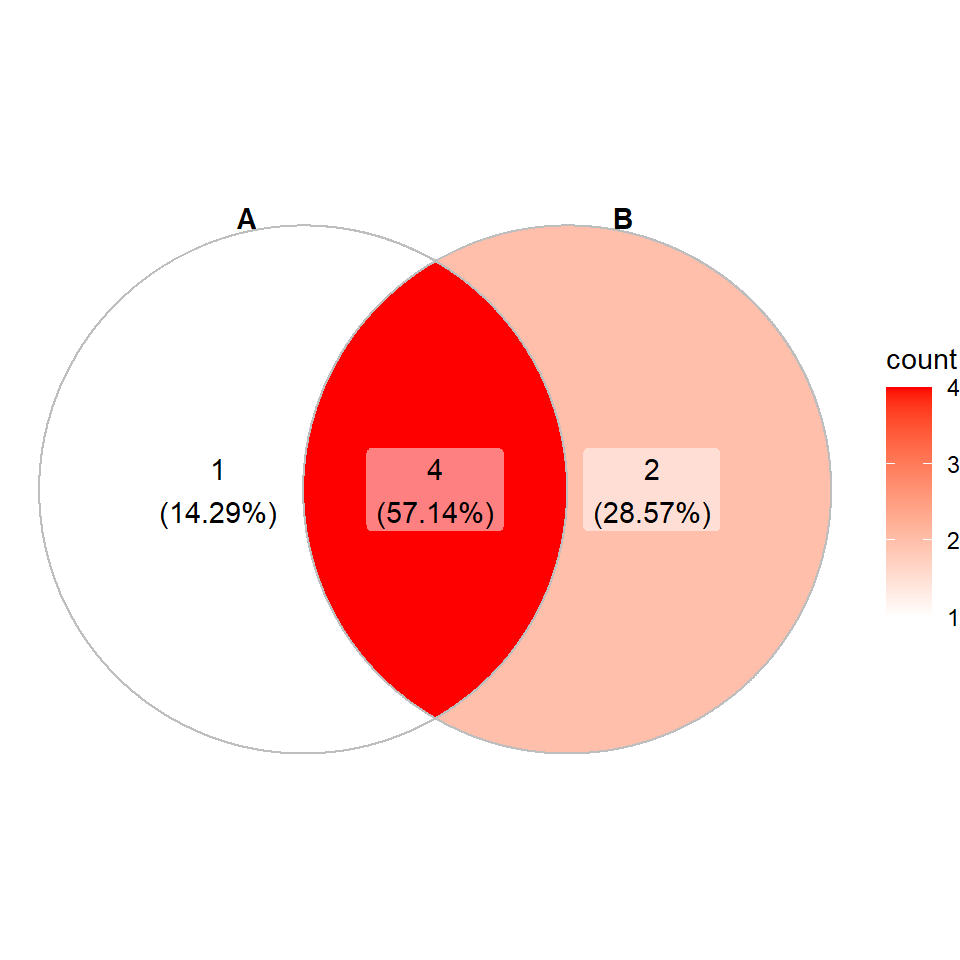
3D Venn diagram
If you pass a list with three elements you will get some Venn diagram like the following.
# install.packages("ggVennDiagram")
library(ggVennDiagram)

# List of items
x <- list(A = 1:5, B = 2:7, C = 5:10)

# 3D Venn diagram
ggVennDiagram(x)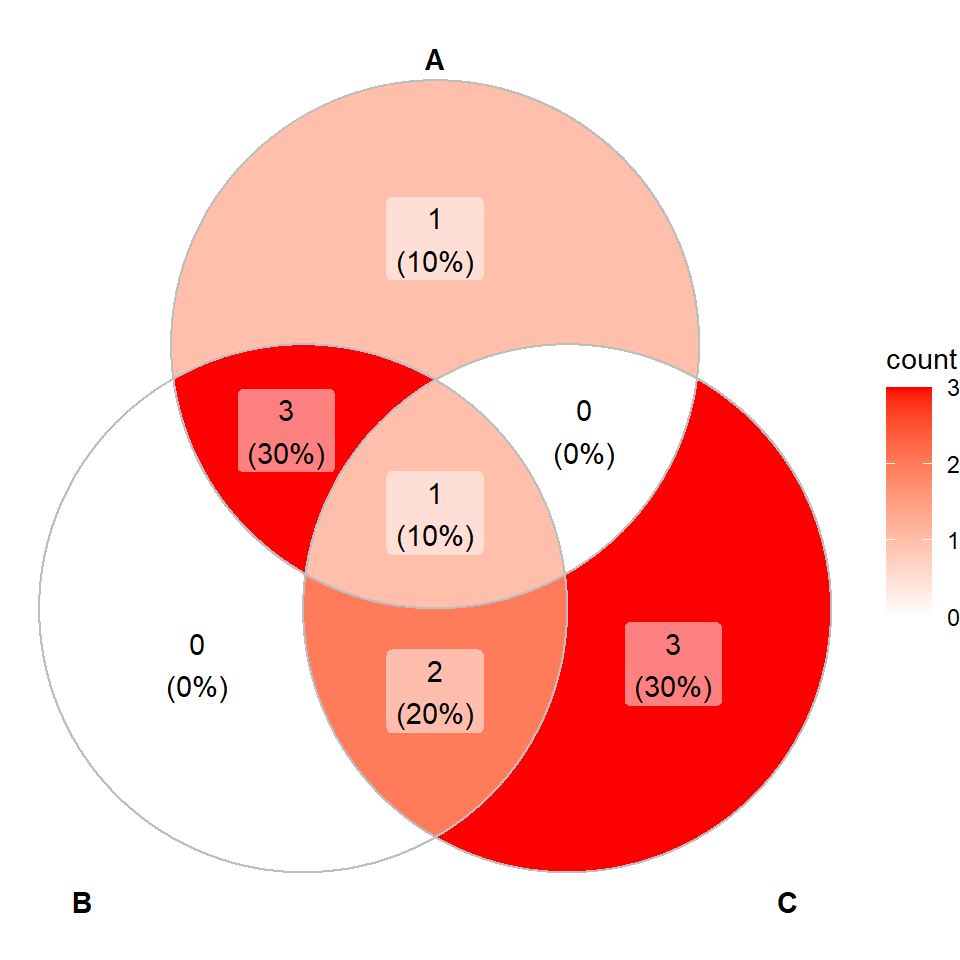
4D Venn diagram
You can also pass a list with up to four different elements. If you need to add more refer to the documentation.
# install.packages("ggVennDiagram")
library(ggVennDiagram)

# List of items
x <- list(A = 1:5, B = 2:7, C = 5:10, D = 8:15)

# 4D Venn diagram
ggVennDiagram(x)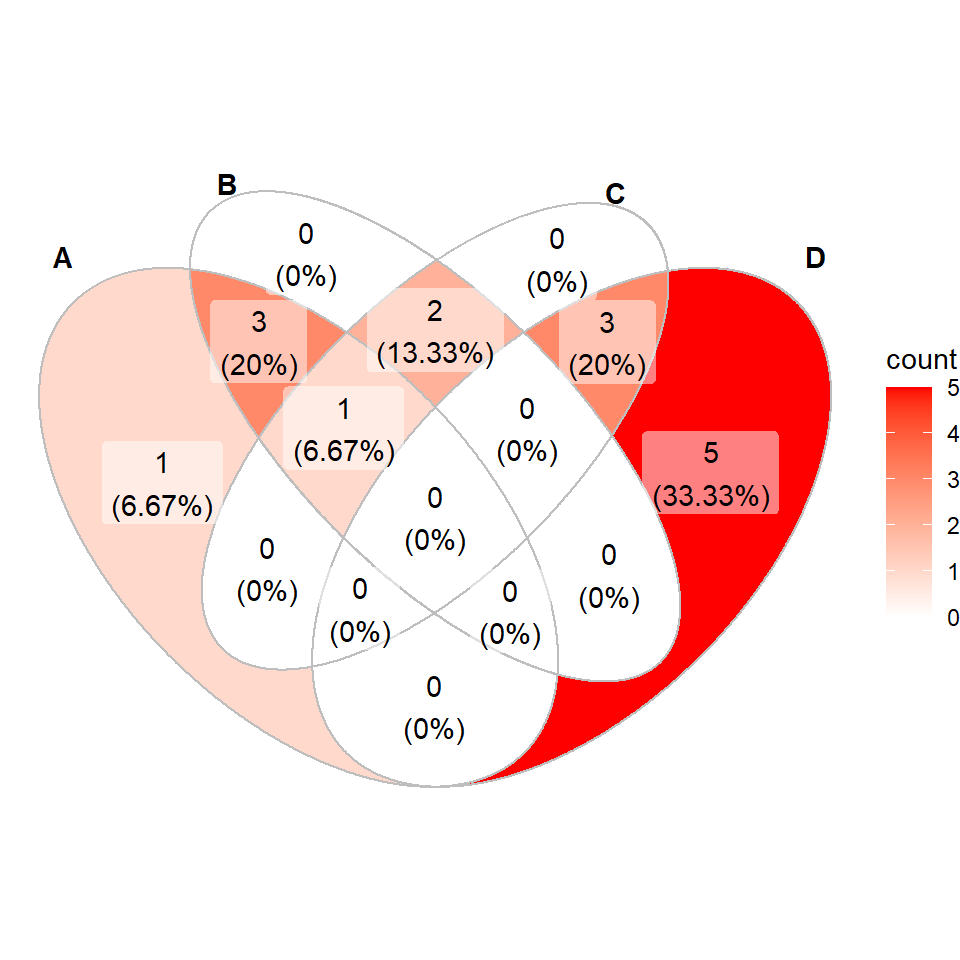
Changing the colors of the diagram
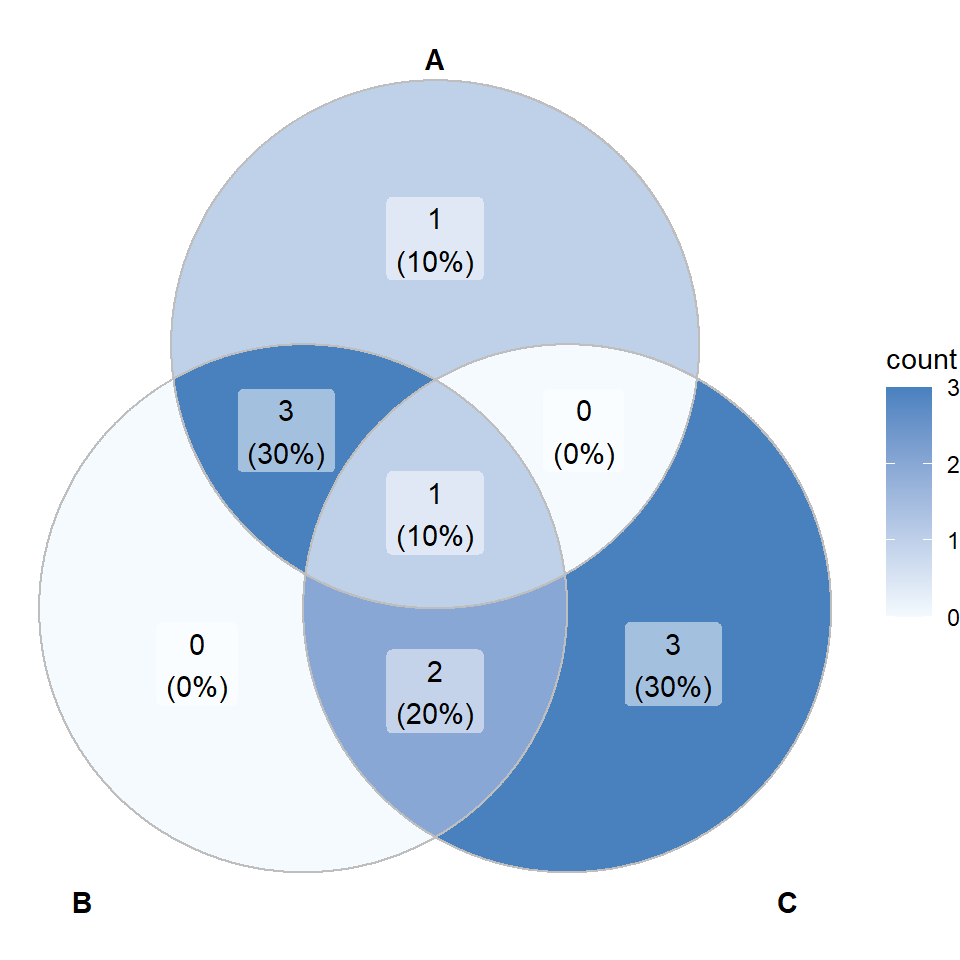
As ggVennDiagram is based on ggplot2 you can add more layers or override the ones existing. In order to change the colors use scale_fill_gradient as in the following example.
# install.packages("ggVennDiagram")
library(ggVennDiagram)
# install.packages("ggplot2")
library(ggplot2)

# List of items
x <- list(A = 1:5, B = 2:7, C = 5:10)

# Venn diagram with custom colors
ggVennDiagram(x) +
  scale_fill_gradient(low = "#F4FAFE", high = "#4981BF")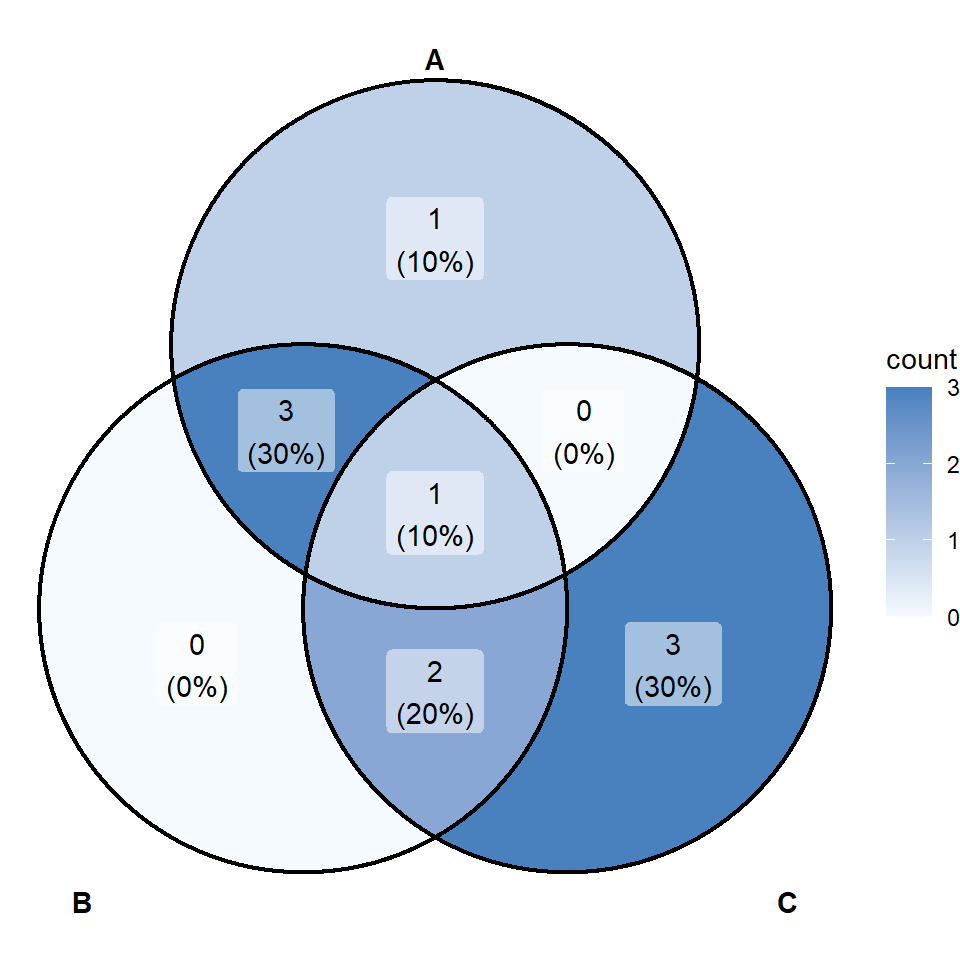
The border can also be customized but making use of color argument. The line width and line style can be changed with lwd and lty, respectively.
# install.packages("ggVennDiagram")
library(ggVennDiagram)
# install.packages("ggplot2")
library(ggplot2)

# List of items
x <- list(A = 1:5, B = 2:7, C = 5:10)

# Venn diagram with custom border
ggVennDiagram(x, color = "black", lwd = 0.8, lty = 1) +
  scale_fill_gradient(low = "#F4FAFE", high = "#4981BF")
Labels and group names
Group names
By default, the function uses the names of the list to set the category names, but you can override them with category.names.
# install.packages("ggVennDiagram")
library(ggVennDiagram)

# List of items
x <- list(A = 1:5, B = 2:7, C = 5:10)

# Venn diagram with custom category names
ggVennDiagram(x, category.names = c("Group 1",
                                    "Group 2",
                                    "Group 3"))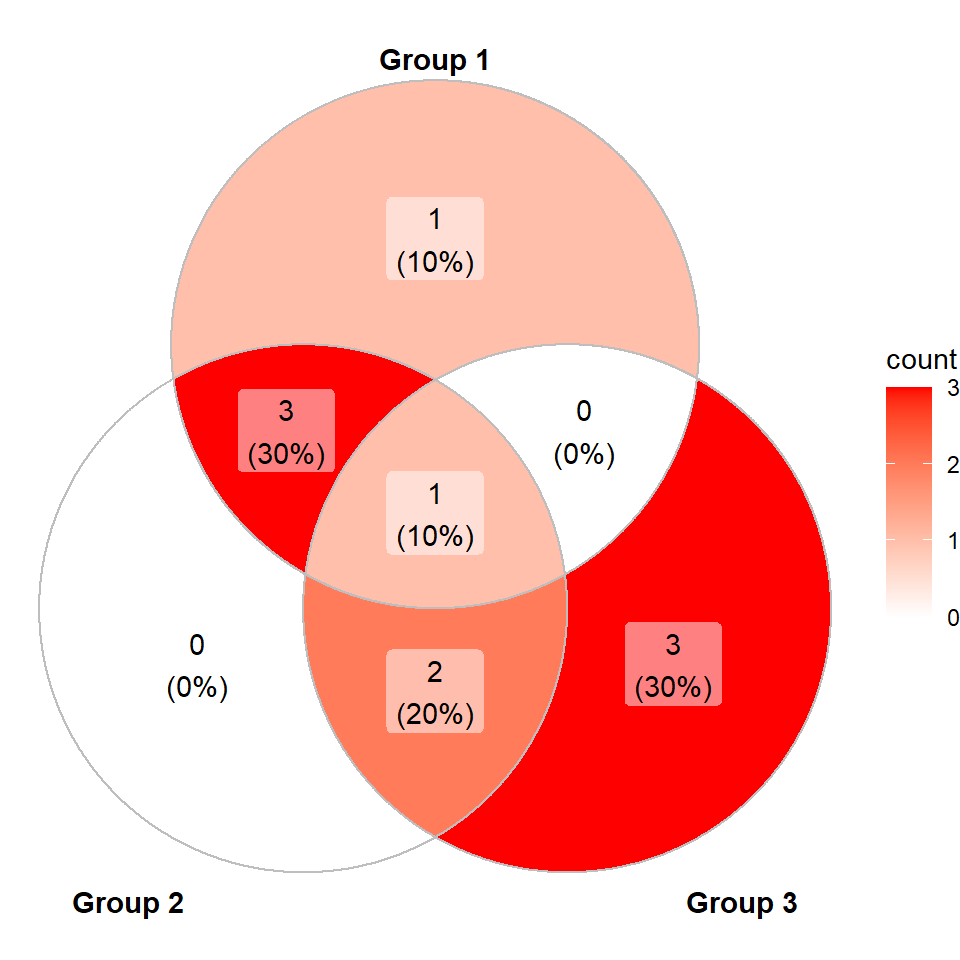
Labels with percentages
Labels display percentages and the count of values. Set label = "percent" to only show percentages.
# install.packages("ggVennDiagram")
library(ggVennDiagram)

# List of items
x <- list(A = 1:5, B = 2:7, C = 5:10)

# Venn diagram with percentages
ggVennDiagram(x,
              label = "percent")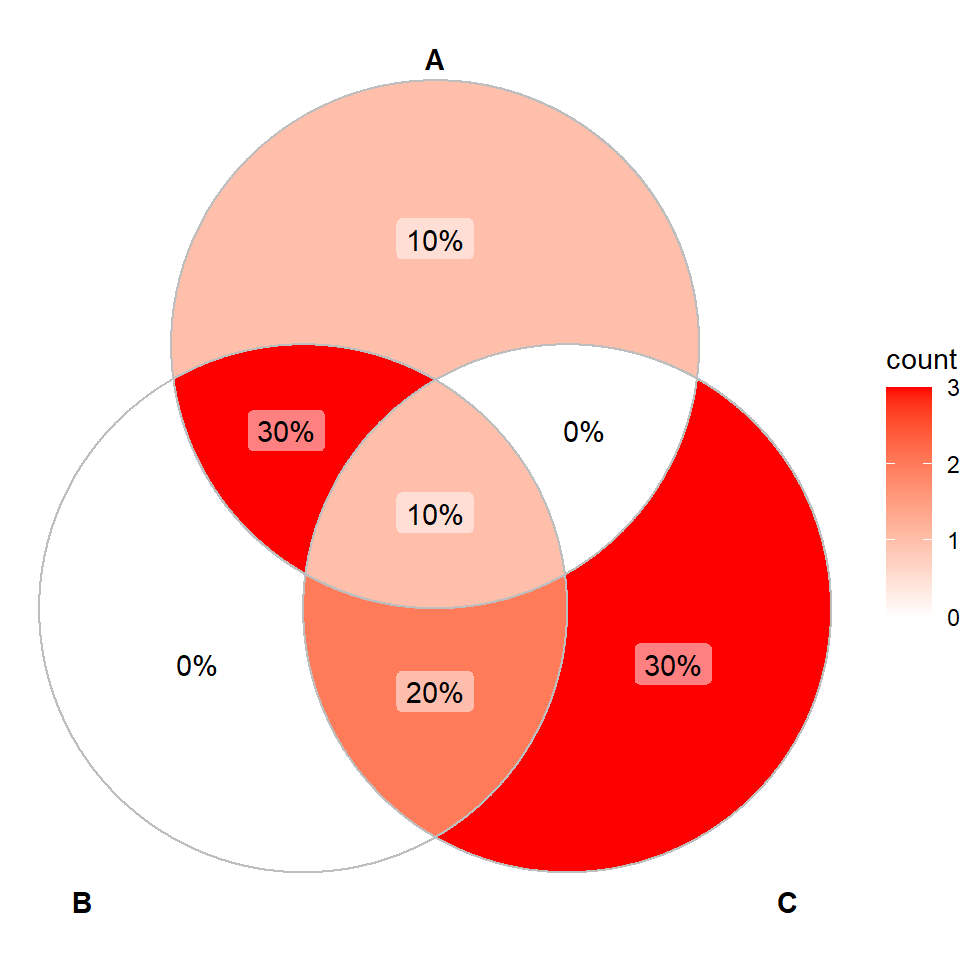
Labels with count
If you prefer showing only the count set label = "count".
# install.packages("ggVennDiagram")
library(ggVennDiagram)

# List of items
x <- list(A = 1:5, B = 2:7, C = 5:10)

# Venn diagram with count labels
ggVennDiagram(x,
              label = "count")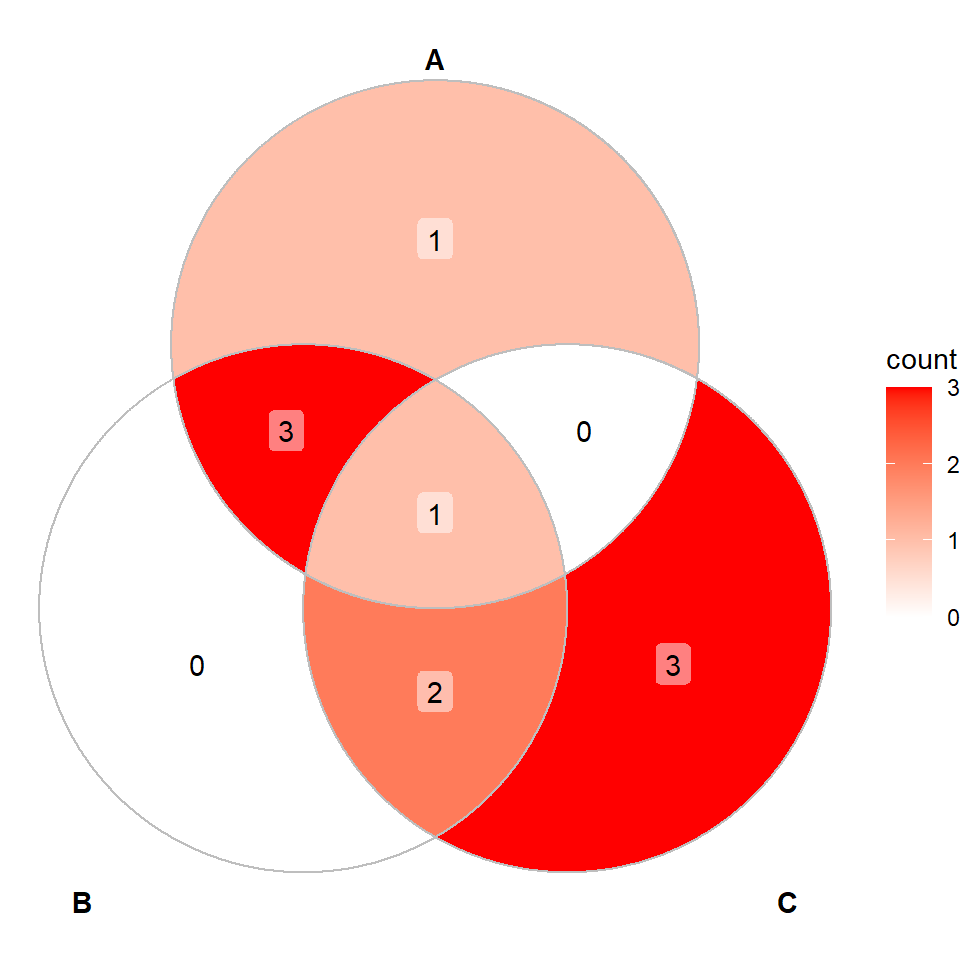
Remove the labels
It is possible to remove all the labels just setting label = NULL.
# install.packages("ggVennDiagram")
library(ggVennDiagram)

# List of items
x <- list(A = 1:5, B = 2:7, C = 5:10)

# Venn diagram without labels
ggVennDiagram(x,
              label = NULL)
Labels transparency
If you install the development version of the package from GitHub there is an additional argument that allows modifying the transparency of the background of the labels.
# install.packages("devtools")
# devtools::install_github("gaospecial/ggVennDiagram")
library(ggVennDiagram)

# List of items
x <- list(A = 1:5, B = 2:7, C = 5:10)

# Labels transparency
ggVennDiagram(x,
              label_alpha = 0)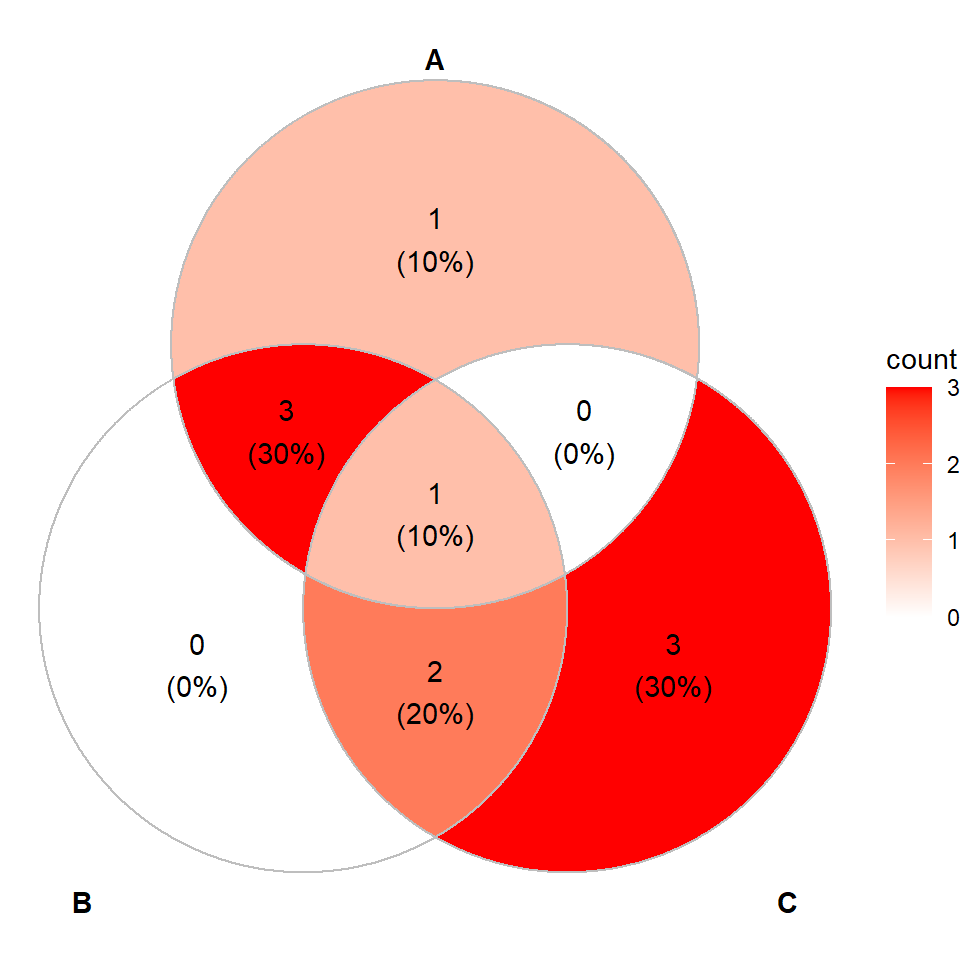
Remove or customize the legend
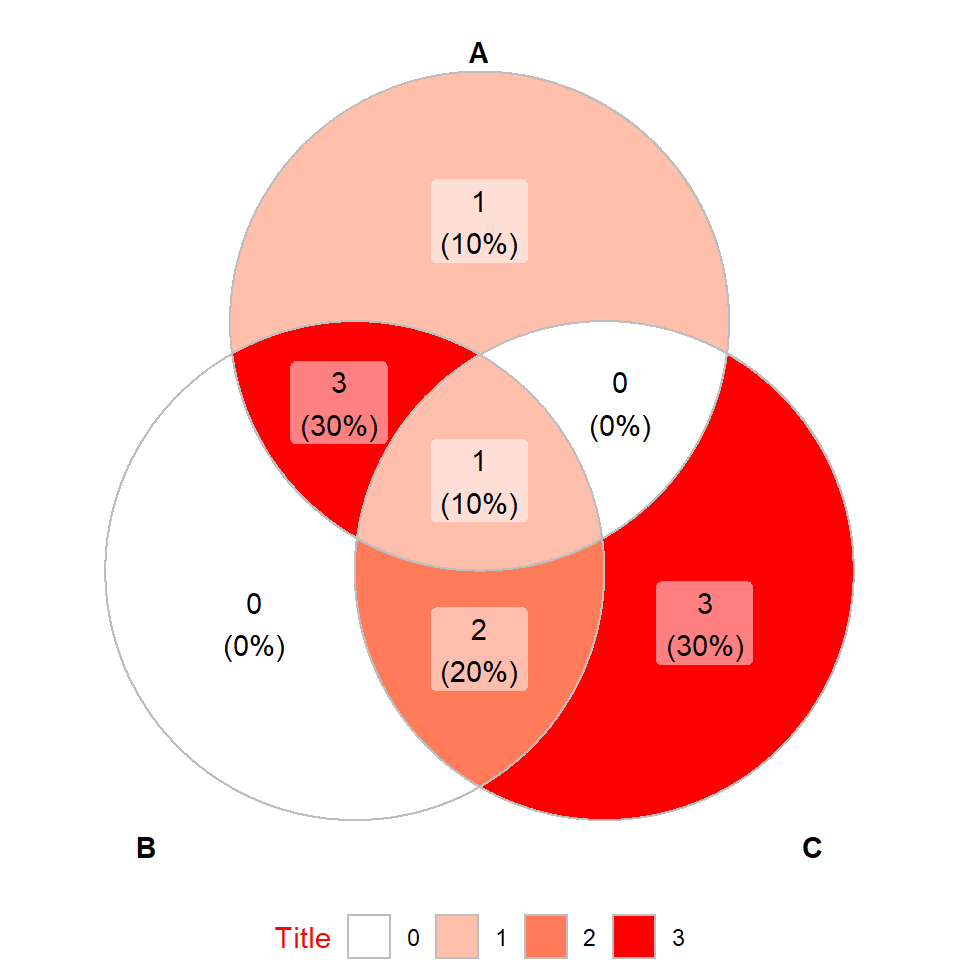
The legend of the Venn diagrams can be customized adding more layers to the plot. In the following example we are modifying the legend title and the legend position.
# install.packages("ggVennDiagram")
library(ggVennDiagram)
# install.packages("ggplot2")
library(ggplot2)

# List of items
x <- list(A = 1:5, B = 2:7, C = 5:10)

# Venn diagram with custom legend
ggVennDiagram(x) +
  guides(fill = guide_legend(title = "Title")) +
  theme(legend.title = element_text(color = "red"),
        legend.position = "bottom")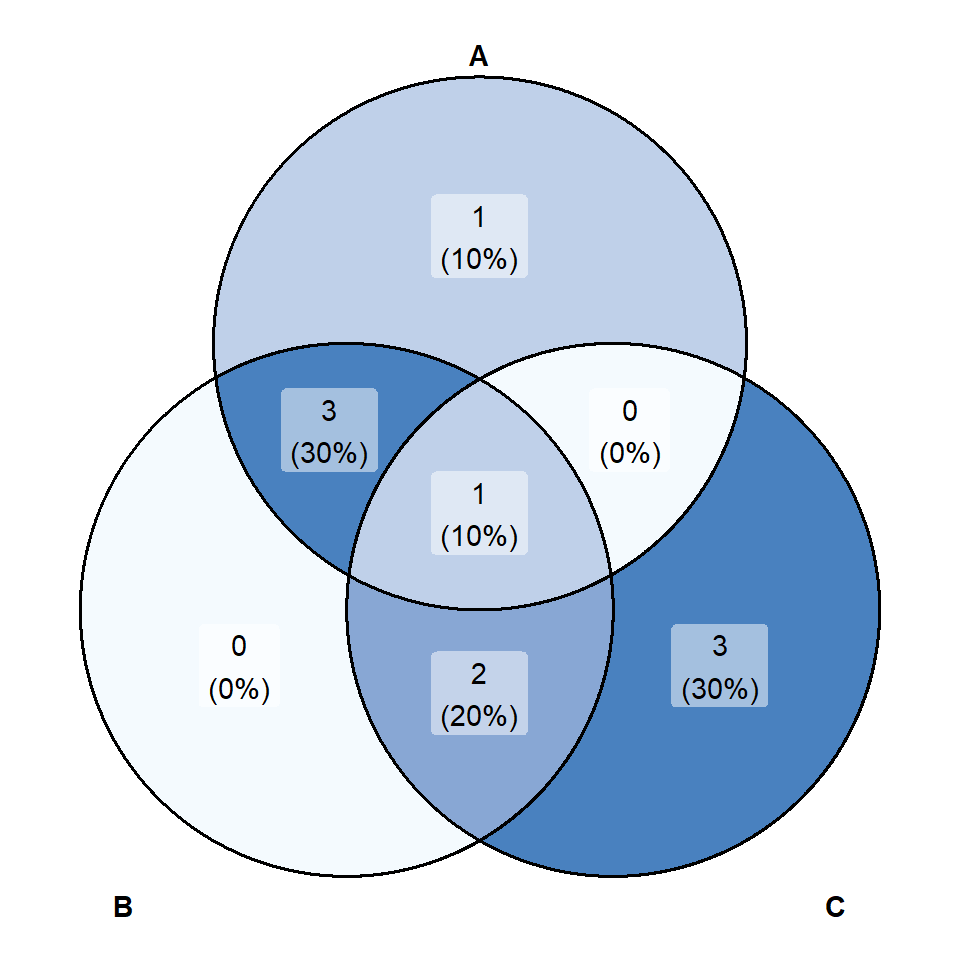
It is possible to remove the legend of the diagram just setting its position to "none".
# install.packages("ggVennDiagram")
library(ggVennDiagram)
# install.packages("ggplot2")
library(ggplot2)

# List of items
x <- list(A = 1:5, B = 2:7, C = 5:10)

# Venn diagram without legend
ggVennDiagram(x, color = 1, lwd = 0.7) +
 scale_fill_gradient(low = "#F4FAFE", high = "#4981BF") +
 theme(legend.position = "none")
Master Statistics
Learn statistics from the basics to advanced techniques, clearly explained
Go to site