Sample data
The data set below contains three columns where the first are the values of the X-axis variable, the second the values of the Y-axis variable and the third the euclidean distance between the points and the center of the plot, which is the point (200, 200).
# Data
set.seed(1)
x <- sample(1:400, size = 100)
y <- sample(1:400, size = 100)
dist <- sqrt((x - 200) ^ 2 + (y - 200) ^ 2)

df <- data.frame(x, y, dist = dist)
Voronoi diagram with stat_voronoi
The stat_voronoi function can be used to create a simple Voronoi diagram, passing the x and y variables to the aes function and using stat_voronoi(geom = "path").
# install.packages("ggvoronoi")
# install.packages("ggplot2")
library(ggvoronoi)
library(ggplot2)

ggplot(df, aes(x, y)) +
  stat_voronoi(geom = "path")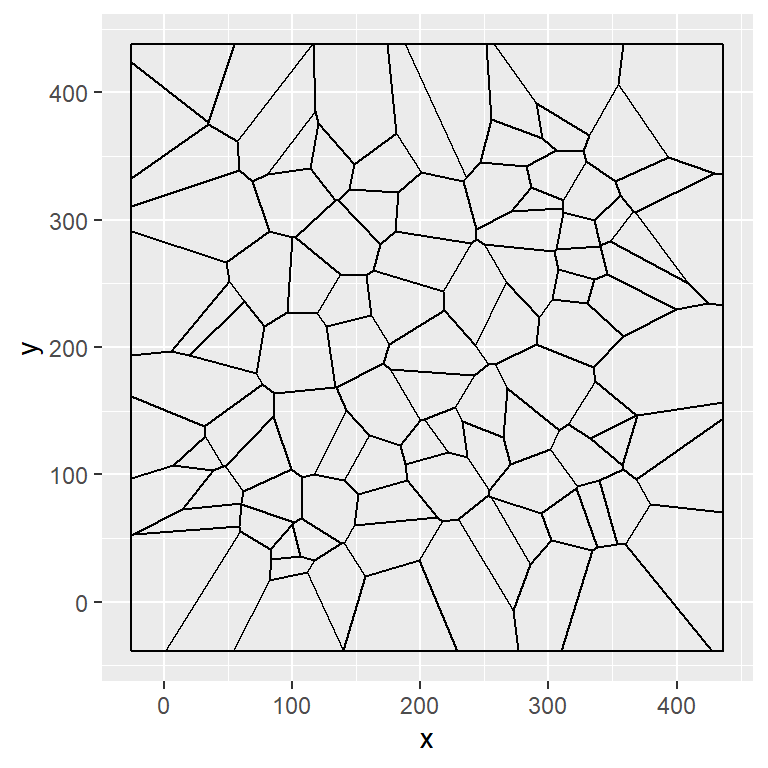
Observations
You can also add the observations making use of geom_point.
# install.packages("ggvoronoi")
# install.packages("ggplot2")
library(ggvoronoi)
library(ggplot2)

ggplot(df, aes(x, y)) +
  stat_voronoi(geom = "path") +
  geom_point()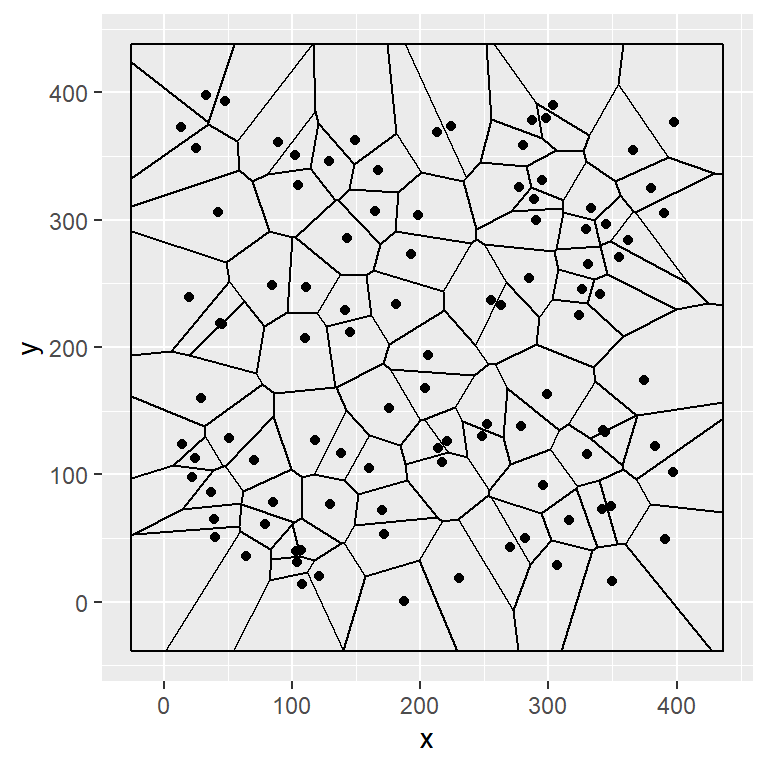
Path style
Note that you can change the styling of the lines with the color, lwd and linetype arguments.
# install.packages("ggvoronoi")
# install.packages("ggplot2")
library(ggvoronoi)
library(ggplot2)

ggplot(df, aes(x, y)) +
  stat_voronoi(geom = "path",
               color = 4,      # Color of the lines
               lwd = 0.7,      # Width of the lines
               linetype = 1) + # Type of the lines
  geom_point()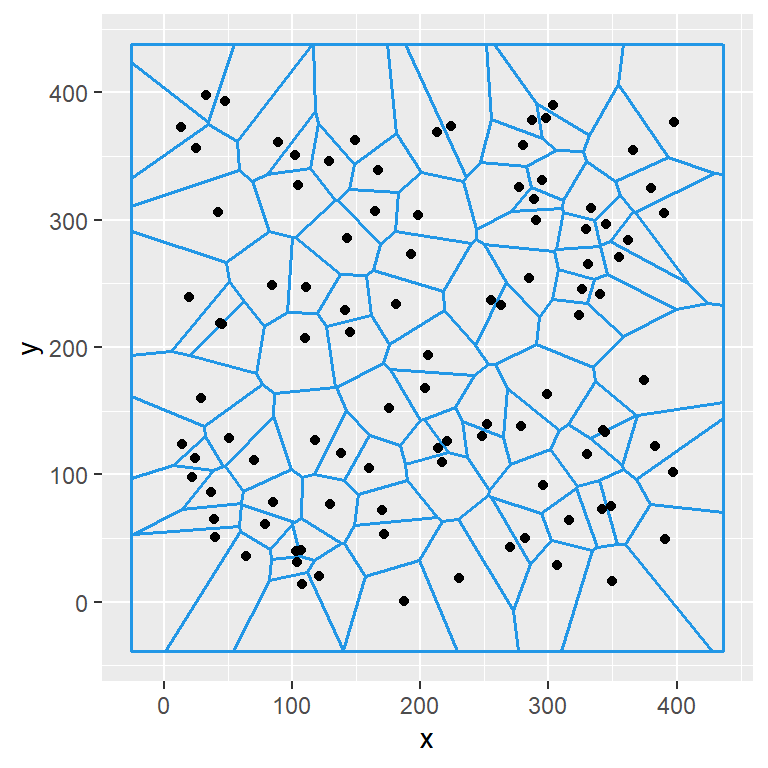
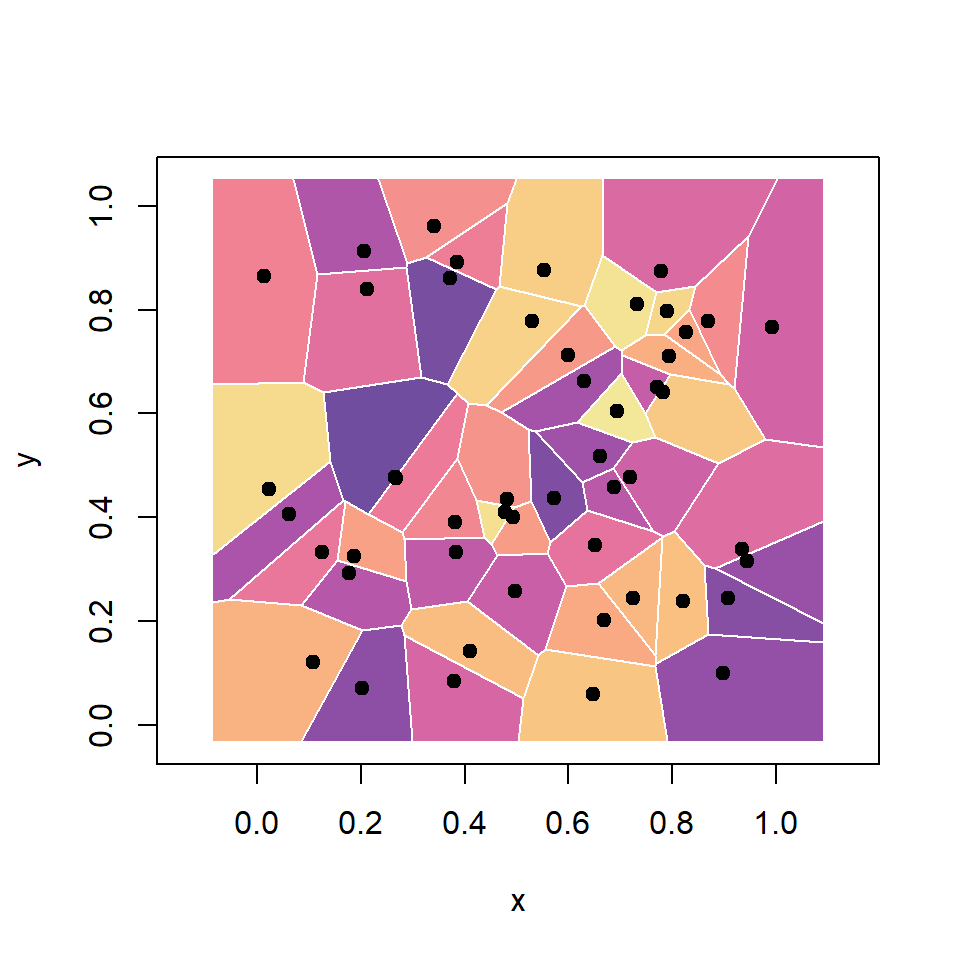
Voronoi heat map
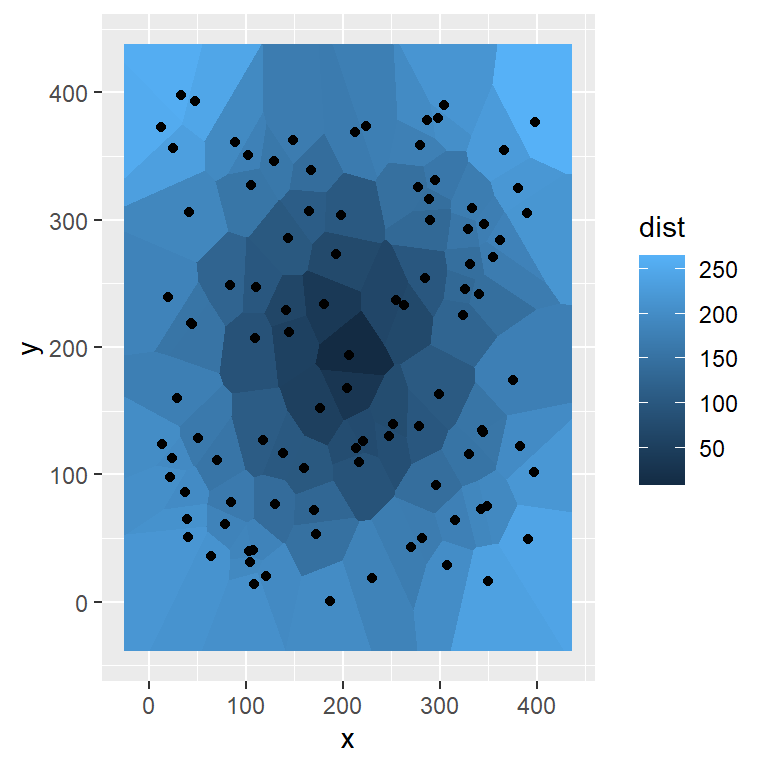
You can pass a variable to the fill argument of the aes function to create a Voronoi heat map. For this purpose you will need to use the geom_voronoi function.
# install.packages("ggvoronoi")
# install.packages("ggplot2")
library(ggvoronoi)
library(ggplot2)

ggplot(df, aes(x, y, fill = dist)) +
  geom_voronoi() +
  geom_point()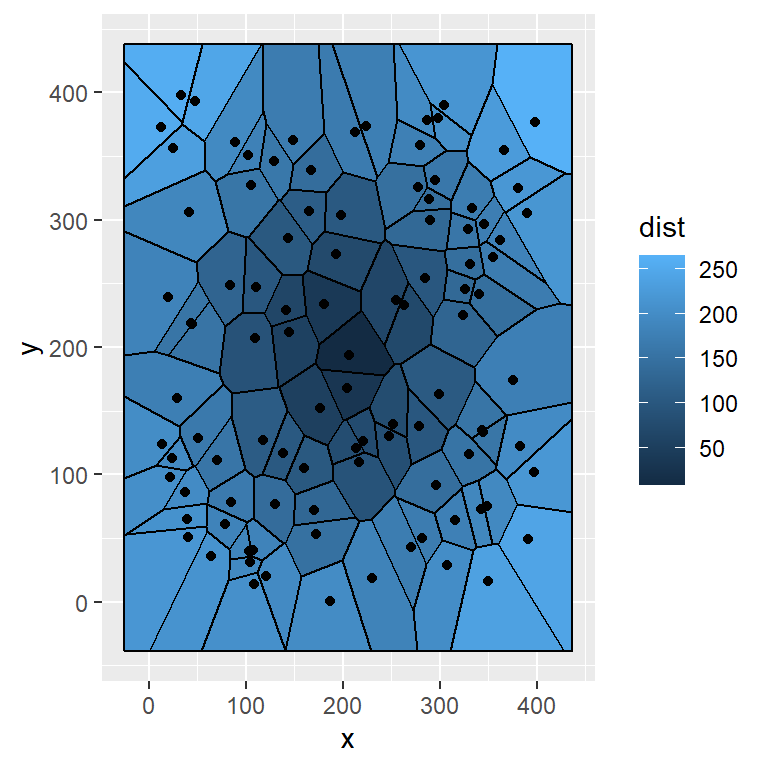
The path of the diagram can be added passing stat_voronoi(geom = "path").
# install.packages("ggvoronoi")
# install.packages("ggplot2")
library(ggvoronoi)
library(ggplot2)

ggplot(df, aes(x, y, fill = dist)) +
  geom_voronoi() +
  stat_voronoi(geom = "path") +
  geom_point()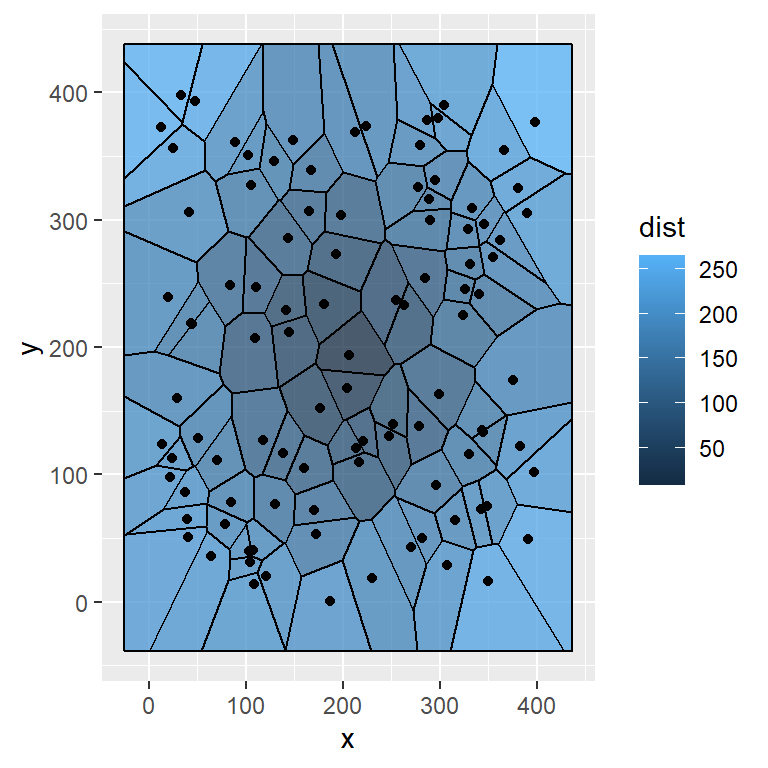
The transparency of the color can be set with the alpha argument of the geom_voronoi function.
# install.packages("ggvoronoi")
# install.packages("ggplot2")
library(ggvoronoi)
library(ggplot2)

ggplot(df, aes(x, y, fill = dist)) +
  geom_voronoi(alpha = 0.75) +
  stat_voronoi(geom = "path") +
  geom_point()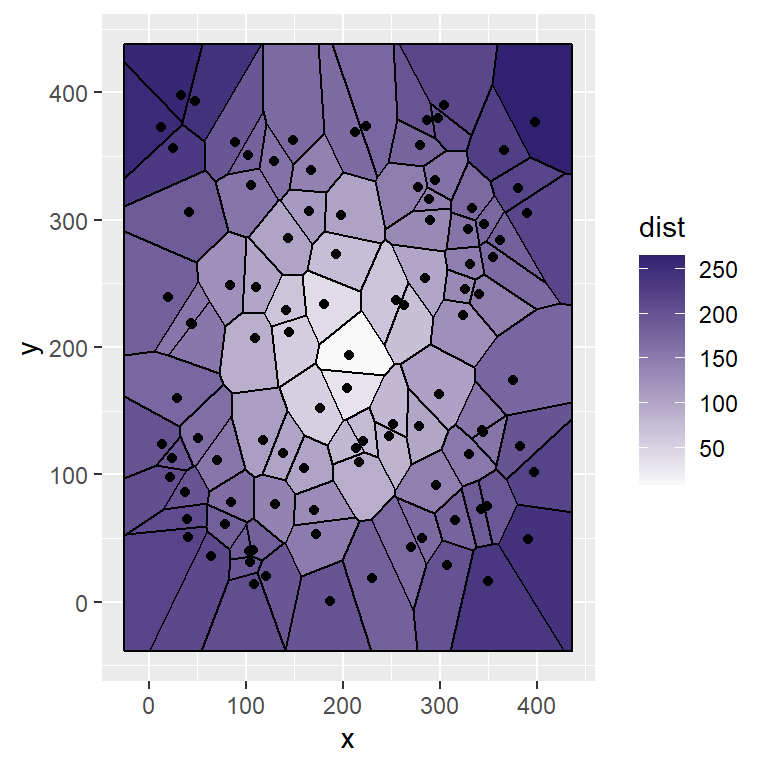
In addition, if you want to change the color for the heat map you can use scale_fill_gradient, setting a low and high color value as in the example below.
# install.packages("ggvoronoi")
# install.packages("ggplot2")
library(ggvoronoi)
library(ggplot2)

ggplot(df, aes(x, y, fill = dist)) +
  geom_voronoi() +
  stat_voronoi(geom = "path") +
  geom_point() +
  scale_fill_gradient(low = "#F9F9F9",
                      high = "#312271")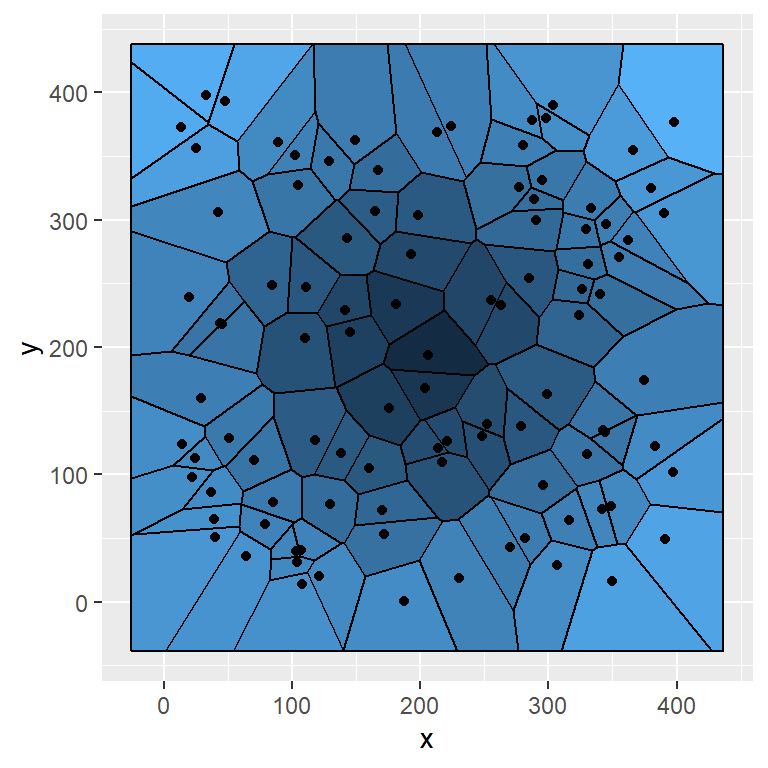
Note that if you want to remove the legend you can set legend.position = "none" inside the theme function. You can also set other positions.
# install.packages("ggvoronoi")
# install.packages("ggplot2")
library(ggvoronoi)
library(ggplot2)

ggplot(df, aes(x, y, fill = dist)) +
  geom_voronoi() +
  stat_voronoi(geom = "path") +
  geom_point() +
  theme(legend.position = "none")
Bounding box
You can set your own bounding box passing a data frame to the outline argument of the geom_voronoi function, being the first column the longitude, the second the latitude and the third a group column.
# install.packages("ggvoronoi")
# install.packages("ggplot2")
library(ggvoronoi)
library(ggplot2)

# Circle
s <- seq(0, 2 * pi, length.out = 3000)
circle <- data.frame(x = 120 * (1 + cos(s)),
                     y = 120 * (1 + sin(s)),
                     group = rep(1, 3000))

ggplot(df, aes(x, y, fill = dist)) +
  geom_voronoi(outline = circle,
               color = 1, size = 0.1) +
  scale_fill_gradient(low = "#B9DDF1",
                      high = "#2A5783",
                      guide = FALSE) +
  theme_void() +
  coord_fixed()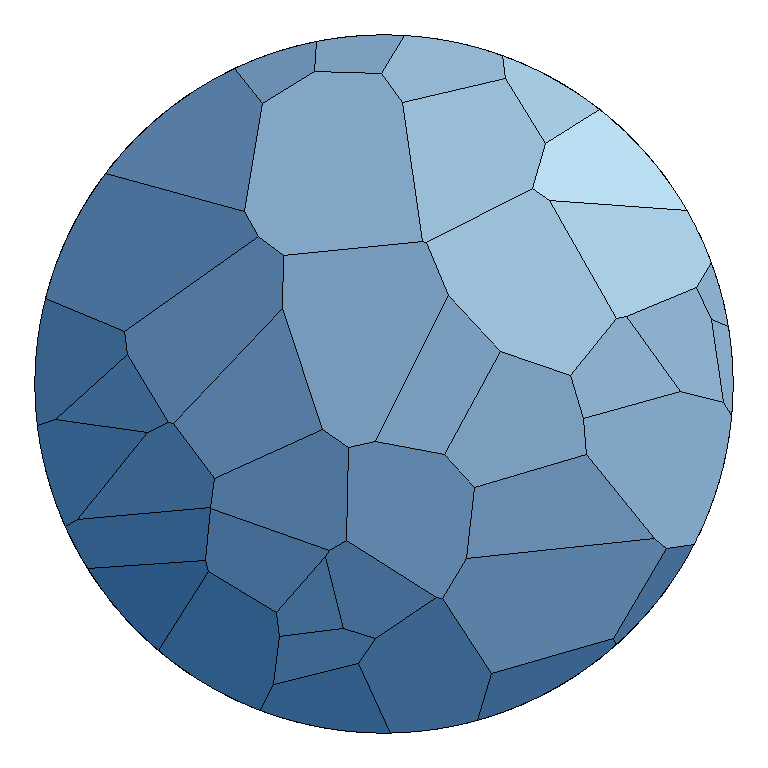

Master Statistics
Learn statistics from the basics to advanced techniques, clearly explained
Go to site