Sample data
The following data frame with three columns containing the group and the subgroup of different measures will be used in this tutorial.
group <- paste("Group", 1:9)
subgroup <- c("A", "C", "B", "A", "A",
              "C", "C", "B", "B")
value <- c(7, 25, 50, 5, 16,
           18, 30, 12, 41)

df <- data.frame(group, subgroup, value)
Basic treemaps with geom_treemap
Fill by the categorical variable
The treemapify package allows creating treemaps in ggplot2. You will need to specify the variables inside aes as follows and use geom_treemap.
# install.packages("treemapify")
library(treemapify)
# install.packages("ggplot2")
library(ggplot2)

ggplot(df, aes(area = value, fill = group)) +
  geom_treemap()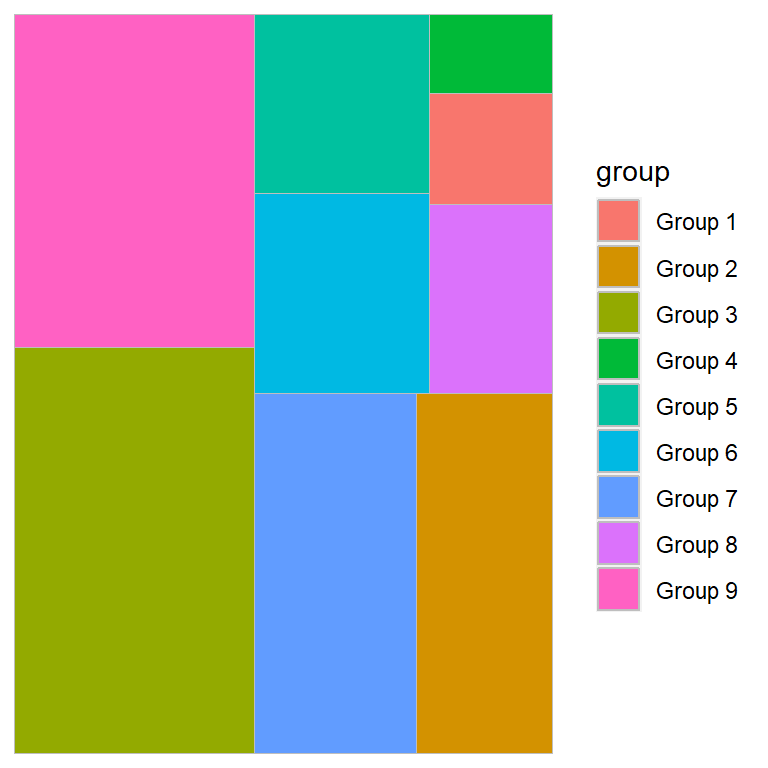
Fill by the numerical variable
Note that you can also fill the areas based on the numerical variable depending on what you are trying to represent.
# install.packages("treemapify")
library(treemapify)
# install.packages("ggplot2")
library(ggplot2)

ggplot(df, aes(area = value, fill = value)) +
  geom_treemap()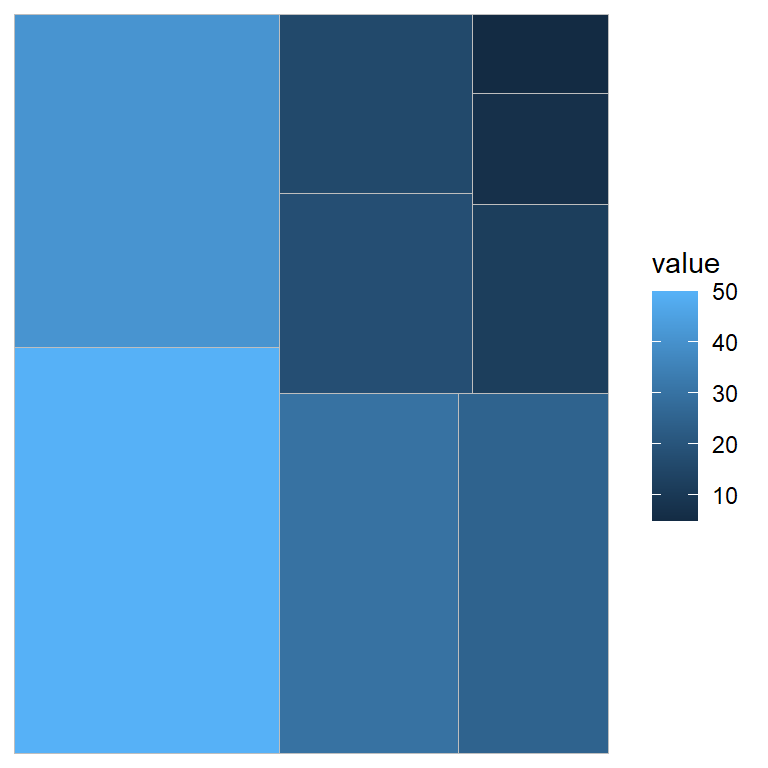
Adding labels to the tiles
Passing a variable to the label argument of aes and using geom_treemap_text you will be able to add labels to each tile of the treemap.
# install.packages("treemapify")
library(treemapify)
# install.packages("ggplot2")
library(ggplot2)
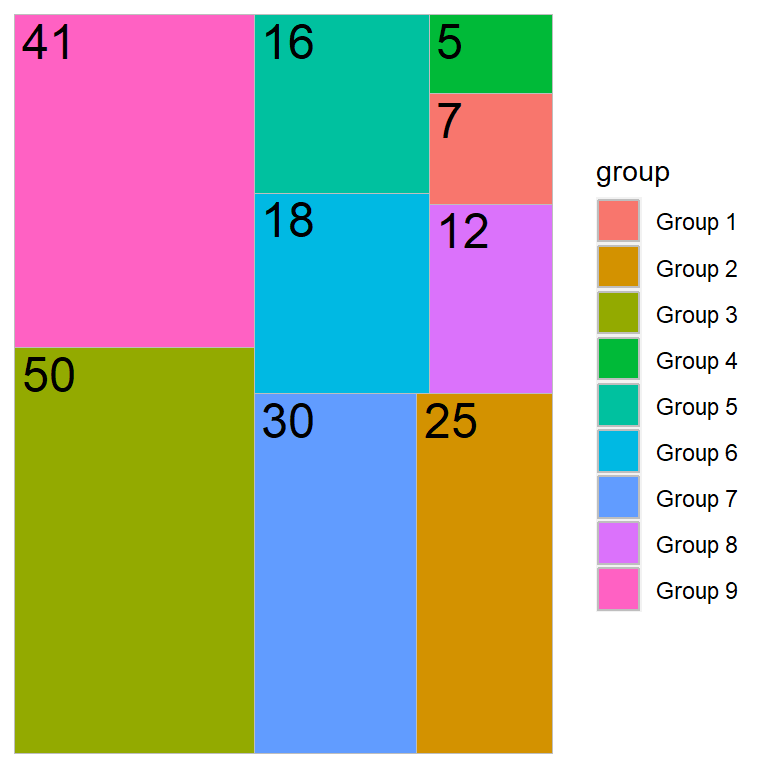
ggplot(df, aes(area = value, fill = group, label = value)) +
geom_treemap() +
geom_treemap_text()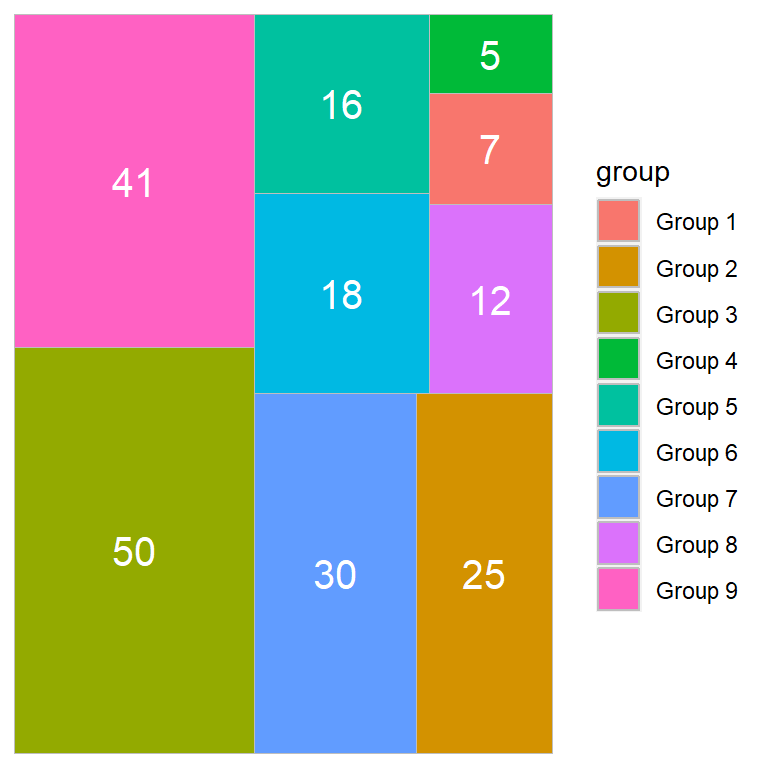
The labels can be customized with several arguments. Type ?geom_treemap_text for the full list.
# install.packages("treemapify")
library(treemapify)
# install.packages("ggplot2")
library(ggplot2)

ggplot(df, aes(area = value, fill = group, label = value)) +
  geom_treemap() +
  geom_treemap_text(colour = "white",
                    place = "centre",
                    size = 15)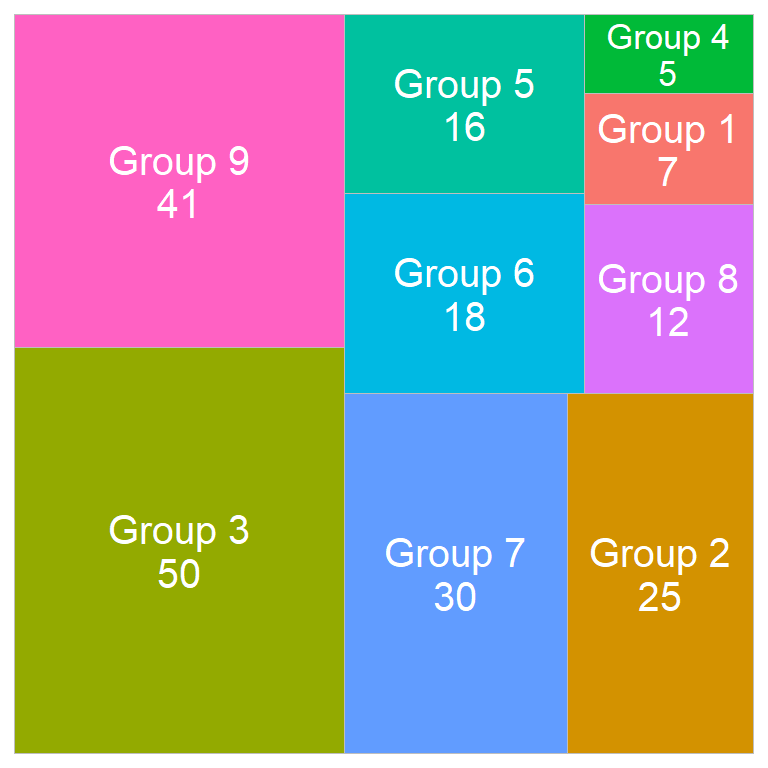
You can also add the labels and the groups at the same time and remove the legend if needed.
# install.packages("treemapify")
library(treemapify)
# install.packages("ggplot2")
library(ggplot2)

ggplot(df, aes(area = value, fill = group,
               label = paste(group, value, sep = "\n"))) +
  geom_treemap() +
  geom_treemap_text(colour = "white",
                    place = "centre",
                    size = 15) +
  theme(legend.position = "none")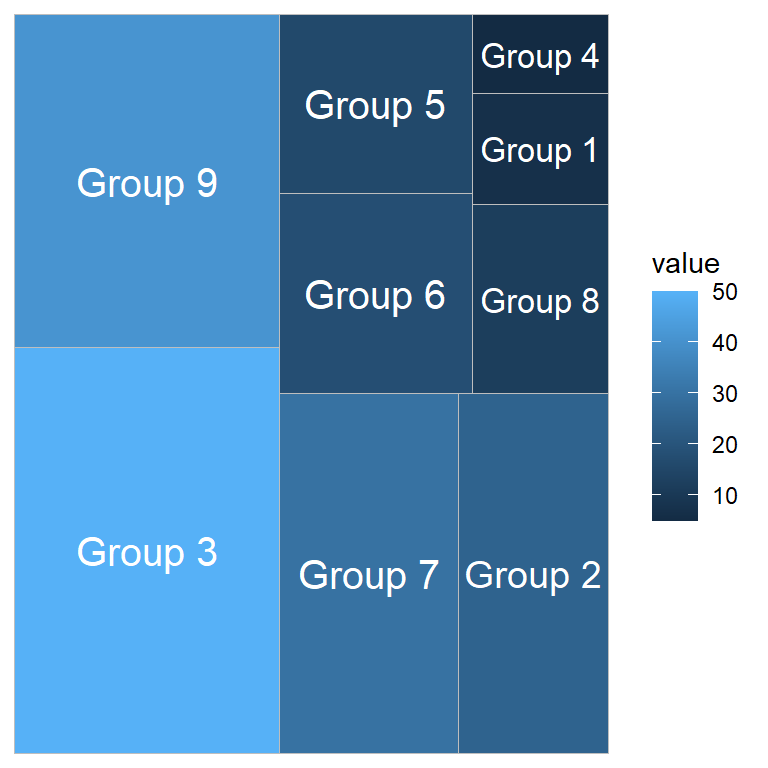
If you passed the numerical variable to fill you can pass the groups to label.
# install.packages("treemapify")
library(treemapify)
# install.packages("ggplot2")
library(ggplot2)

ggplot(df, aes(area = value, fill = value, label = group)) +
  geom_treemap() +
  geom_treemap_text(colour = "white",
                    place = "centre",
                    size = 15)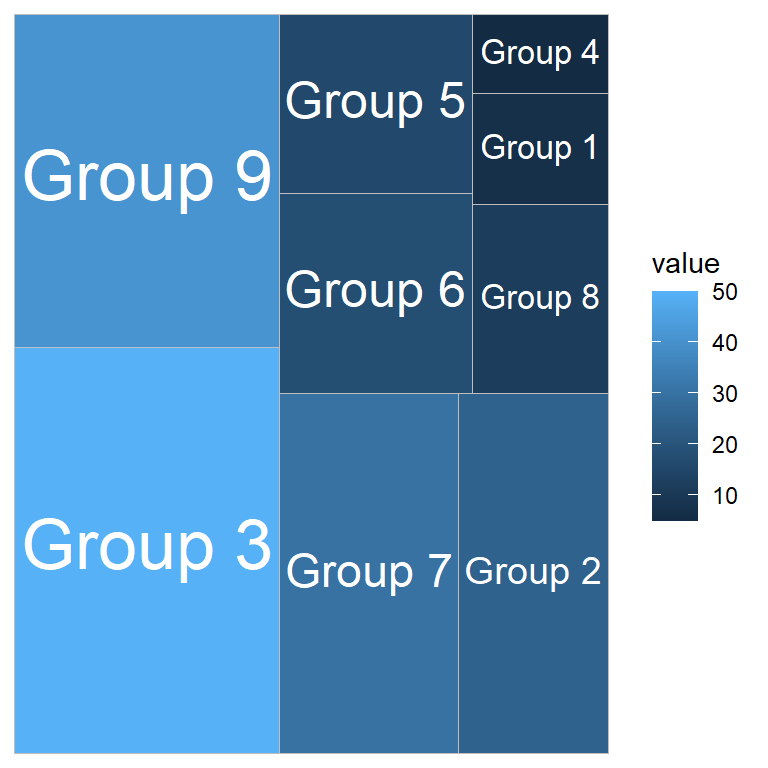
Note that there is a logical argument named grow that can be set to TRUE to fit the text to the tiles.
# install.packages("treemapify")
library(treemapify)
# install.packages("ggplot2")
library(ggplot2)

ggplot(df, aes(area = value, fill = value, label = group)) +
  geom_treemap() +
  geom_treemap_text(colour = "white",
                    place = "centre",
                    size = 15,
                    grow = TRUE)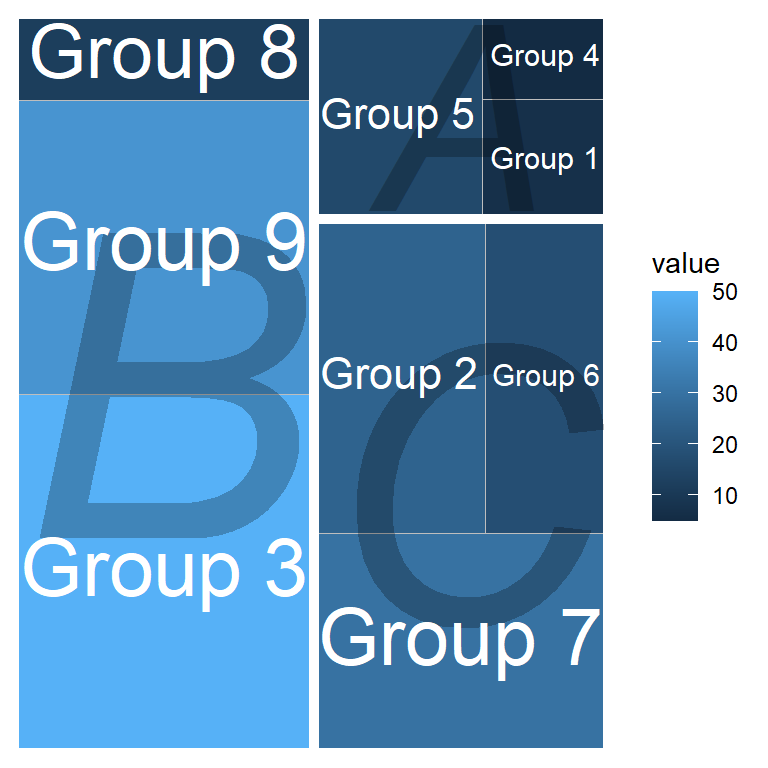
Adding subgroup labels
If your data set contains a column representing subgroups you can add them to the plot with subgroup and geom_treemap_subgroup_text. The border of the subgroups can be modified with geom_treemap_subgroup_border.
# install.packages("treemapify")
library(treemapify)
# install.packages("ggplot2")
library(ggplot2)

ggplot(df, aes(area = value, fill = value,
               label = group, subgroup = subgroup)) +
  geom_treemap() +
  geom_treemap_subgroup_border(colour = "white", size = 5) +
  geom_treemap_subgroup_text(place = "centre", grow = TRUE,
                             alpha = 0.25, colour = "black",
                             fontface = "italic") +
  geom_treemap_text(colour = "white", place = "centre",
                    size = 15, grow = TRUE)
You can add up to three subgroups with subgroup2, geom_treemap_subgroup2_border and geom_treemap_subgroup2_text and subgroup3, geom_treemap_subgroup3_border and geom_treemap_subgroup3_text.
Color customization
The colors of the treemap can be customized with a color scale. The choice will depend on the data you pass to fill (continuous or discrete). You can check a couple of examples below.
Continuous
# install.packages("treemapify")
library(treemapify)
# install.packages("ggplot2")
library(ggplot2)

ggplot(df, aes(area = value, fill = value, label = group)) +
  geom_treemap() +
  geom_treemap_text(colour = c(rep("white", 2),
                               1, rep("white", 6)),
                    place = "centre", size = 15) +
  scale_fill_viridis_c()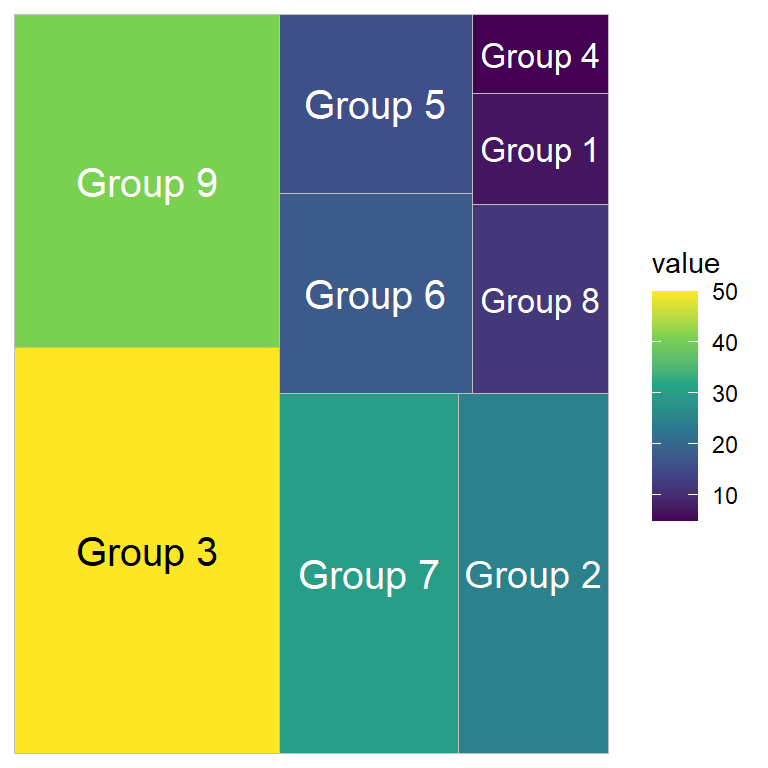
Discrete
# install.packages("treemapify")
library(treemapify)
# install.packages("ggplot2")
library(ggplot2)

ggplot(df, aes(area = value, fill = group, label = value)) +
  geom_treemap() +
  geom_treemap_text(colour = "white",
                    place = "centre",
                    size = 15) +
  scale_fill_brewer(palette = "Blues")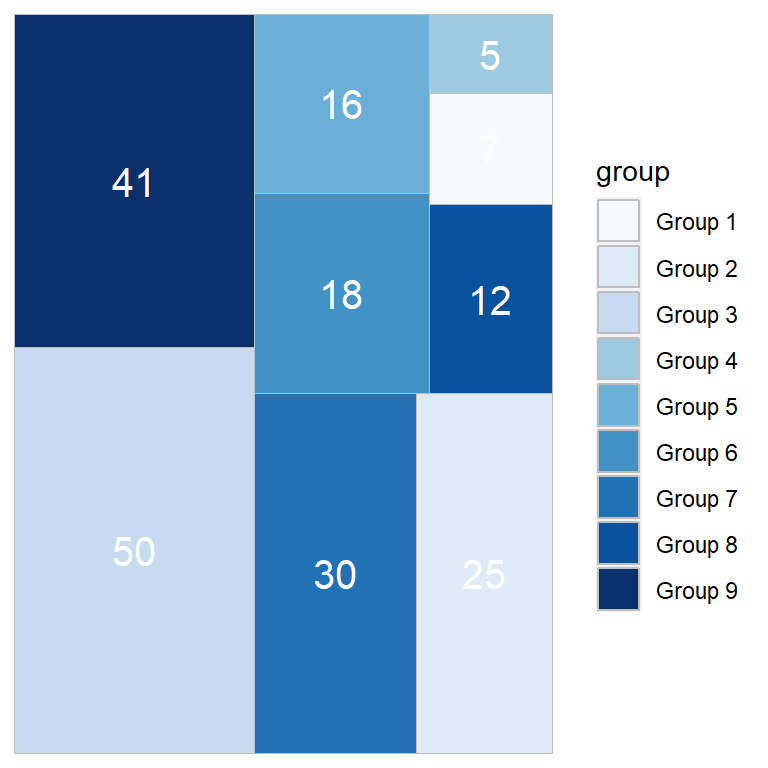

Master Statistics
Learn statistics from the basics to advanced techniques, clearly explained
Go to site