Basic 3D pie chart
3D pie charts are not recommended, but if you really want to create them you can use pie3D from plotrix package. The default 3D pie chart will look like the following.
# install.packages("plotrix")
library(plotrix)

data <- c(19, 21, 54, 12, 36, 12)

pie3D(data)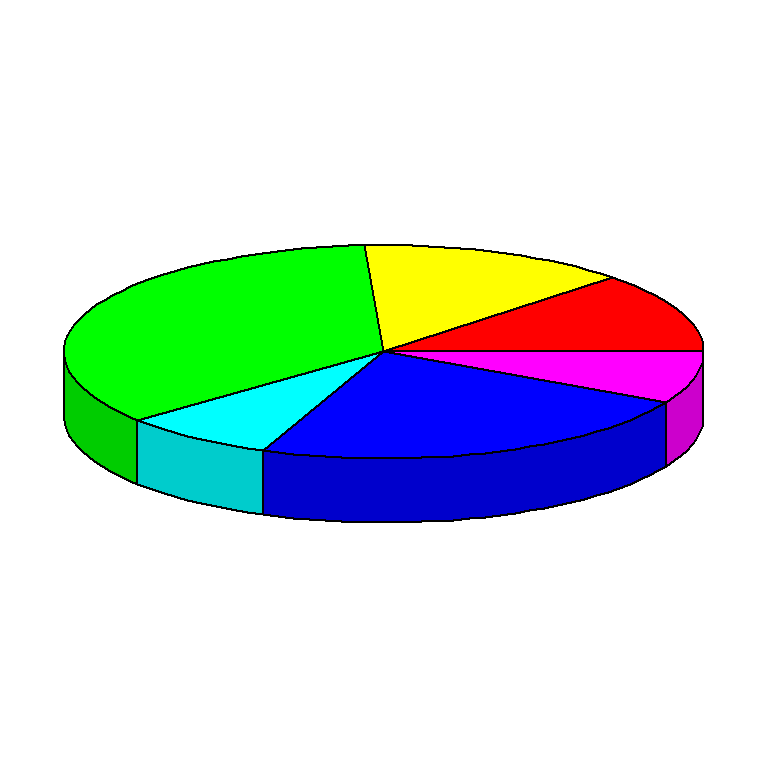
Radius (width)
The radius argument allows modifying the radius of the pie in user units. Default value is 1.
# install.packages("plotrix")
library(plotrix)

data <- c(19, 21, 54, 12, 36, 12)

pie3D(data,
      radius = 0.75)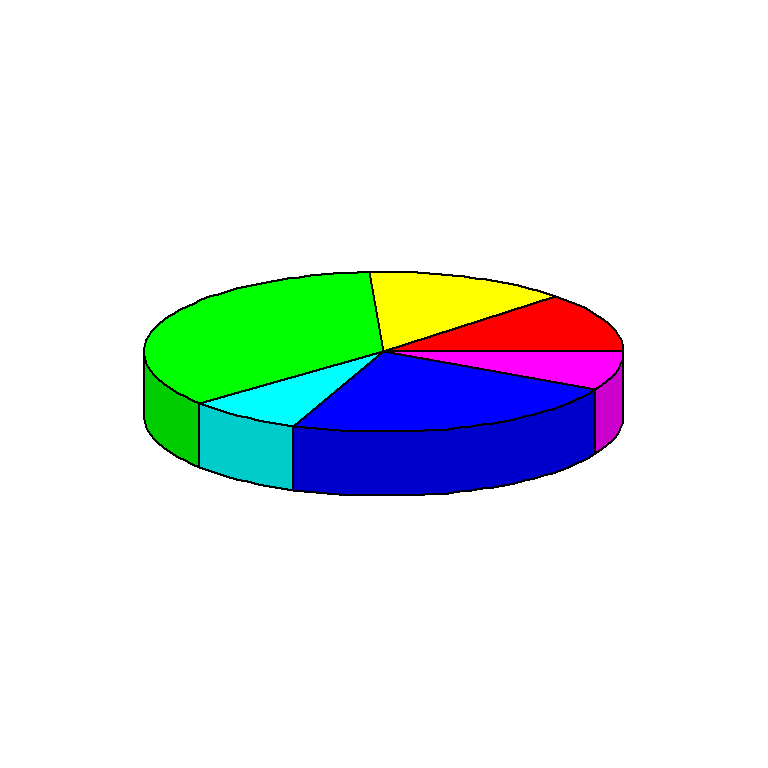
Height
Similarly, you can change the height of the pie with height. Default value is 0.1
# install.packages("plotrix")
library(plotrix)

data <- c(19, 21, 54, 12, 36, 12)

pie3D(data,
      height = 0.2)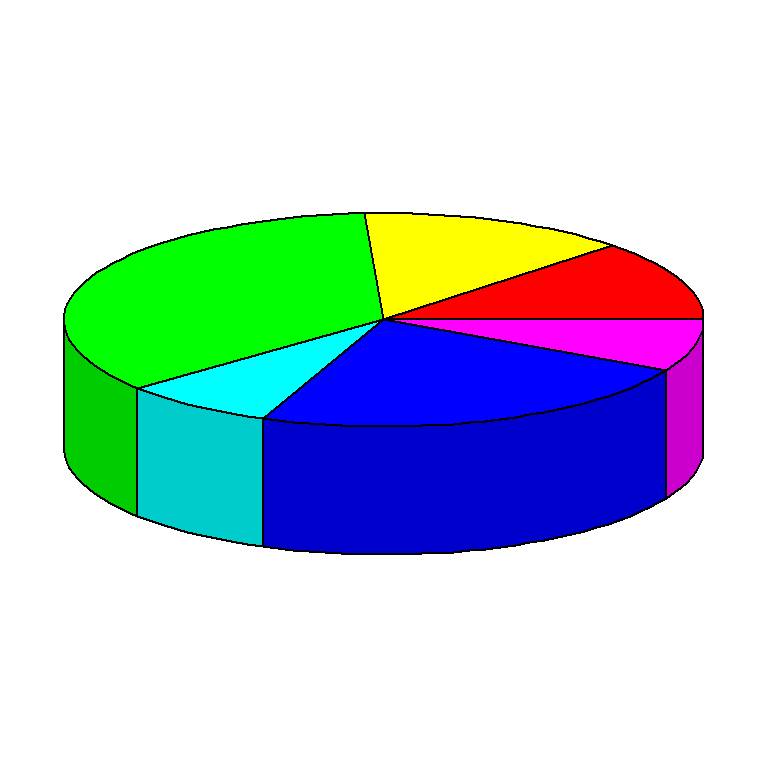
Angle
You can also change the viewing angle with theta. Default value is pi/6.
# install.packages("plotrix")
library(plotrix)

data <- c(19, 21, 54, 12, 36, 12)

pie3D(data,
      theta = 1.5)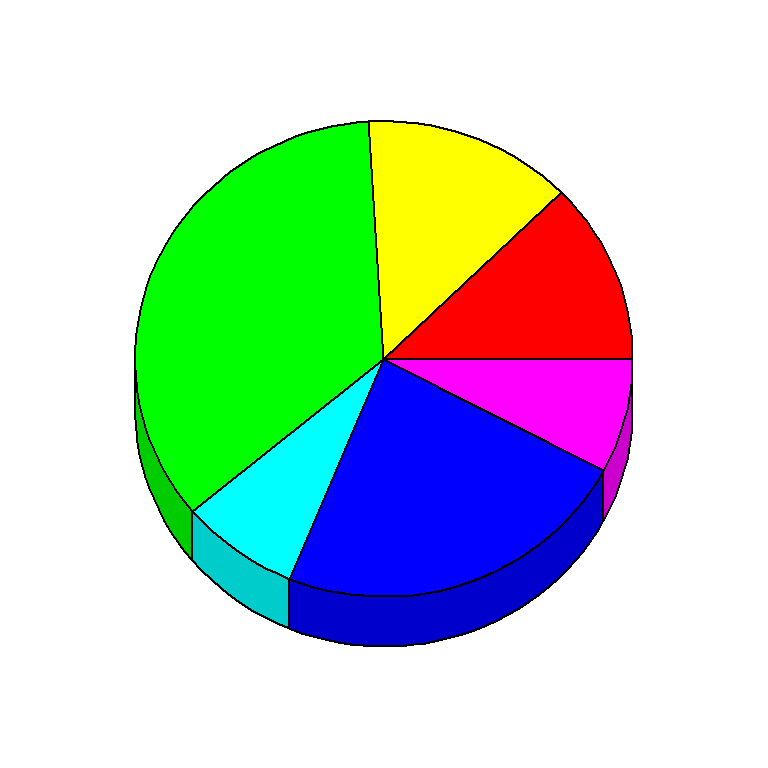
pie3D color

The color of the pie slices can be customized with col. In the following examples we are using the "Spectral" palette, generating as many colors as slices.
# install.packages("plotrix")
library(plotrix)

data <- c(19, 21, 54, 12, 36, 12)

pie3D(data,
      col = hcl.colors(length(data), "Spectral"))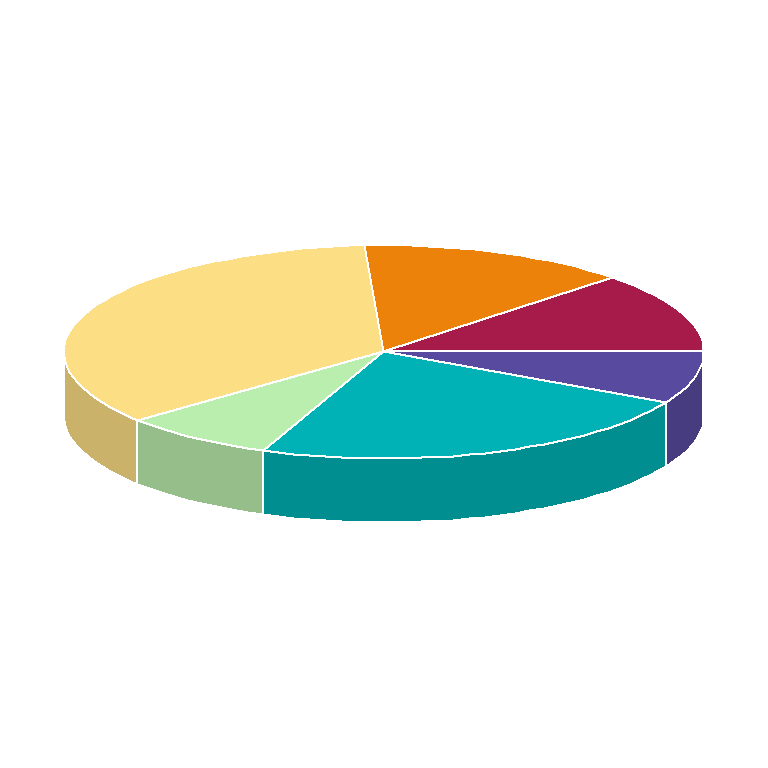
The border color can also be customized with border argument. In the following block of code we are setting a white border.
# install.packages("plotrix")
library(plotrix)

data <- c(19, 21, 54, 12, 36, 12)

pie3D(data,
      col = hcl.colors(length(data), "Spectral"),
      border = "white")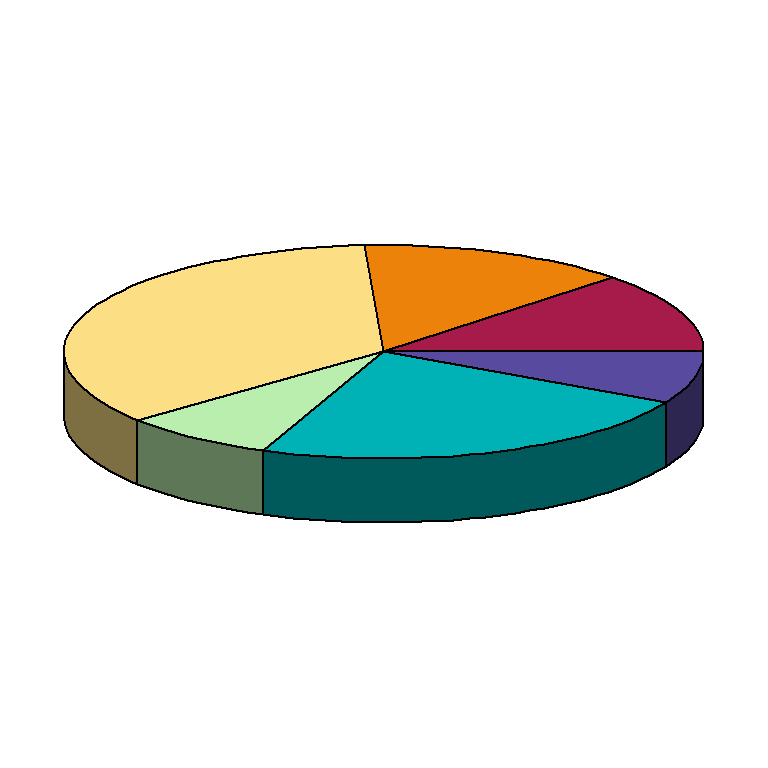
Finally, you can change the shade of the border of the pie, in order to modify the 3D effect. This will darker or lighter the corresponding colors.
# install.packages("plotrix")
library(plotrix)

data <- c(19, 21, 54, 12, 36, 12)

pie3D(data,
      col = hcl.colors(length(data), "Spectral"),
      shade = 0.5)
pie3D labels
You can add labels to the pie representing the value, label or percentage for each slice passing a vector of the same size as the number of slices to labels argument.
# install.packages("plotrix")
library(plotrix)

data <- c(19, 21, 54, 12, 36, 12)

pie3D(data,
      col = hcl.colors(length(data), "Spectral"),
      labels = data)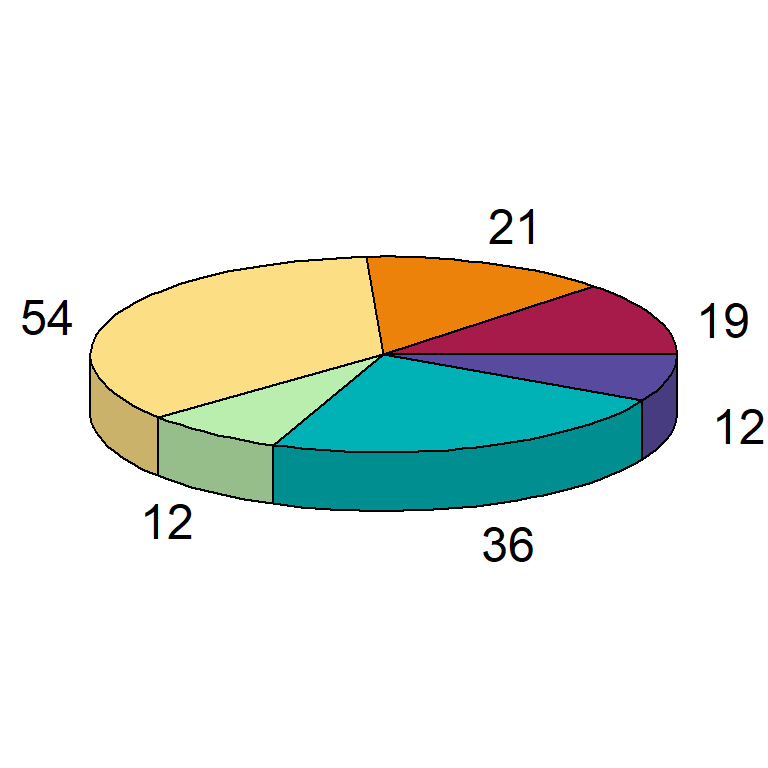
If you have a numeric vector that doesn’t represent percentages consider transforming the data into percentage as in this example.
# install.packages("plotrix")
library(plotrix)

data <- c(19, 21, 54, 12, 36, 12)
lab <- paste0(round(data/sum(data) * 100, 2), "%")

pie3D(data,
      col = hcl.colors(length(data), "Spectral"),
      labels = lab)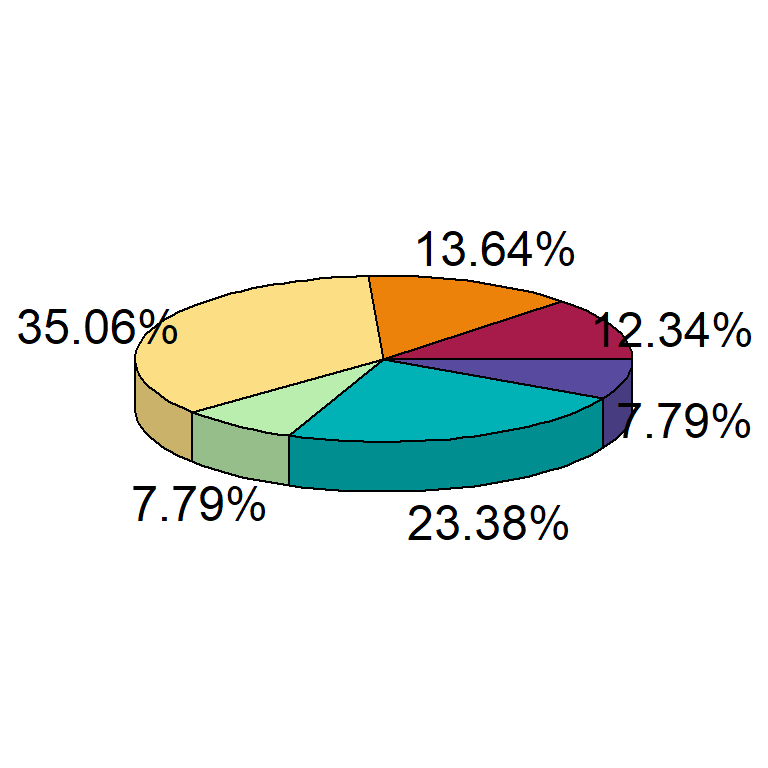
The color and size of the labels can be customized with labelcol and labelcex arguments. The latter defaults to 1.5.
# install.packages("plotrix")
library(plotrix)

data <- c(19, 21, 54, 12, 36, 12)

pie3D(data,
      col = hcl.colors(length(data), "Spectral"),
      labels = data,
      labelcol = "red",
      labelcex = 0.75)
Explode pie
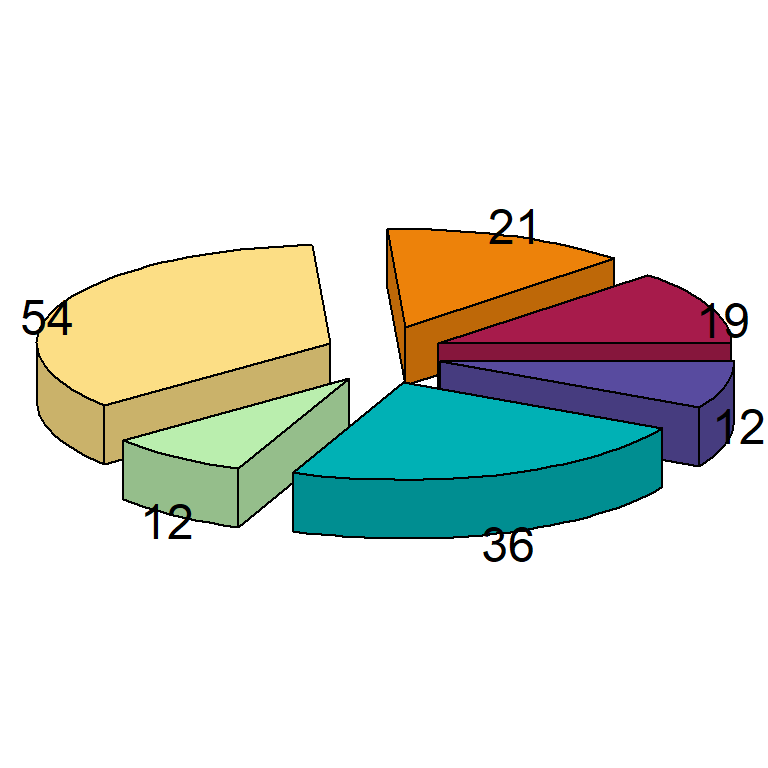
You can also “explode” the pie with explode.
# install.packages("plotrix")
library(plotrix)

data <- c(19, 21, 54, 12, 36, 12)

pie3D(data, mar = rep(1.75, 4),
      col = hcl.colors(length(data), "Spectral"),
      labels = data,
      explode = 0.2)
Master Statistics
Learn statistics from the basics to advanced techniques, clearly explained
Go to site