Sample data
The following data represents the answers to the question: “How many hours a day do you spend watching TV?”. The variable x represents the age of the person, y represents their answer and group represents their city. This toy data will be used in the examples below.
# Data
set.seed(1)

age <- factor(sample(c("Child", "Adult", "Retired"),
              size = 50, replace = TRUE),
              levels = c("Child", "Adult", "Retired"))
hours <- sample(1:4, size = 50, replace = TRUE)
city <- sample(c("A", "B", "C"),
               size = 50, replace = TRUE)

df <- data.frame(x = age, y = hours, group = city)
Basic stacked bar graph with geom_bar
stat = “count” (default)
If you use geom_bar with the default arguments you will need to pass only x or y to the aes in addition to the fill. The bar plot will display the stacked sum for each group of the variable.
# install.packages("ggplot2")
library(ggplot2)

ggplot(df, aes(x = x, fill = group)) +
  geom_bar()
stat = “identity”
Setting stat = "identity" you can create a stacked bar plot for multiple variables. In this scenario you can pass other variable to aes, representing the value or count of that variable.
# install.packages("ggplot2")
library(ggplot2)

ggplot(df, aes(x = x, y = y, fill = group)) +
  geom_bar(stat = "identity")
Bar fill and border colors

Predefined palette
You can change the colors of the stacked bars with a predefined color palette, such as the ones provided by scale_fill_brewer.
# install.packages("ggplot2")
library(ggplot2)

ggplot(df, aes(x = x, y = y, fill = group)) +
  geom_bar(stat = "identity") +
  scale_fill_brewer()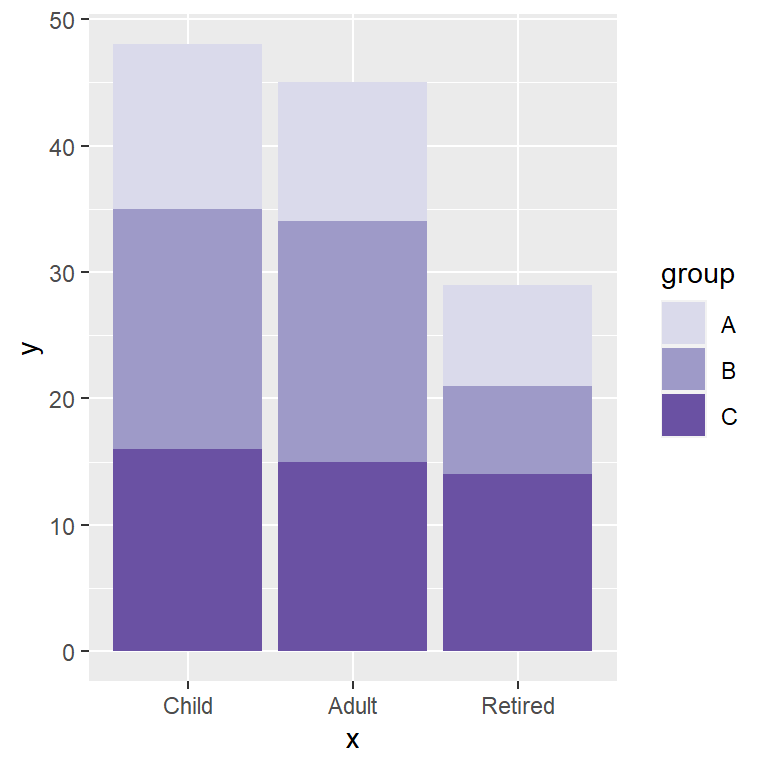
Custom colors
If you prefer choossing each of the colors you can use scale_fill_manual and pass the vector of colors to the values argument.
# install.packages("ggplot2")
library(ggplot2)

ggplot(df, aes(x = x, y = y, fill = group)) +
  geom_bar(stat = "identity") +
  scale_fill_manual(values = c("#DADAEB", "#9E9AC8", "#6A51A3"))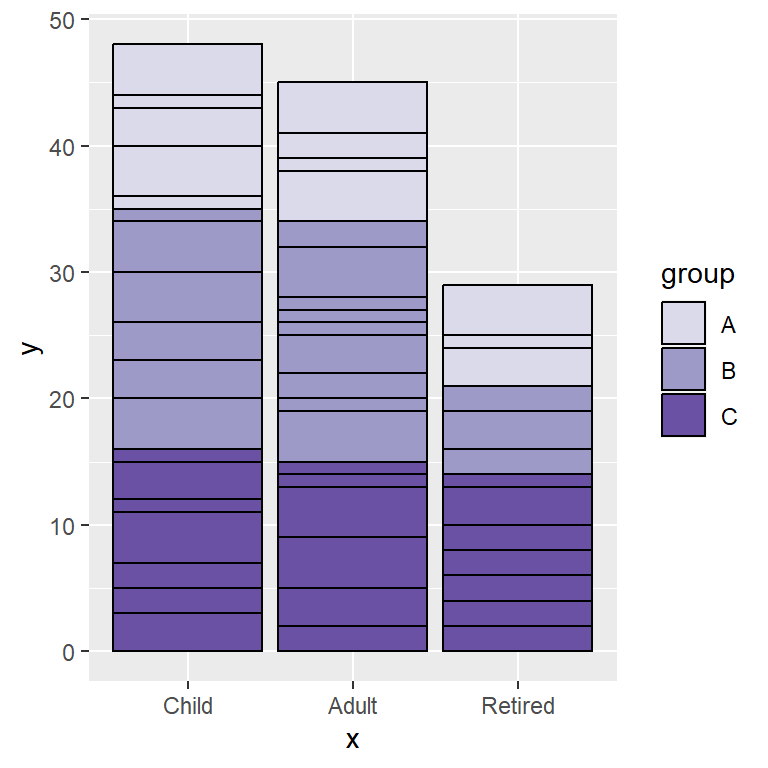
Border color (stat = “identity”)
In case you are creating a bar graph with stat = "identity" you can add a border color passing a color to the color argument of geom_bar, but the border will outline all the bars representing the y variable.
# install.packages("ggplot2")
library(ggplot2)

ggplot(df, aes(x = x, y = y, fill = group)) +
  geom_bar(stat = "identity", color = "black") +
  scale_fill_manual(values = c("#DADAEB", "#9E9AC8", "#6A51A3"))
Border color (stat = “count”)
If you create a stacked bar chart based on one variable the border will be placed around each bar, as there is no other variable involved.
# install.packages("ggplot2")
library(ggplot2)

ggplot(df, aes(x = x, fill = group)) +
  geom_bar(color = "black") +
  scale_fill_manual(values = c("#DADAEB", "#9E9AC8", "#6A51A3"))
Legend customization
Legend title
The default legend title of the bar chart corresponds to the name of the variable passed to fill and can be overridden with the code below.
# install.packages("ggplot2")
library(ggplot2)

ggplot(df, aes(x = x, y = y, fill = group)) +
  geom_bar(stat = "identity") +
  guides(fill = guide_legend(title = "Title"))
Legend key labels
The key legend labels are the names of the categorical variable passed to fill. If you need to change these values you can use the labels argument of sacale_fill_discrete or scale_fill_manual if you are changing the fill colors.
# install.packages("ggplot2")
library(ggplot2)

ggplot(df, aes(x = x, y = y, fill = group)) +
  geom_bar(stat = "identity") +
  scale_fill_discrete(labels = c("G1", "G2", "G3"))
Remove the legend
The legend can be removed setting the legend.position component of the theme function to "none". Note that you can also change the position of the legend with this component.
# install.packages("ggplot2")
library(ggplot2)

ggplot(df, aes(x = x, y = y, fill = group)) +
  geom_bar(stat = "identity") +
  theme(legend.position = "none")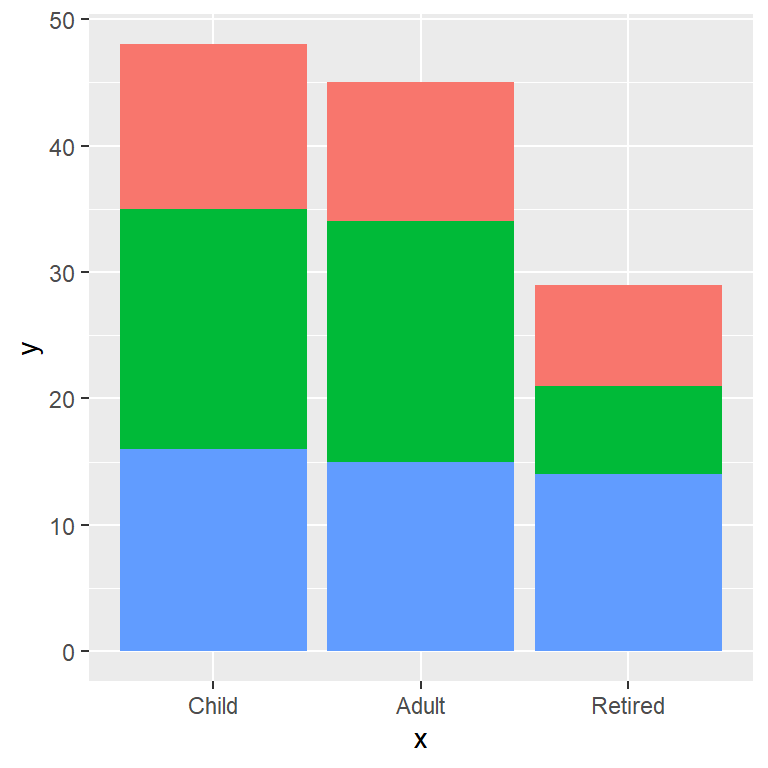

Master Statistics
Learn statistics from the basics to advanced techniques, clearly explained
Go to site