Sample data
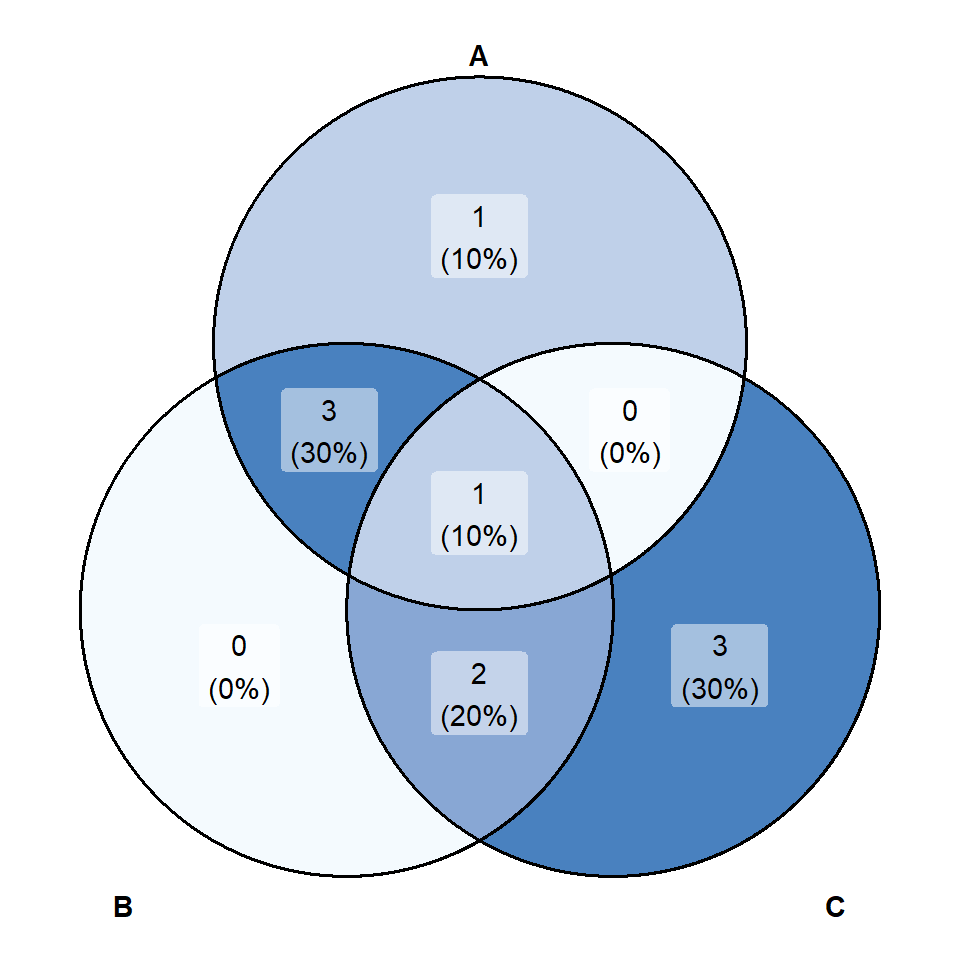
An UpSet plot visualizes intersections between sets, a scalable alternative to Venn diagrams when comparing more than three sets. The data must be a binary matrix where each column is a set and each row is an element (1 = member, 0 = not member).
set.seed(42)
n <- 300
genres_df <- data.frame(
  Action      = sample(0:1, n, TRUE, prob = c(0.6, 0.4)),
  Comedy      = sample(0:1, n, TRUE, prob = c(0.5, 0.5)),
  Drama       = sample(0:1, n, TRUE, prob = c(0.4, 0.6)),
  Romance     = sample(0:1, n, TRUE, prob = c(0.7, 0.3)),
  Thriller    = sample(0:1, n, TRUE, prob = c(0.65, 0.35)),
  Documentary = sample(0:1, n, TRUE, prob = c(0.8, 0.2))
)
upset()
Pass the binary data frame to upset(). The horizontal bars on the left show each set size; the vertical bars show each intersection size. Connected dots in the matrix indicate which sets form each intersection.
# install.packages("UpSetR")
library(UpSetR)

upset(genres_df)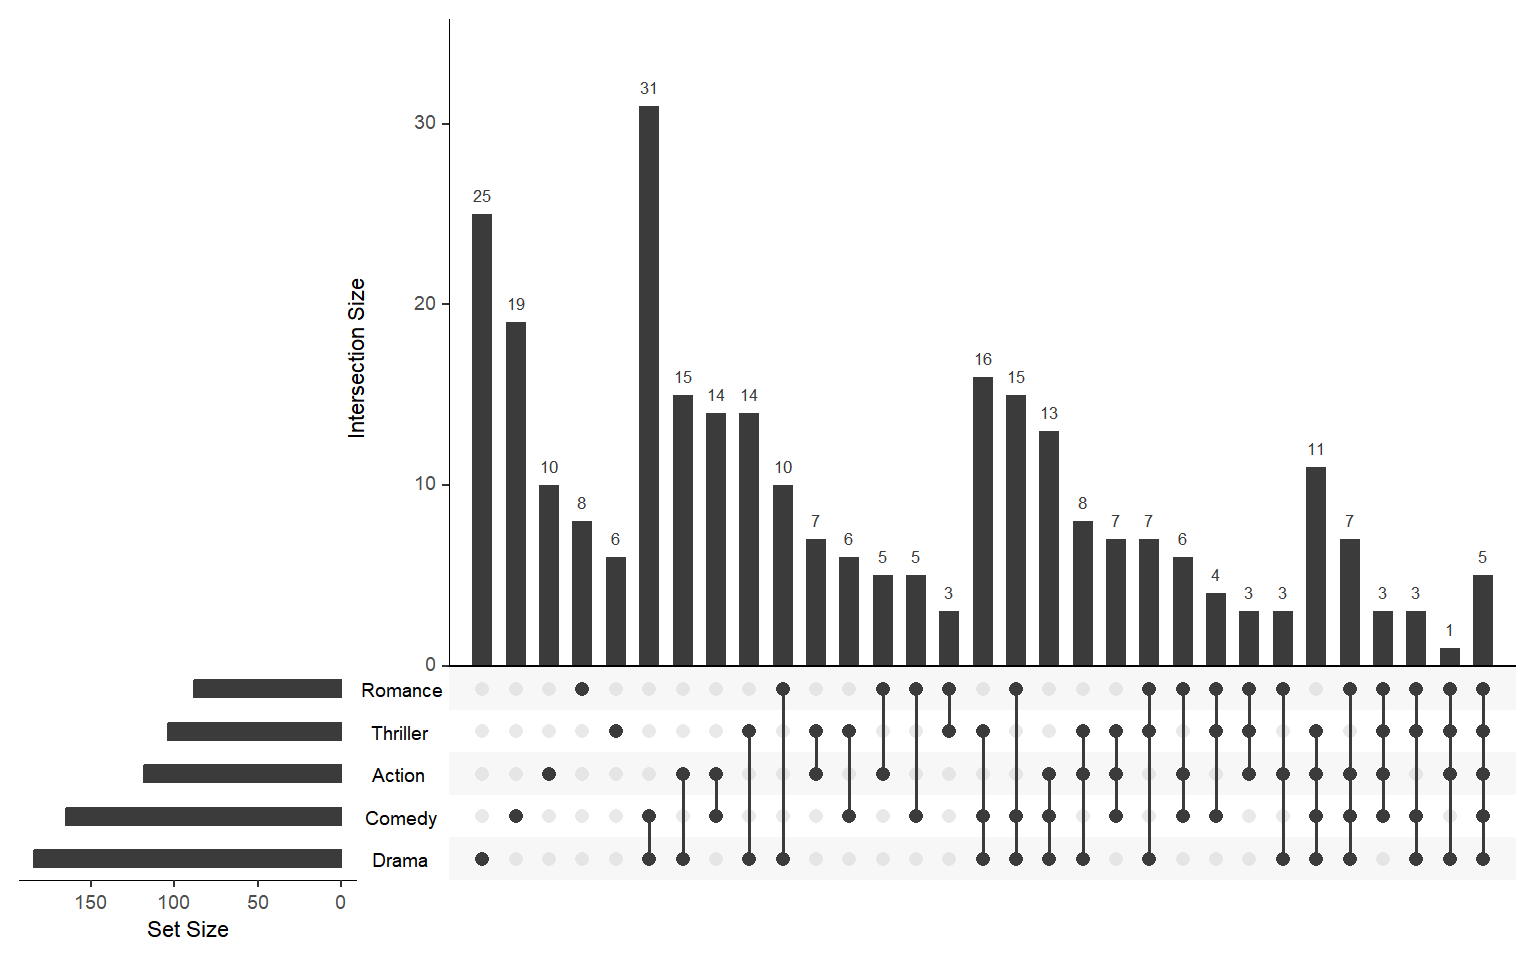
nsets and nintersects
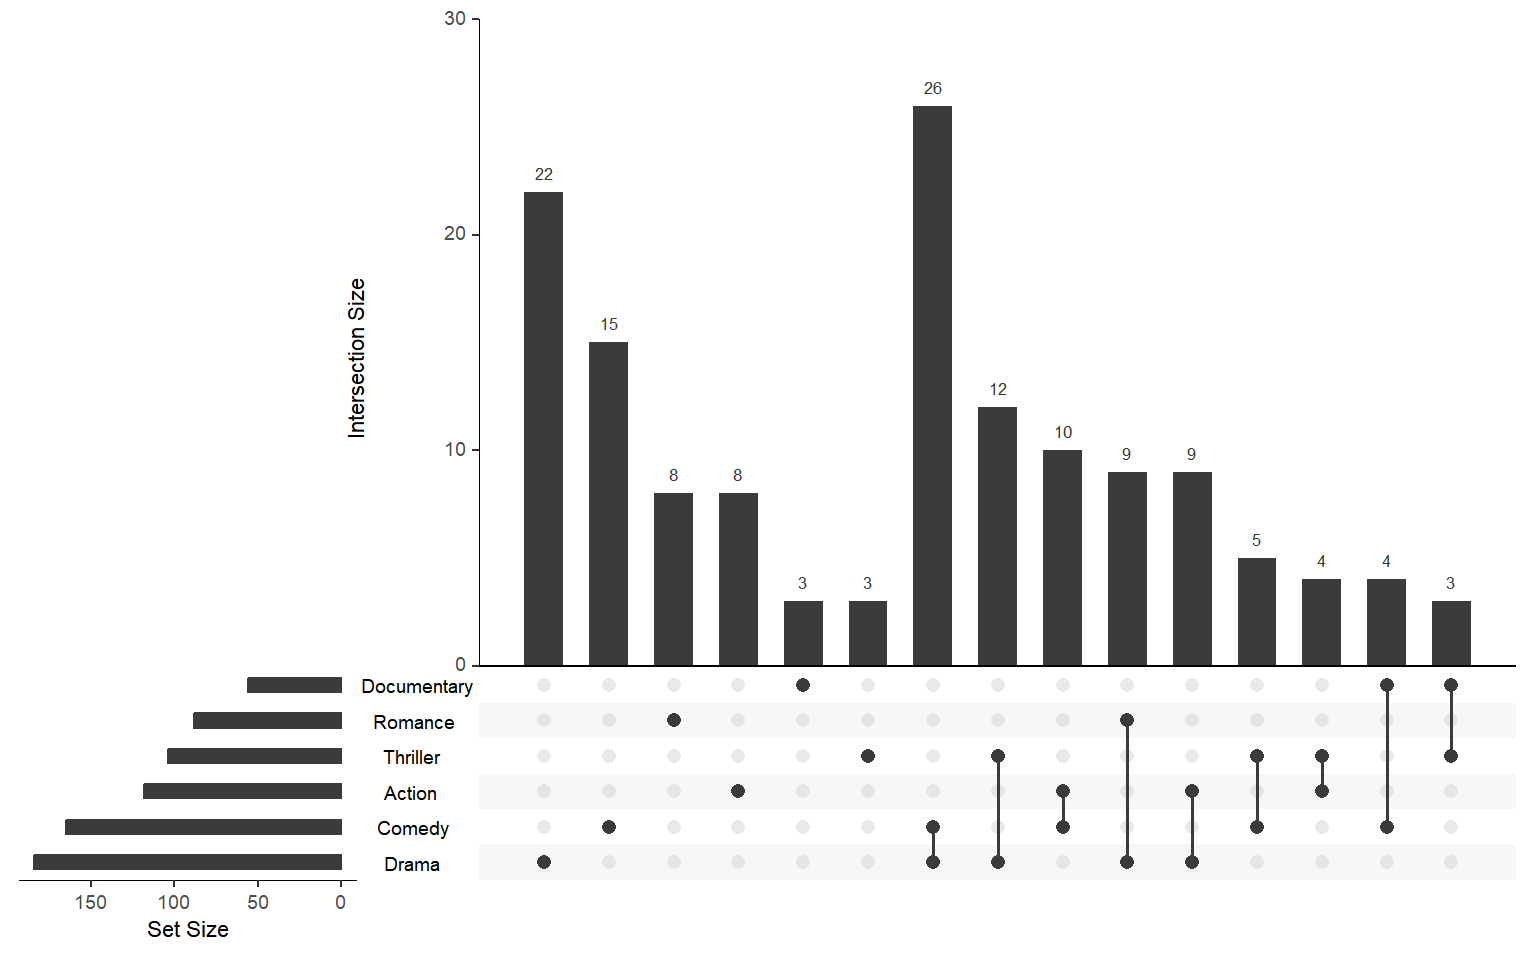
nsets controls how many sets appear in the plot (the largest by default). nintersects limits how many intersections are shown in the bar chart. Increase both to show a more complete picture.
# install.packages("UpSetR")
library(UpSetR)

upset(genres_df,
      nsets       = 6,
      nintersects = 15)
order.by
By default intersections are sorted by frequency ("freq"). Use order.by = "degree" to sort by the number of sets in each intersection instead, useful for spotting exclusive memberships and pairwise overlaps first.
# install.packages("UpSetR")
library(UpSetR)

upset(genres_df,
      order.by = "degree")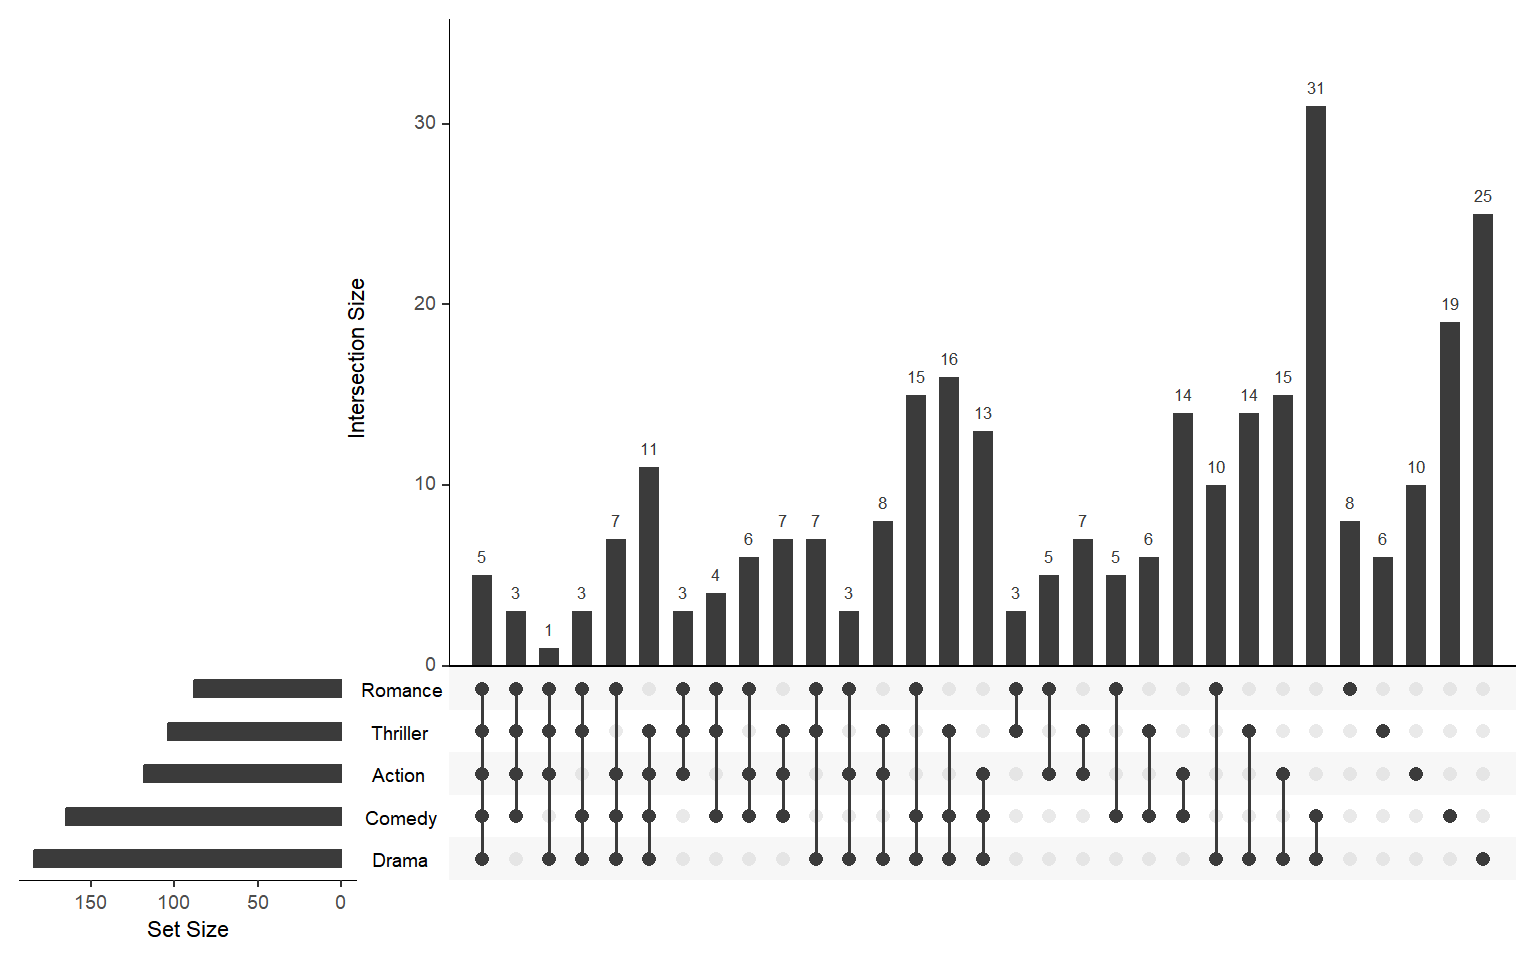
Colors
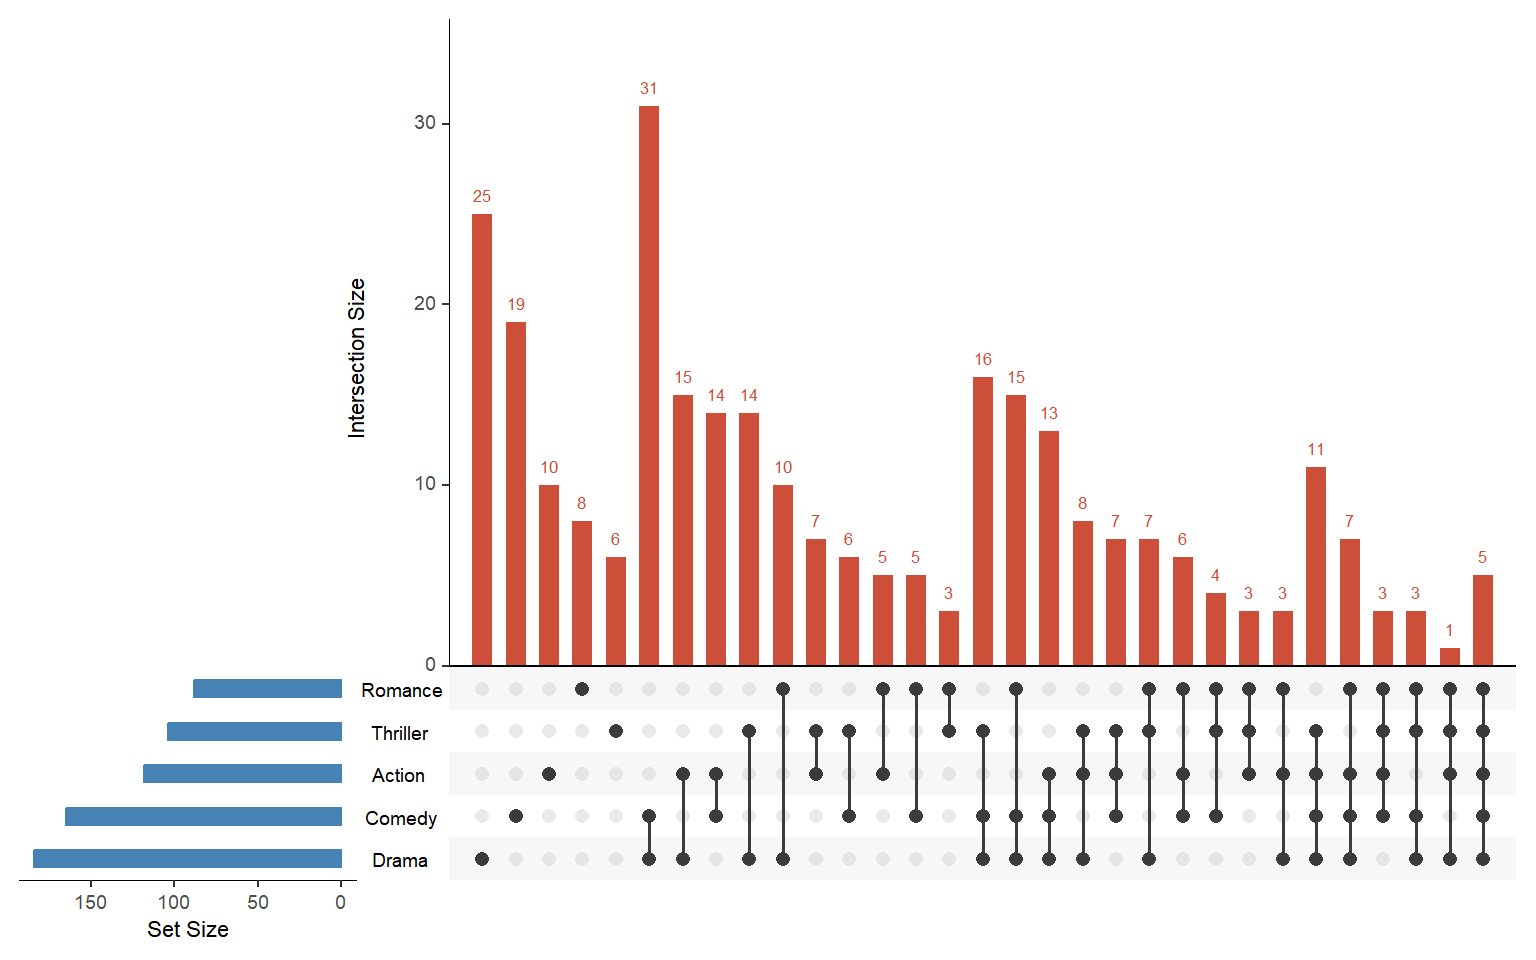
Use sets.bar.color to change the color of the set-size bars (left panel) and main.bar.color for the intersection-size bars (top panel). matrix.color controls the dot color in the matrix.
# install.packages("UpSetR")
library(UpSetR)

upset(genres_df,
      sets.bar.color = "steelblue",
      main.bar.color = "tomato3")
Queries
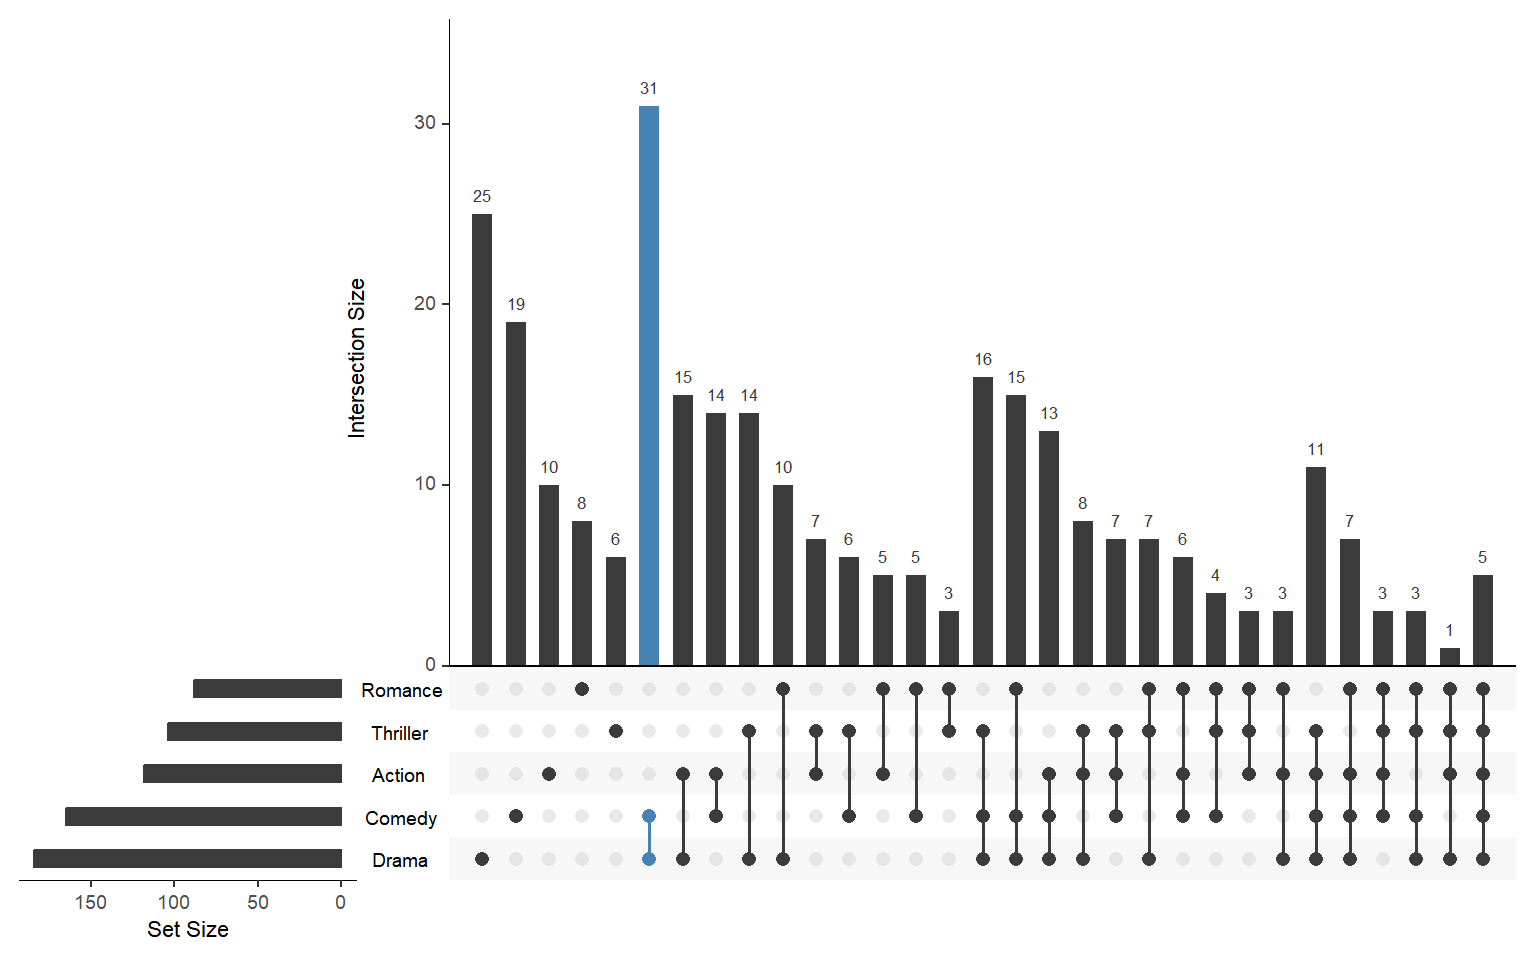
Use queries to highlight a specific intersection. Set query = intersects, pass the set names in params, choose a color, and set active = TRUE to fill the bar instead of just adding an outline.
# install.packages("UpSetR")
library(UpSetR)

upset(genres_df,
      queries = list(
        list(query  = intersects,
             params = list("Drama", "Comedy"),
             color  = "steelblue",
             active = TRUE)
      ))

Master Statistics
Learn statistics from the basics to advanced techniques, clearly explained
Go to site