The geom_text and geom_label functions allows adding text or labels, respectively, to plots created with ggplot2. You can add some annotations to some coordinates or label data points.
# install.packages("ggplot2")
library(ggplot2)

# install.packages("maps")
library(maps)

df <- data.frame(x = state.center$x, y = state.center$y,
                 state = state.name)

p <- ggplot(df, aes(x = x, y = y)) +
       geom_polygon(data = map_data("state"),
                    color = "white",
                    aes(x = long, y = lat,
                        fill = map_data("state")$region,
                        group = group)) +
       guides(fill = FALSE)
p
In this guide we are going to use the following example plot.

Adding text with geom_text

Adding text annotations
p +
  geom_text(aes(x = -115, y = 25,
                label = "Map of the United States"),
            stat = "unique")
Set stat = "unique", otherwise the label will be redrawn for each data point on your data frame.

Customizing the annotations
There are several arguments that you can customize, such as the color or the size of the text.
p +
  geom_text(aes(x = -115, y = 25,
                label = "Map of the United States"),
            stat = "unique",
            size = 5, color = "red")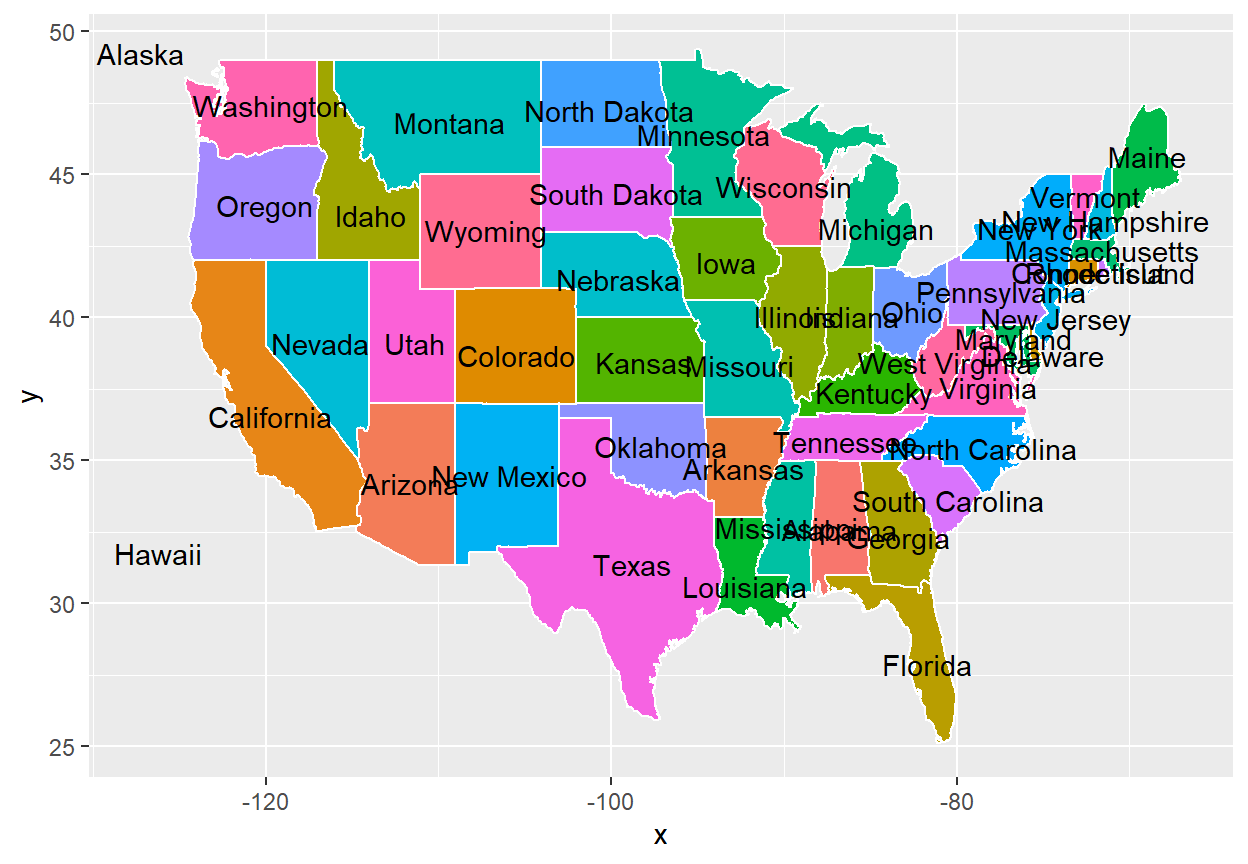
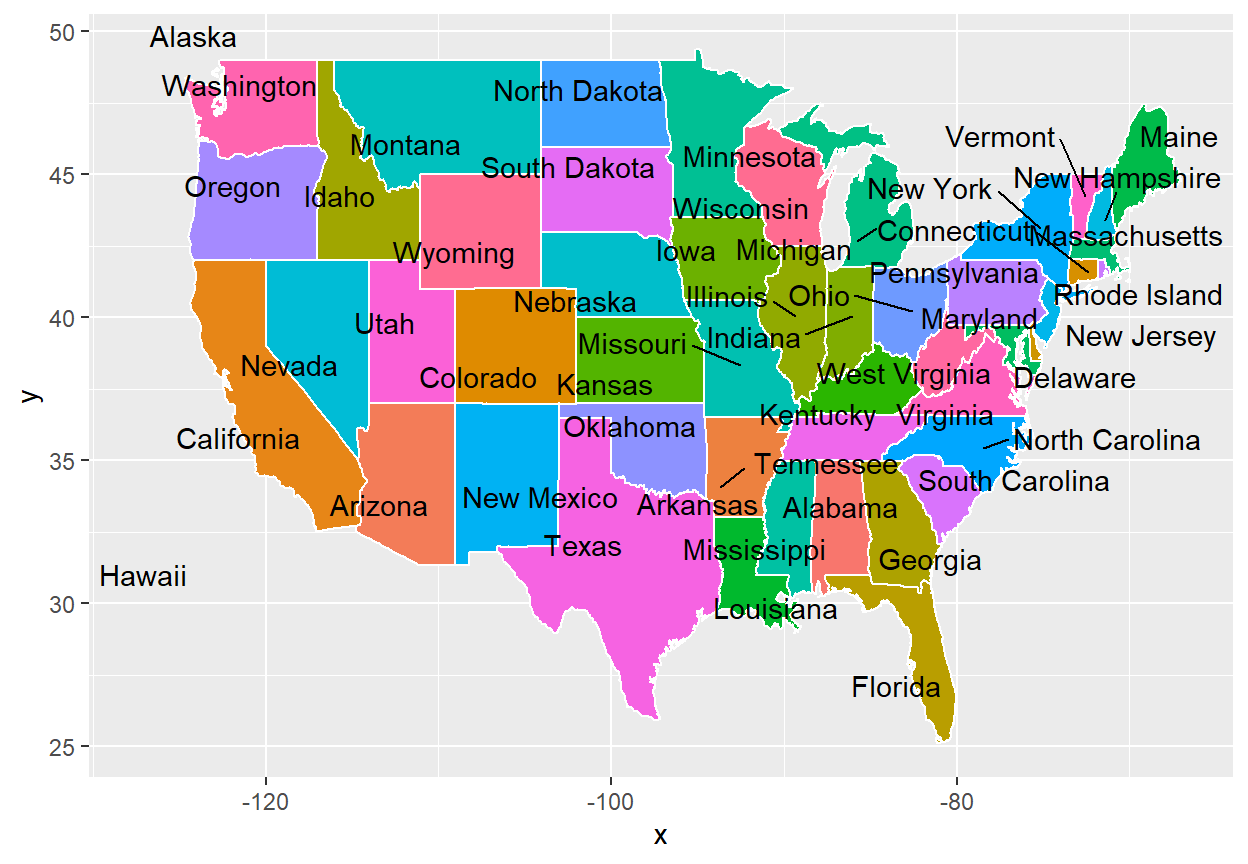
If your data set contains a variable with groups or labels you can pass it to the label argument.
p +
  geom_text(aes(label = state))
Adding labels with geom_label
If you prefer adding labels instead of raw text use geom_label. The function behaves the same as the previous but with a background, making the text easier to read.
Label annotation
p +
  geom_label(aes(x = -115, y = 25,
                label = "Map of the United States"),
            stat = "unique")
Customizing the label
p +
  geom_label(aes(x = -115, y = 25,
                label = "Map of the United States"),
            stat = "unique",
            size = 5, color = "red", fill = "green")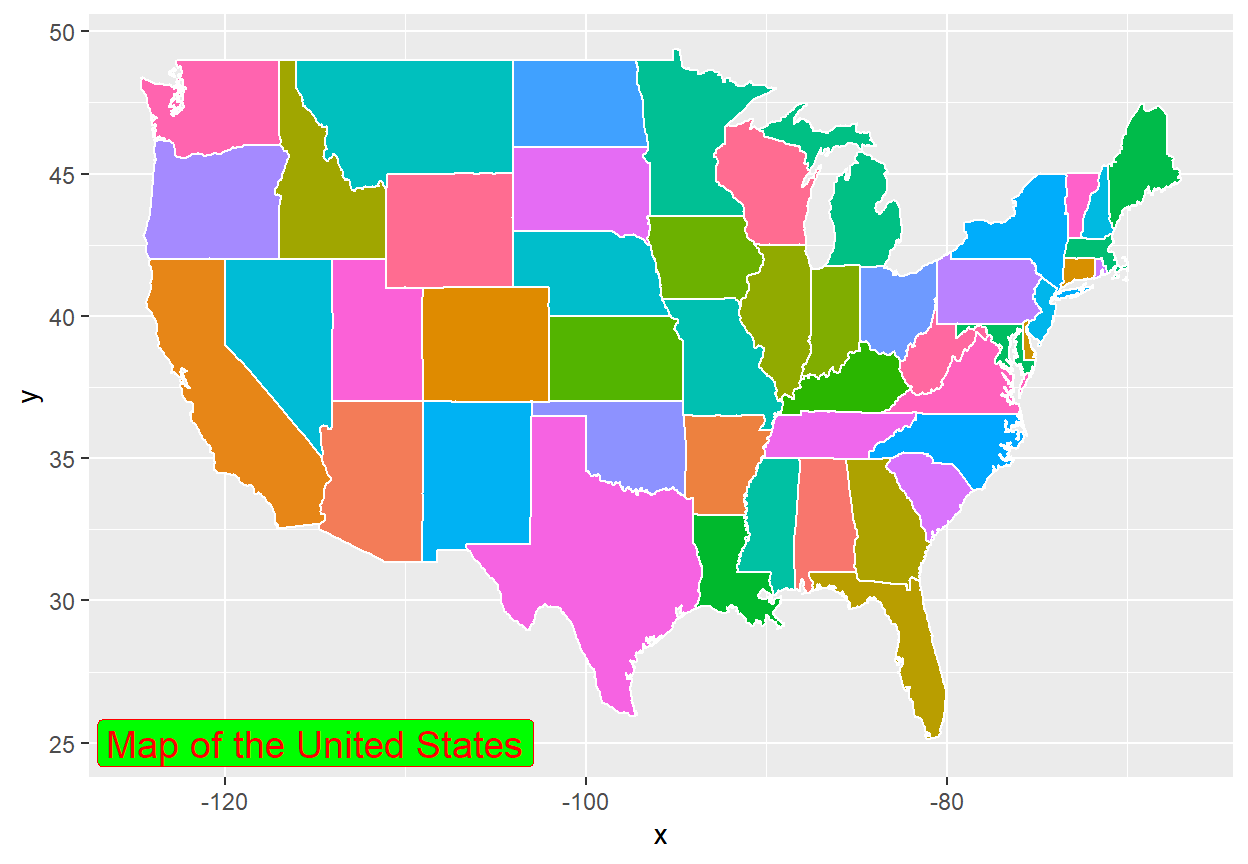
Labelling points
p +
  geom_label(aes(label = state))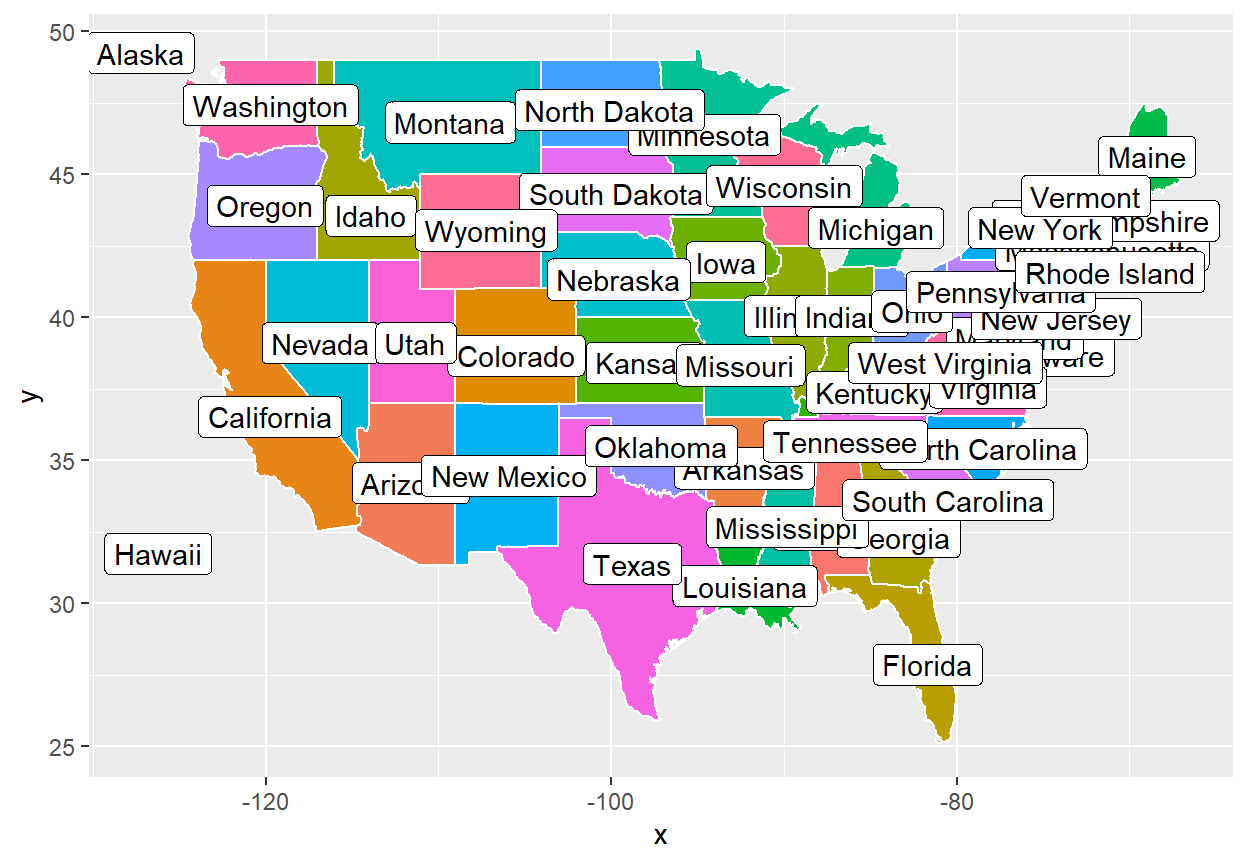
Use ggrepel to avoid overlapping of the texts or labels.
Avoid overlapping with ggrepel
The text and the labels are placed on the coordinates you set, but can overlap. The ggrepel package provides geom_text_repel and geom_label_repel functions, which make the labels repel away from each other as much as possible.
geom_text_repel
# install.packages("ggrepel")
library(ggrepel)

p +
  geom_text_repel(aes(label = state))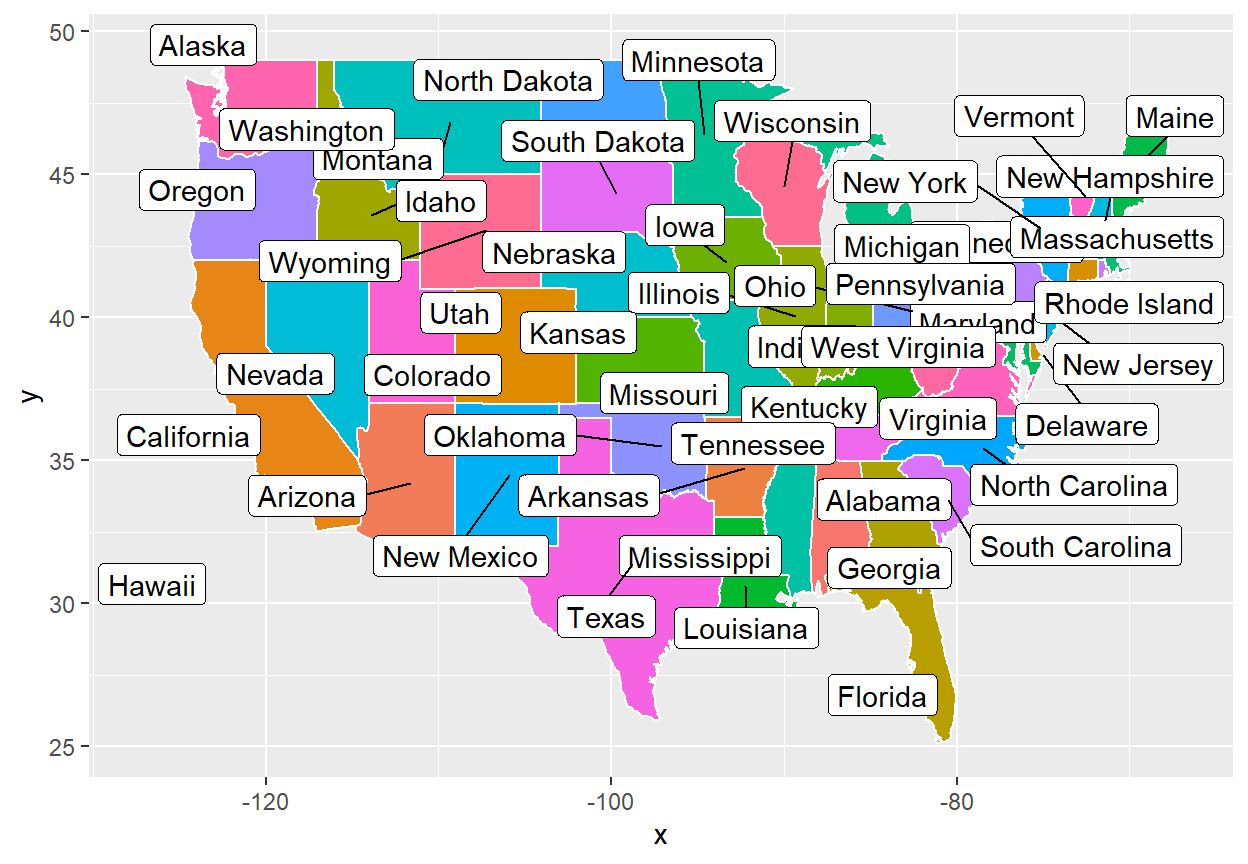
geom_label_repel
# install.packages("ggrepel")
library(ggrepel)

p +
  geom_label_repel(aes(label = state))
You can customize the colors, fonts and other arguments the same way as with geom_text or geom_label. See the package examples for more use cases.
Use markdown and HTML with ggtext
If you want to fully customize you annotations use the geom_richtext function from ggtext, which allows you to add markdown and HTML formatting to your text annotations.
Add rich text
# install.packages("ggtext")
library(ggtext)

lab <- "*Map* of <span style = 'color:red'>USA</span>"
p +
  geom_richtext(aes(x = -115, y = 25,
                    label = lab))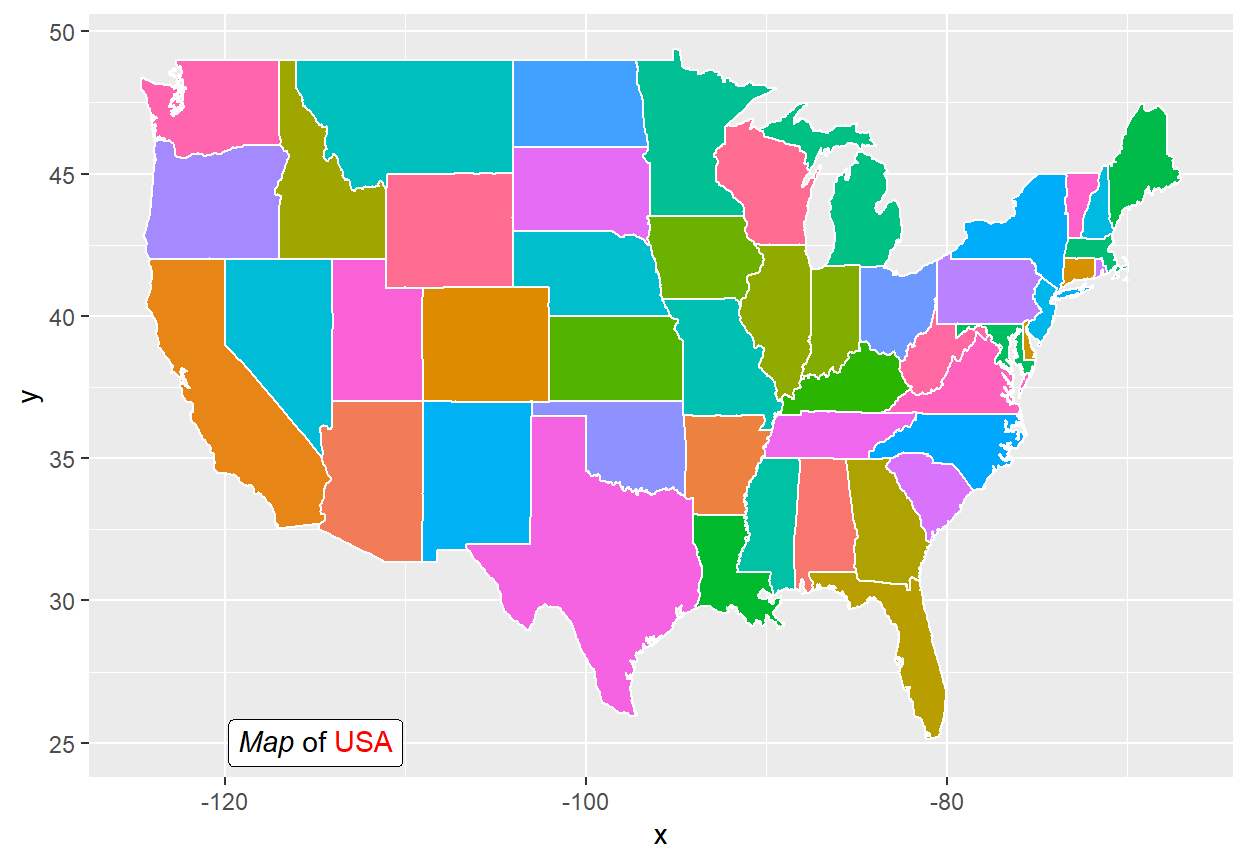
Rotate the text
You can even rotate the text, a feature that is not available with default ggplot2.
# install.packages("ggtext")
library(ggtext)

lab <- "*Map* of <span style = 'color:red'>USA</span>"
p +
  geom_richtext(aes(x = -115, y = 27,
                    label = lab),
                angle = 25)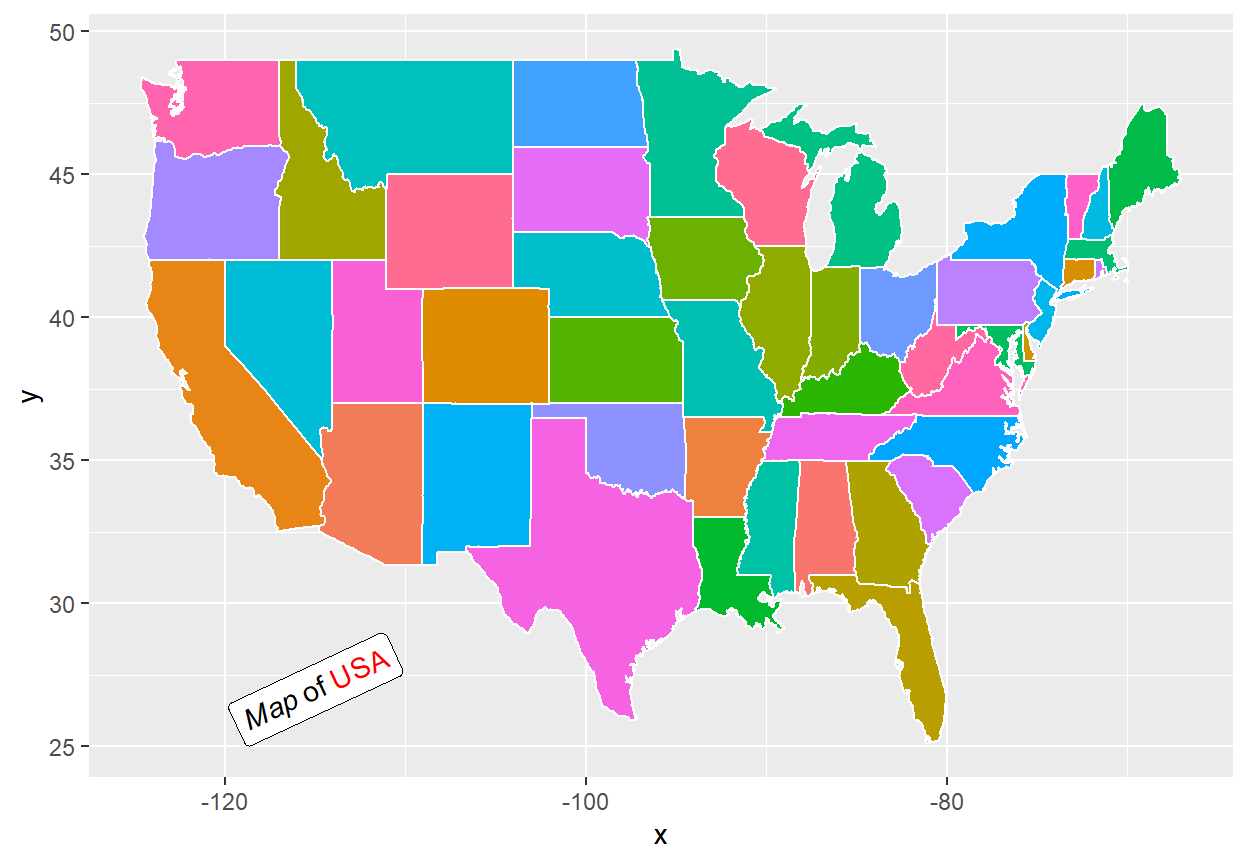

Master Statistics
Learn statistics from the basics to advanced techniques, clearly explained
Go to site