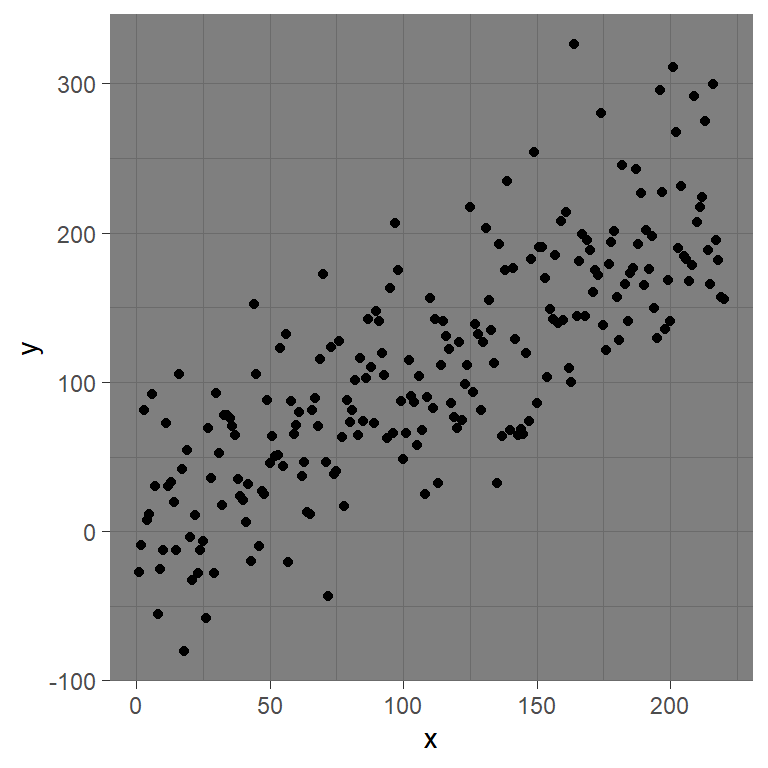
Default plot
By default, ggplot2 plots have a gray panel and a white background.
library(ggplot2)

# Sample data
set.seed(123)
x <- 1:220
y <- x + rnorm(220, sd = 50)

df <- data.frame(x = x, y = y)

# Plot
ggplot(data = df, aes(x = x, y = y)) +
  geom_point()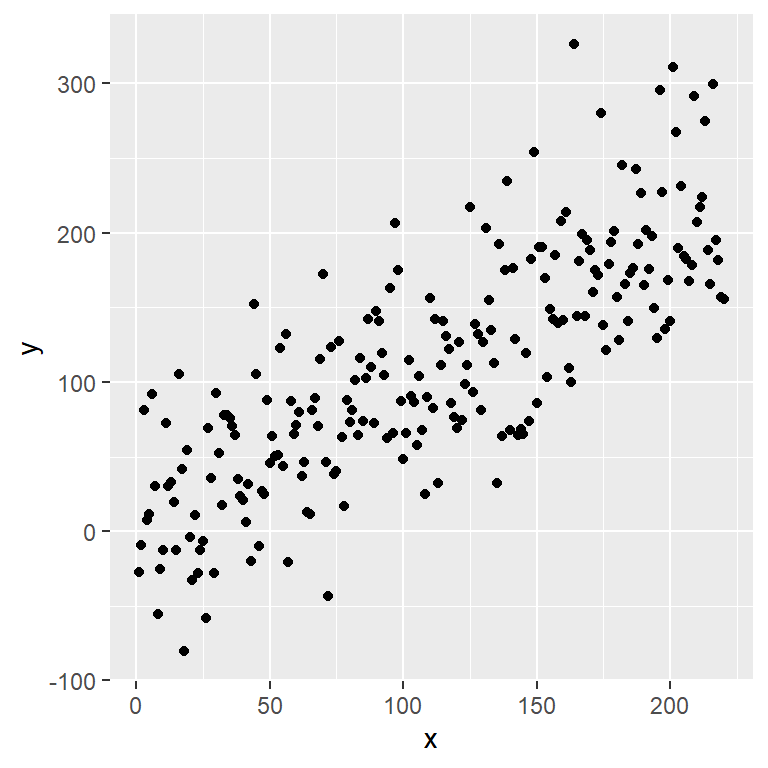
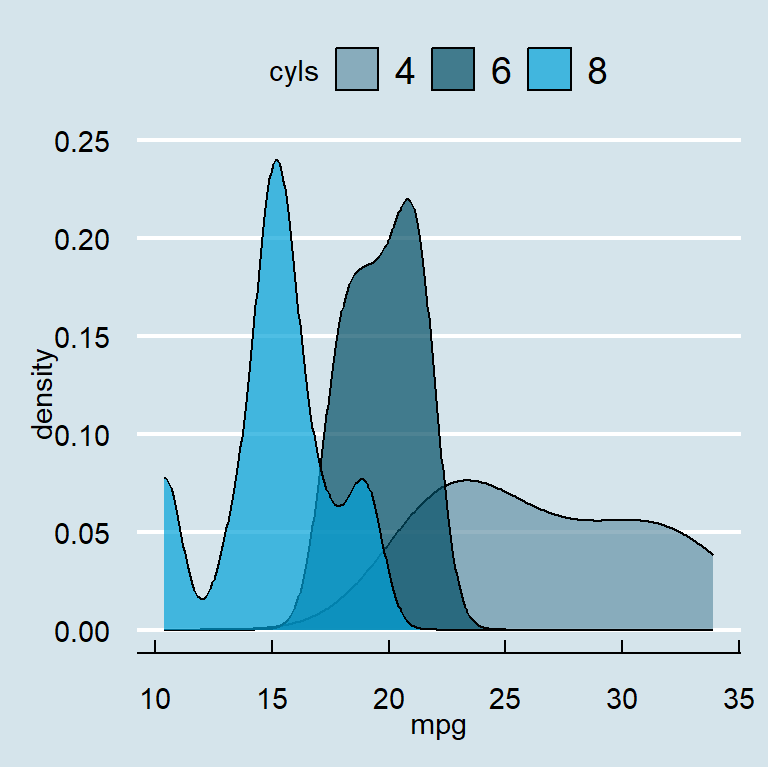
Panel background color
You can change the panel background color setting an element_rect in the panel.background component of the theme function as follows.

library(ggplot2)

ggplot(data = mtcars, aes(x = mpg, y = cyl))+
  geom_point() +
  theme(panel.background = element_rect(fill = "#67c9ff"))
Panel border color
Option 1
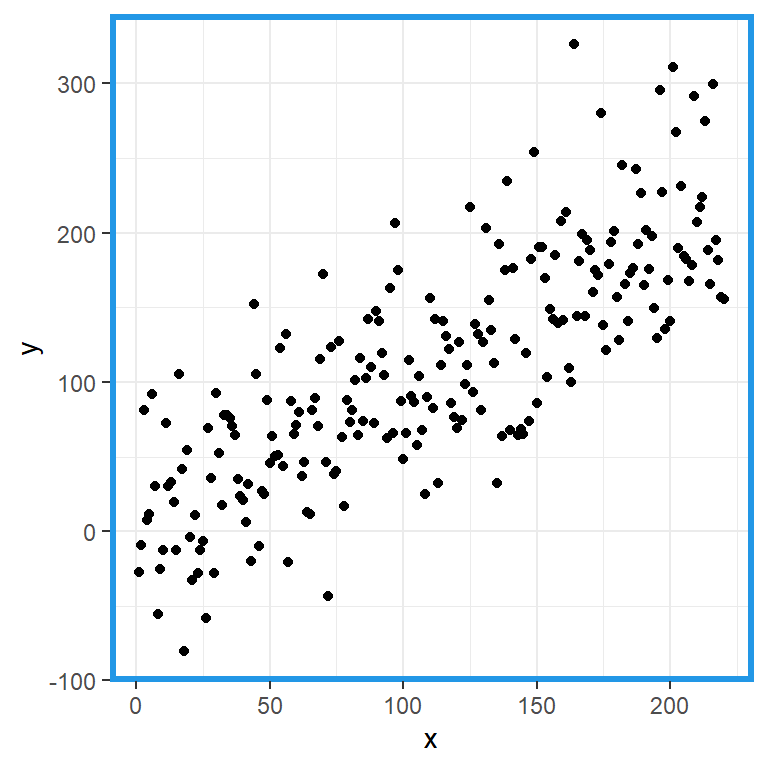
The panel.border component of the theme function controls the color and width of the border of the panel with the color and size arguments. However, you will need to set fill = "transparent" to avoid hiding the data.
library(ggplot2)

ggplot(data = df, aes(x = x, y = y)) +
  geom_point() +
  theme_bw() +
  theme(panel.border = element_rect(fill = "transparent", # Needed to add the border
                                    color = 4,            # Color of the border
                                    size = 2))            # Border width
Option 2
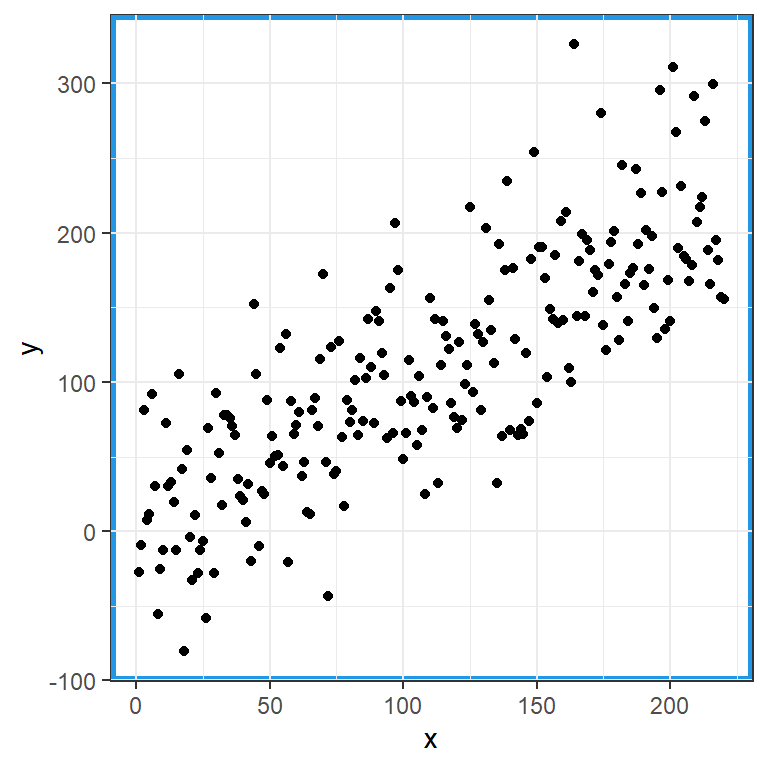
You can also set a element_rect for the panel.background component and modify the border color with the color argument. However, this is not the recommended workflow, as it doesn’t override the current border. You can check this with theme_bw (Note that the black border is behind the blue border).
library(ggplot2)
ggplot(data = df, aes(x = x, y = y)) +
geom_point() +
theme_bw() +
theme(panel.background = element_rect(color = 4, # Color of the border
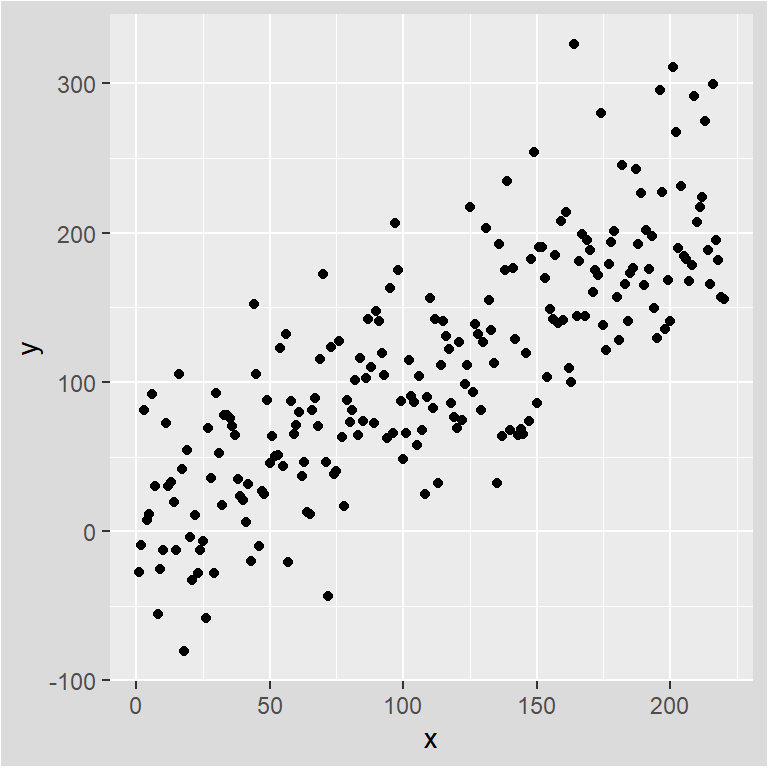
size = 2)) # Border widthPlot background color
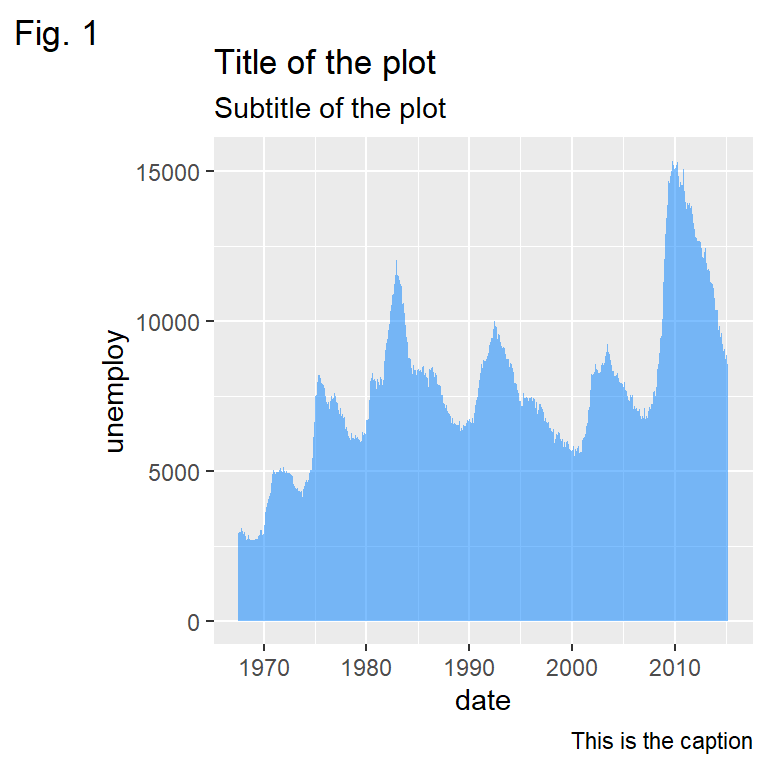
The plot.background component of the theme function allows modifying the background color of the figure. Set the color inside the fill argument of an element_rect.
library(ggplot2)

ggplot(data = mtcars, aes(x = mpg, y = cyl))+
  geom_point() +
  theme(plot.background = element_rect(fill = "gray86")) # Background color of the plot
Plot border color
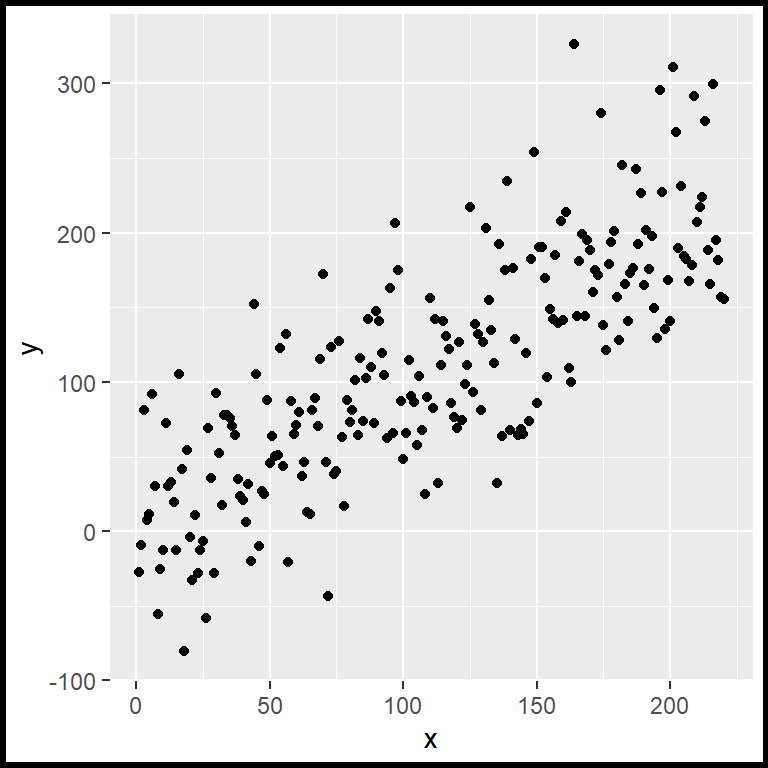
You can also set a border color for the whole figure. Just pass an element_rect to the plot.background component of the theme function and modify the color and the width of the border with the arguments color and size, respectively.
library(ggplot2)

ggplot(data = df, aes(x = x, y = y)) +
  geom_point() +
  theme(plot.background = element_rect(color = "black", # Border color
                                       size = 2))       # Border width
Changing the colors with themes
It is worth mentioning that there are lots of ggplot themes available that provide different background colors.
In this example we are setting the theme_dark, which is one of the in-built ggplot2 themes.
library(ggplot2)

ggplot(data = df, aes(x = x, y = y)) +
  geom_point() +
  theme_dark()
Note that the default theme is theme_grey.
Color picker
Use the color pickers to change the panel color (left) and the plot color (right), or to generate random colors pressing the blue button. Then you can copy the colors and use them in your plots.

Master Statistics
Learn statistics from the basics to advanced techniques, clearly explained
Go to site